- What an option chain is
- Open interest, and what it is not
- The four buildup states
- OI walls, and how much to trust them
- PCR and max pain
- Implied volatility, IV rank and IV percentile
- At-the-money should come off the synthetic future
- A reading order that works
- Reading the chain at speed, in Options Analytics
- Common questions
What an option chain is
Open interest jumps. IV moves. Price breaks a level. And you're still three columns behind, doing arithmetic in your head, when the move you were reading about finishes without you.
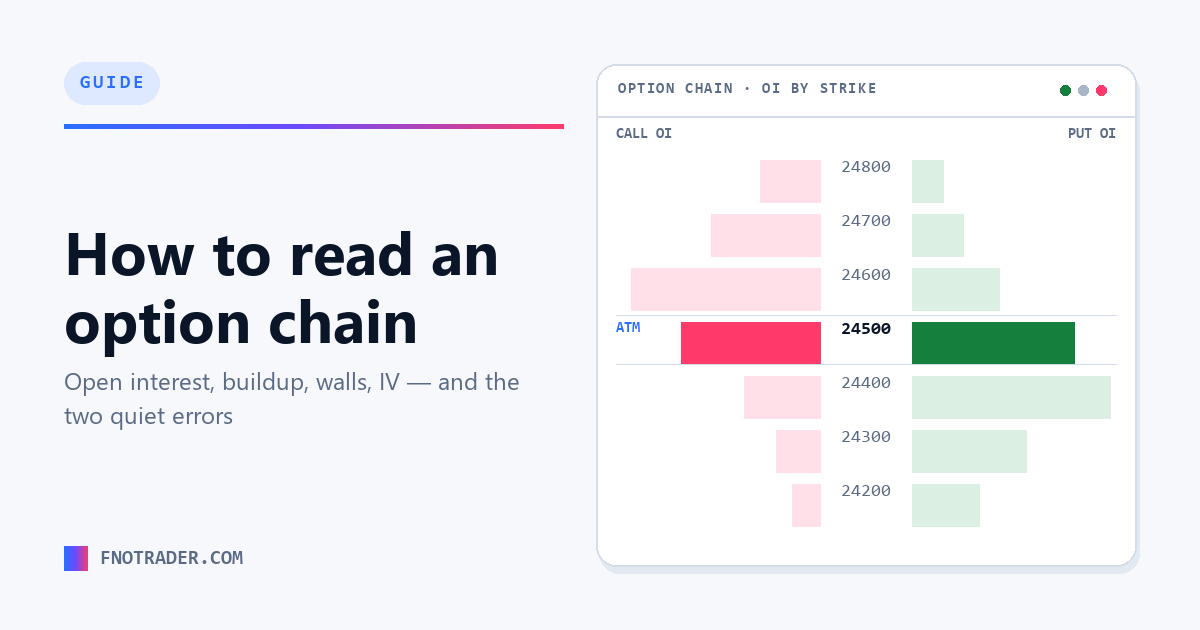
The chain itself is simple enough: every call and put on an underlying for one expiry, one row per strike, calls left and puts right with the strike ladder down the middle. Last price, volume, open interest, change in open interest, implied volatility.
On Indian markets you will be reading chains for NIFTY, BANKNIFTY, FINNIFTY, SENSEX and BANKEX weeklies and monthlies, monthly stock options across the F&O universe, and MCX commodity options. Index weeklies expire on a fixed weekday; stock options are monthly only.
The chain tells you where contracts are held and how that changed since yesterday. It does not tell you which way price will go, and no arrangement of its columns turns it into something that does. Its value is that positioning is observable while intent is not.
Open interest, and what it is not
Open interest is the number of contracts currently open and unsettled. It rises when a new buyer and a new seller create a contract, falls when both sides close, and stays flat when a position simply changes hands between two people.
The single most common error is reading open interest as volume. Volume counts every trade during the session; open interest counts positions still standing at the end of it. A strike can print enormous volume and finish with open interest unchanged — that is positions being passed around, not new money arriving. The distinction matters because almost every conclusion people draw from a chain depends on it.
Change in open interest is usually more informative than the level. The level tells you where positions have accumulated over the life of the contract; the change tells you what happened today.
The four buildup states
Open interest on its own is ambiguous — a rise could mean new buyers or new sellers. Pairing it with the price change resolves that. The four combinations are the vocabulary most Indian chain analysis is conducted in:
| Price | Open interest | Reading | What it means |
|---|---|---|---|
| Up | Up | Long buildup | New buyers entering; fresh money taking the long side. |
| Down | Up | Short buildup | New sellers entering; fresh money taking the short side. |
| Up | Down | Short covering | Existing sellers closing out; no new commitment. |
| Down | Down | Long unwinding | Existing buyers closing out; no new commitment. |
The useful split is new money against old money. A rally on short covering and a rally on long buildup look identical on a price chart and are not the same event: the first is people leaving, and it ends when they have finished leaving. The second is people arriving.
OI walls, and how much to trust them
A strike carrying open interest far above its neighbours is commonly called a wall. Heavy call open interest above spot is read as a level sellers expect price to stall below; heavy put open interest below spot is read the same way on the downside.
Two qualifications are worth keeping. First, a wall marks where positions sit, not where price must stop — the two coincide often enough to be interesting and not often enough to be a rule. Second, walls move. The chain is rebuilt continuously and a level that looked immovable on Monday can be gone by Wednesday, particularly into expiry as positions roll.
Round numbers attract open interest for reasons that have nothing to do with any view on price. A large position at 25,000 may simply be there because people write round strikes.
PCR and max pain
Put-call ratio is put open interest divided by call open interest. Above 1 means more puts outstanding than calls. It is conventionally read as a contrarian sentiment gauge, and it is very sensitive to which strikes you include — a whole-chain PCR and a near-the-money PCR routinely disagree, so a PCR quoted without its range is close to meaningless.
Max pain is the strike at which the aggregate value of all outstanding options would be lowest at expiry — the strike causing option buyers the largest combined loss. It is a property of the current open-interest distribution and is recomputed whenever that distribution changes. It is not a prediction of where settlement will occur, and it moves as the chain moves.
Both are best treated as descriptions of the present rather than statements about the future. They are worth watching because they change, and the change is the signal.
Implied volatility, IV rank and IV percentile
Implied volatility is the volatility figure that, fed into a pricing model, reproduces the option's actual traded price. It is derived from price rather than measured from history — which is the difference between implied and realised volatility, and the reason the two can diverge for long stretches.
A raw IV number is hard to act on without context, which is what the two normalisations provide. IV rank scales today's IV between the lowest and highest of the past year. IV percentile is the share of days in that year on which IV was lower than today.
They answer different questions, and IV percentile is usually the steadier of the two: a single extreme spike sets the top of the range and drags IV rank down for months afterwards, while IV percentile is unaffected by it.
At-the-money should come off the synthetic future
At-the-money is the strike closest to the underlying's price — but which price? Taking it from spot is the second quiet error in chain reading.
Options are priced off forward value, not spot. The forward implied by the options themselves is the synthetic future, computed at a strike as strike + call price − put price. On days when carry is significant, the synthetic future sits meaningfully away from spot, and at-the-money selected from spot can land a strike or two off.
This matters more than it sounds. Everything anchored to at-the-money inherits the error — straddle prices, IV readings taken at the money, strike offsets in a strategy, and any backtest whose entry rule says "sell the ATM straddle". Getting the reference right once fixes all of them.
A reading order that works
Chains reward a fixed sequence, because it stops you finding the story you went looking for:
- Establish the reference. Take the synthetic future, then at-the-money from it.
- Read change in open interest before level. What happened today, then where the accumulated positions sit.
- Classify the buildup at the strikes that moved, so you know whether you are looking at new money or people leaving.
- Place implied volatility in its own history with IV percentile — whether options are expensive is a separate question from which way price is going.
- Then look at PCR and max pain, as descriptions of the current distribution rather than as signals.
Doing it in this order means the ambiguous readings arrive last, when there is already enough context to discount them.
Reading the chain at speed, in Options Analytics
Everything above is doable by hand. The problem is that the chain changes while you're doing it — and by the time you've worked out what the buildup means, the move has happened.
Options Analytics does that reading for you, live. Buildup is classified at every strike as it changes, walls are marked, at-the-money is taken from the synthetic future rather than spot, and IV is placed in its own history instead of quoted raw. You're looking at what the chain means, not at a grid of numbers you still have to decode.
The rolling at-the-money straddle is plotted as a continuous candle series, so straddle behaviour reads as a chart rather than a number you keep re-checking. And when you want to act on what you're seeing, the QuikTrade Terminal sends the whole structure as one order instead of leg by leg.
Covers NIFTY, BANKNIFTY, FINNIFTY, SENSEX, BANKEX, stock options and MCX. Connects to any Indian stock broker — all major brokers, 100+ supported. Full documentation is public: Options Analytics guide.
Start a 7-day free trial No card needed. Every app, one login.
Common questions
What is the difference between open interest and volume?
Volume counts every trade during a session. Open interest counts positions still open at the end of it. A strike can trade heavy volume and finish with open interest unchanged, which means positions changed hands rather than new positions being created.
What does long buildup mean in an option chain?
Long buildup is price rising together with open interest rising at that strike, indicating new buyers are entering rather than existing sellers closing. The other three states are short buildup (price down, OI up), short covering (price up, OI down) and long unwinding (price down, OI down).
Is max pain a reliable prediction of expiry?
No. Max pain is the strike at which outstanding options would be worth least at expiry, computed from the current open-interest distribution. It is recalculated whenever that distribution changes and describes present positioning rather than forecasting the settlement price.
Should at-the-money be taken from spot or from futures?
From the synthetic future, computed as strike plus call price minus put price. Options are priced off forward value, so on days with significant carry an at-the-money selected from spot can be a strike or two away from the true at-the-money.
What is a good PCR value?
There is no threshold that works generally. PCR is highly sensitive to the strike range included — a whole-chain reading and a near-the-money reading often disagree — so a PCR is only interpretable alongside the range it was computed over and its own recent history.
Which is better, IV rank or IV percentile?
IV percentile is usually steadier. A single volatility spike sets the top of the year's range and depresses IV rank for months afterwards, while IV percentile simply counts the days that were lower and is unaffected by the outlier.
Can I analyse option chains for stocks as well as indices?
Yes. Indian exchanges list monthly options on stocks in the F&O universe, alongside weekly and monthly index options on NIFTY, BANKNIFTY, FINNIFTY, SENSEX and BANKEX, plus options on MCX commodities.
Related
App: Options Analytics · Strategies: Options School (free, no login) · Definitions: trading glossary · Free tools: position sizing & risk calculators · More: all articles