






















A real-time technical scanner for NSE — 23 pattern setups, Stockbee-style market breadth, sector strength and Stage-2 leadership across a 2,300+ stock universe. Spot accumulation 5–15 sessions early, on Cash & FNO names.
You're scrolling charts one at a time, chasing names that already ran — and trading against the tide without knowing it.
Institutions accumulate quietly inside a base for weeks. Without a pocket-pivot / base engine you only see it after the breakout candle — when the easy entry has passed.
Eyeballing 2,300 stocks for VCPs and bull flags is impossible. You miss the cleanest setups simply because they never made it onto your screen.
Breakouts in weak industries fail at roughly 2× the rate. Without breadth and sector strength, you're long the right pattern in the wrong place.
Five core tools that turn 2,300 stocks into a clean shortlist of leadership setups, every evening.
A breakout is obvious to everyone the day it happens. The edge is seeing the stealth-buying inside the base — before the crowd.

You don't need 23 setups every day. You need the three that fit your style, scored and ranked, with the chart already drawn.

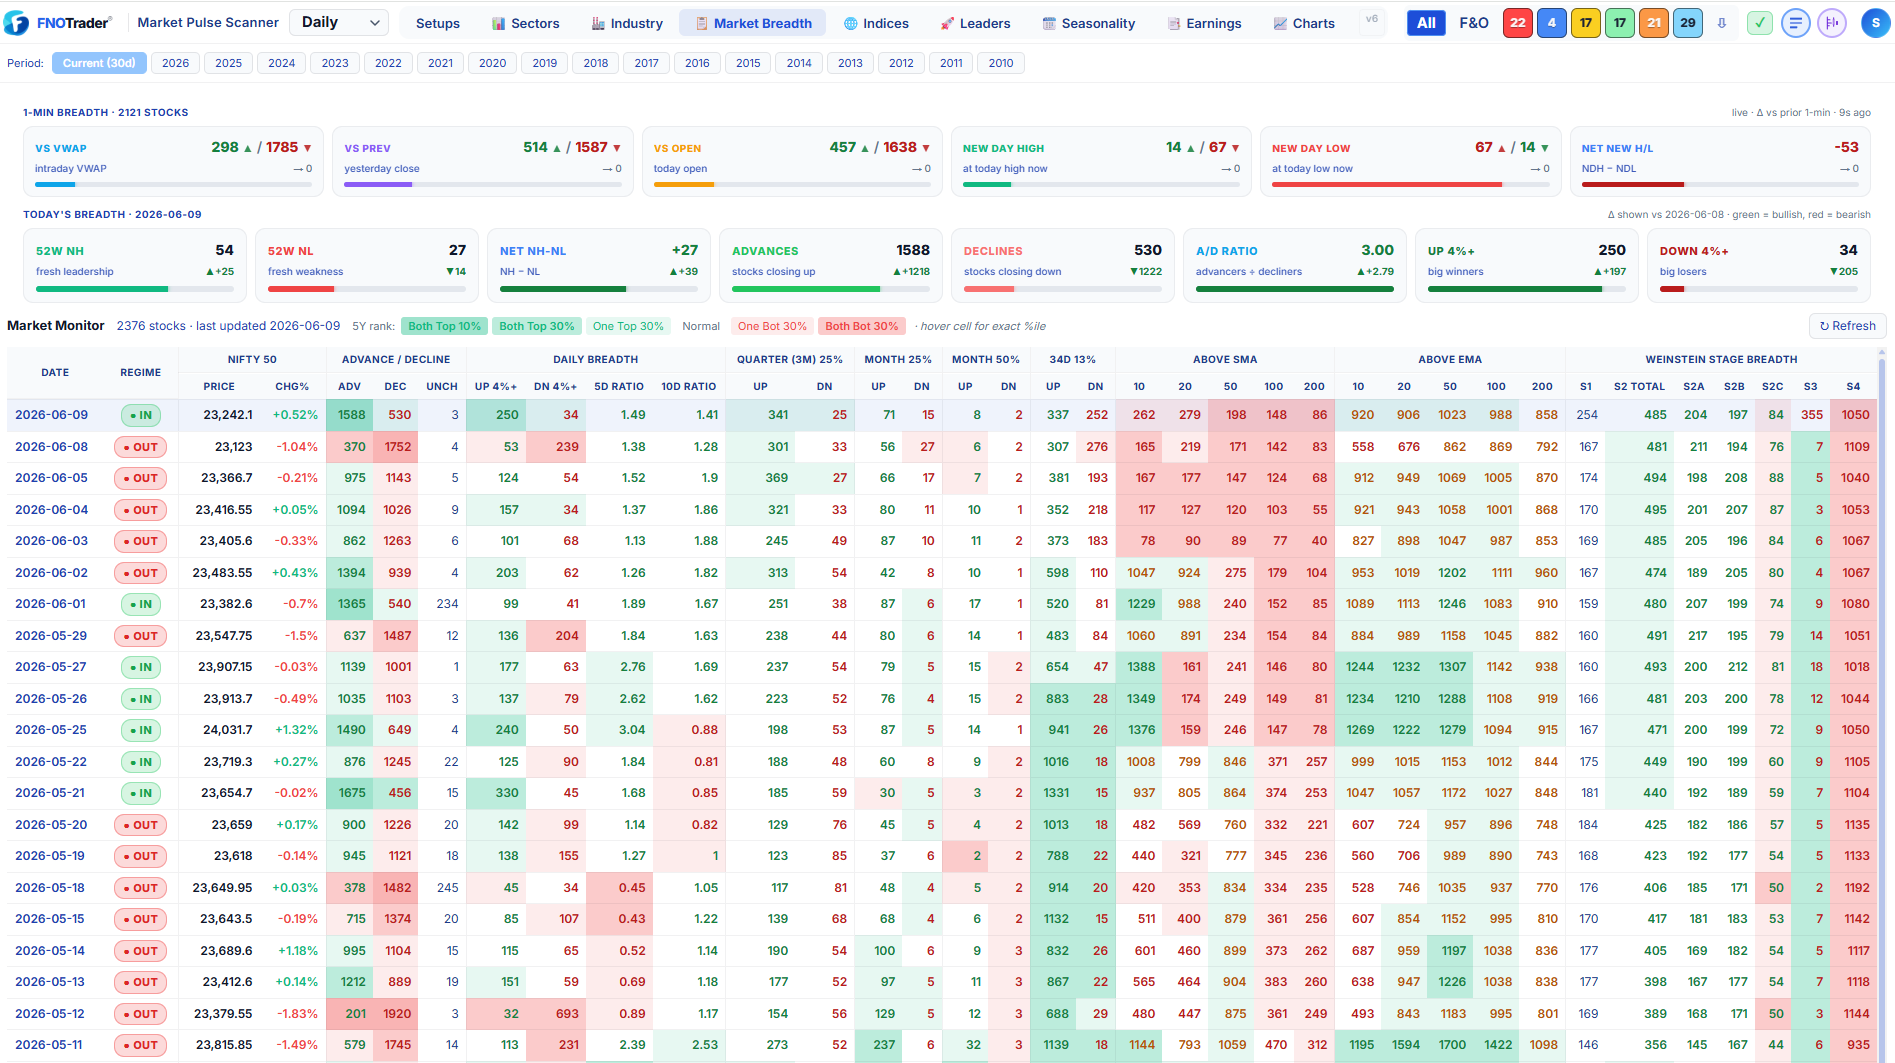
A market making new highs on narrowing breadth is a warning. You need the whole market's health in one screen, every day.

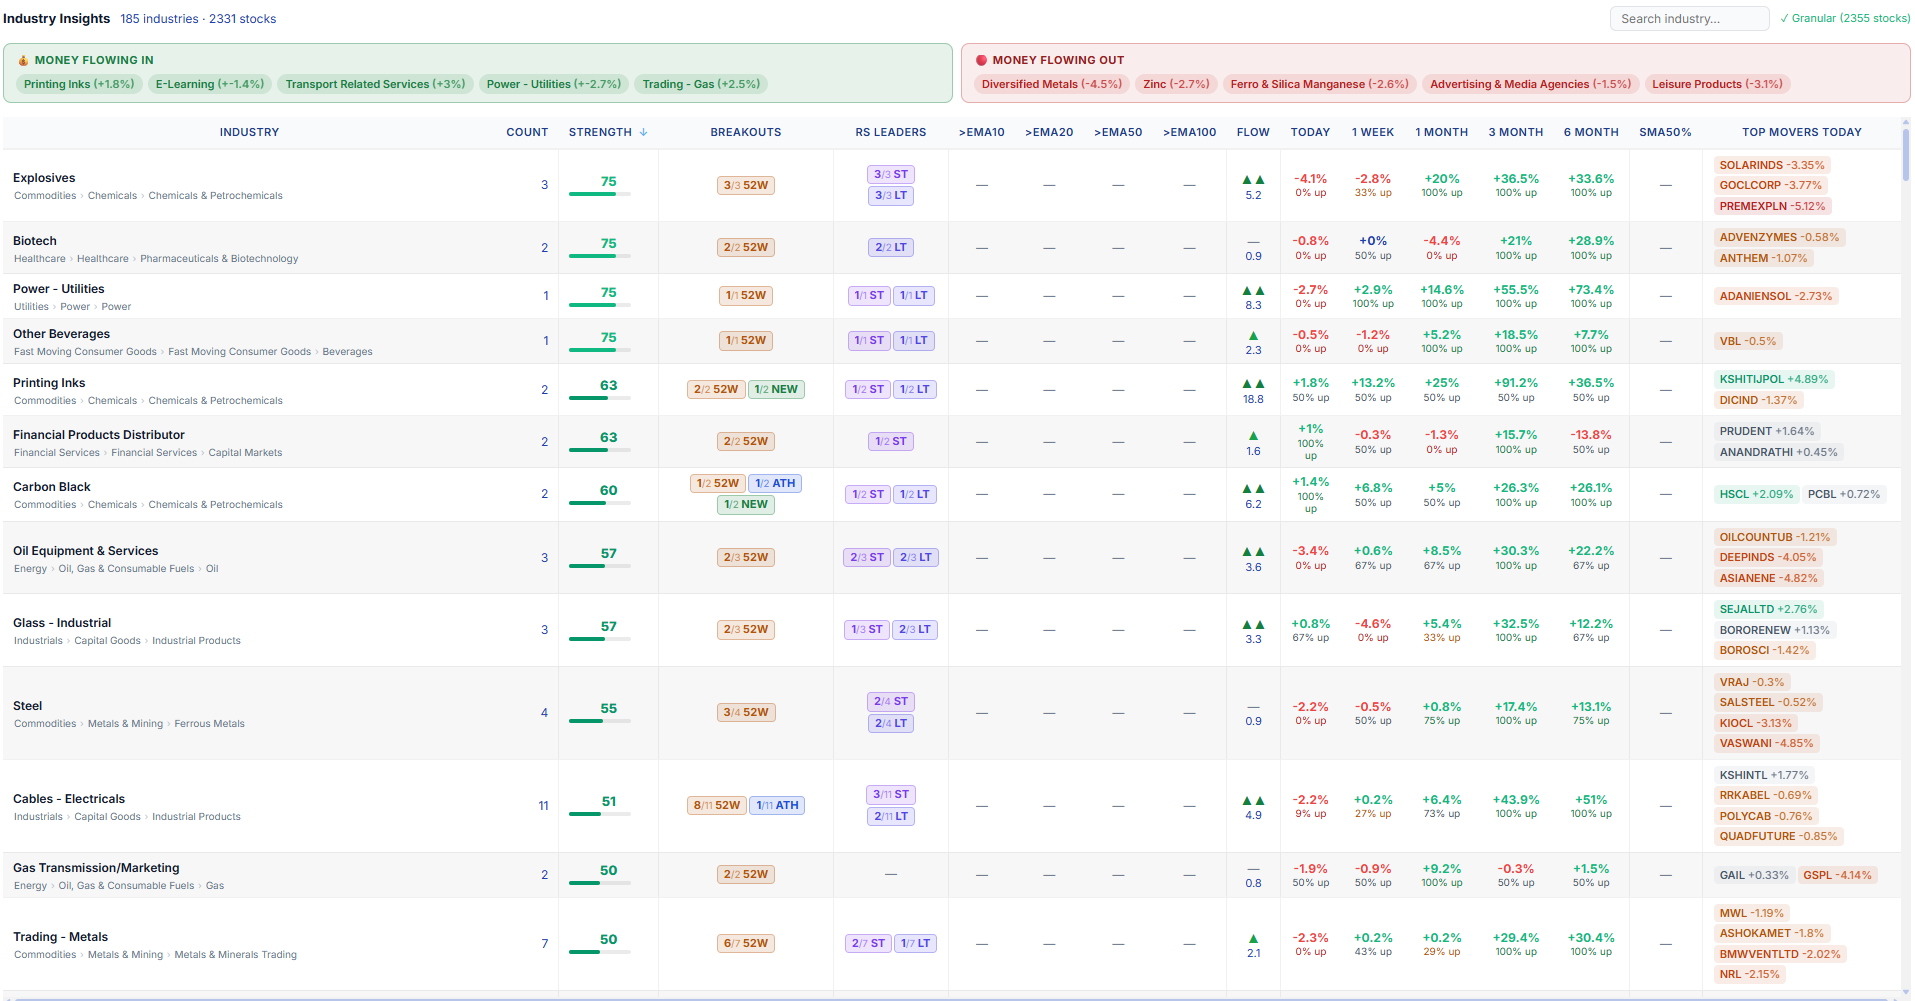
A great pattern in a dead industry fails. Find the groups where multiple stocks are breaking out together — that's structural, not luck.

Not every uptrend is buyable. You want Stage-2A markup with relative strength confirming, and a hard "do not trade" flag on the rest.

When Weinstein Stage, Mansfield RS and the Minervini Trend Template all line up, you're looking at the 5–10 strongest stocks in the market.
Stage 2A is the best risk/reward entry zone — early markup, just above a rising 30-week MA. Stack relative strength and the full trend template on top and the false positives fall away.

~30 fields — RS, Turnover, ADR, Stage, Setup, Industry. Write RS ST > 80 AND 1M > 15 and filter the grid live.
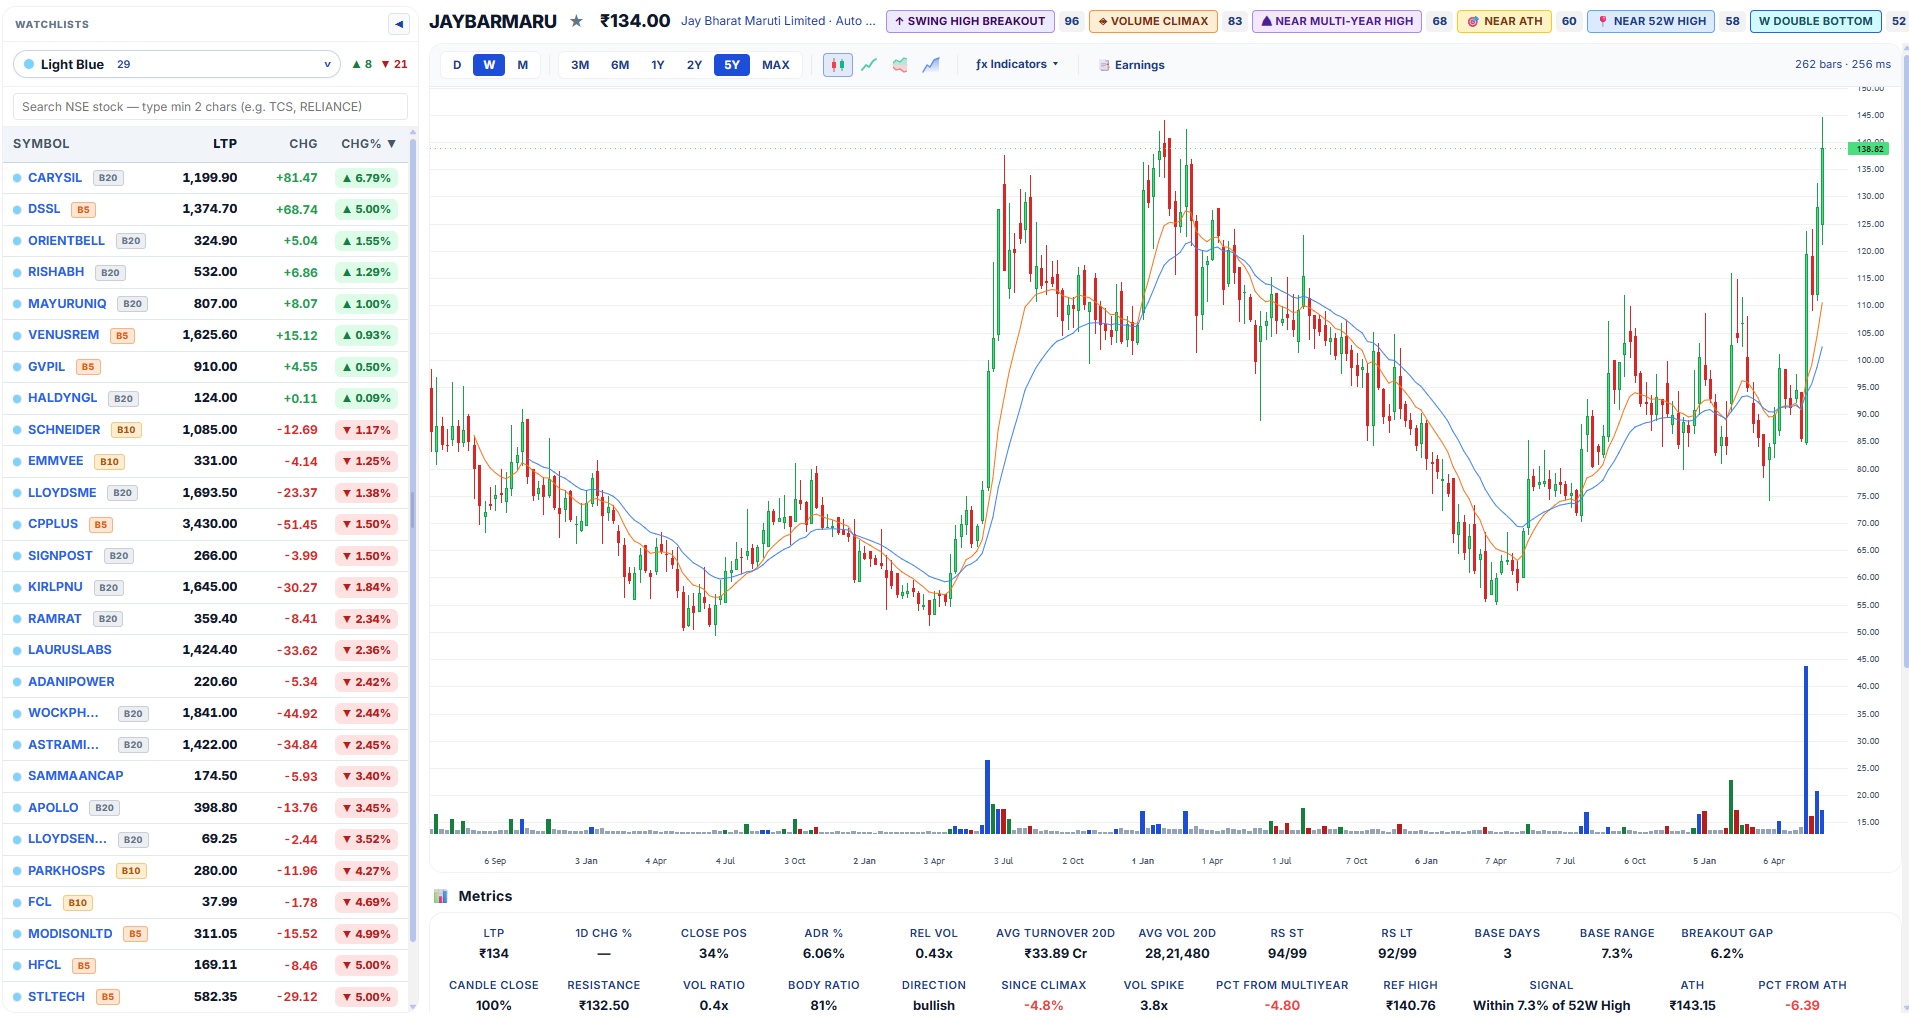
Six colour buckets + named watchlists. Export to TradingView format or sync to the trade app.
Big chart with the full TV toolset, drawing tools and a custom Pocket-Pivot-Volume indicator built in.
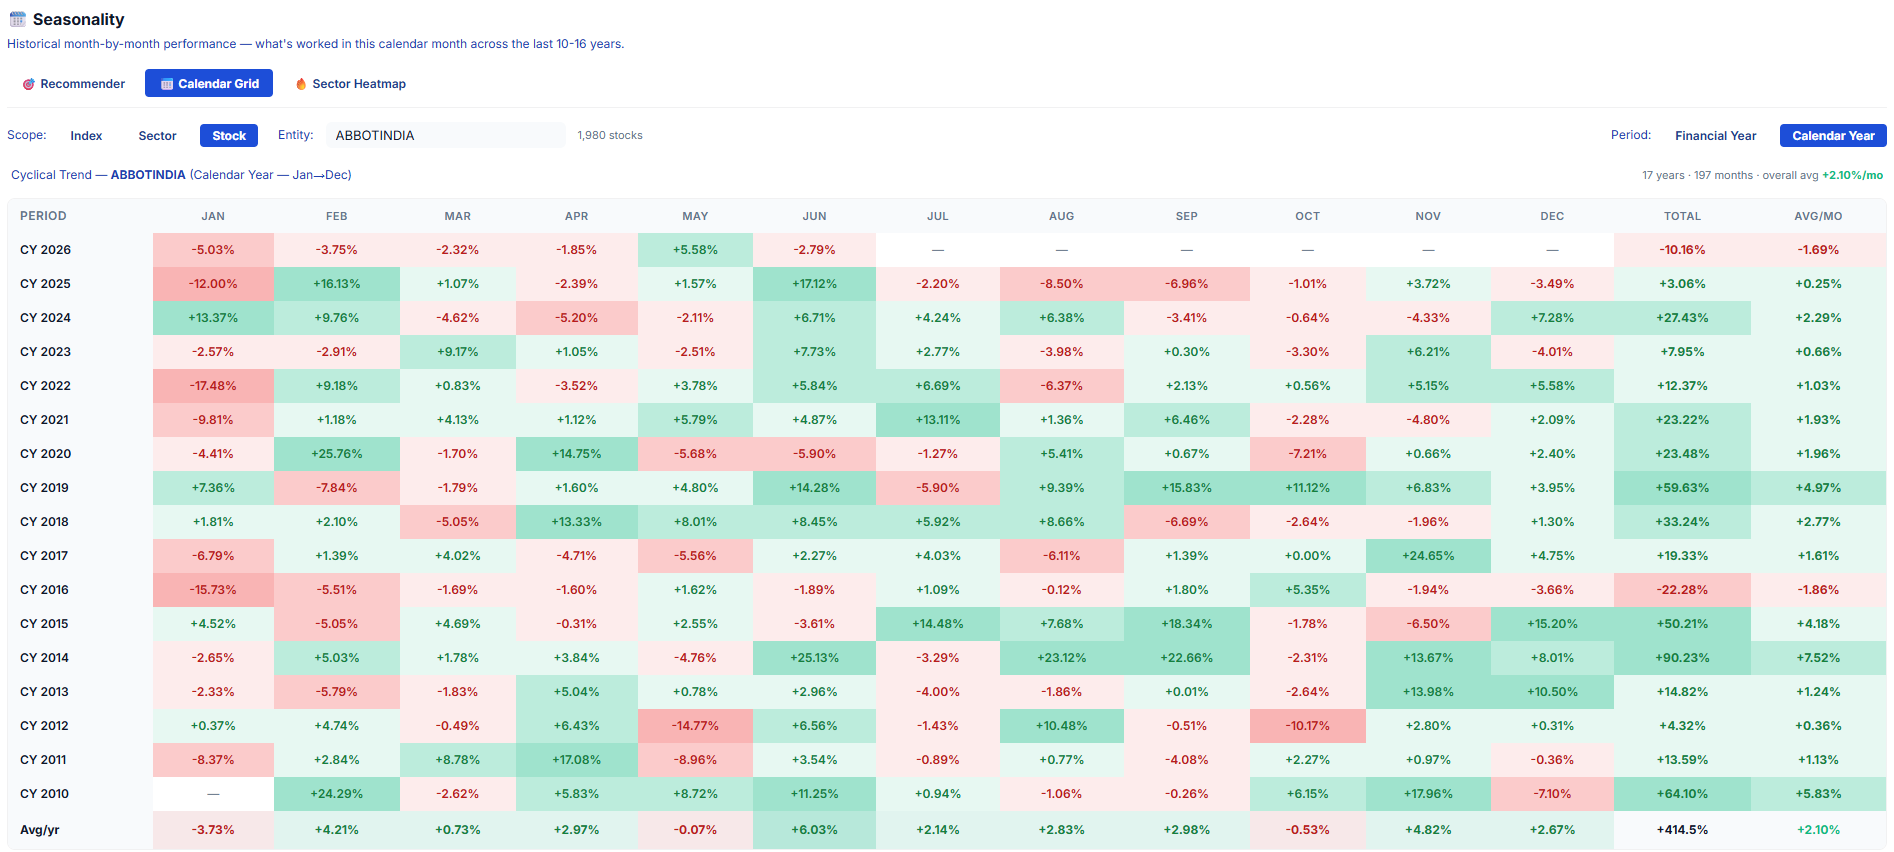
Month-by-month seasonality grid + an NSE earnings calendar so you never get blindsided by a result.
A real screening desk for NSE stocks — not a watchlist widget bolted onto a broker app.
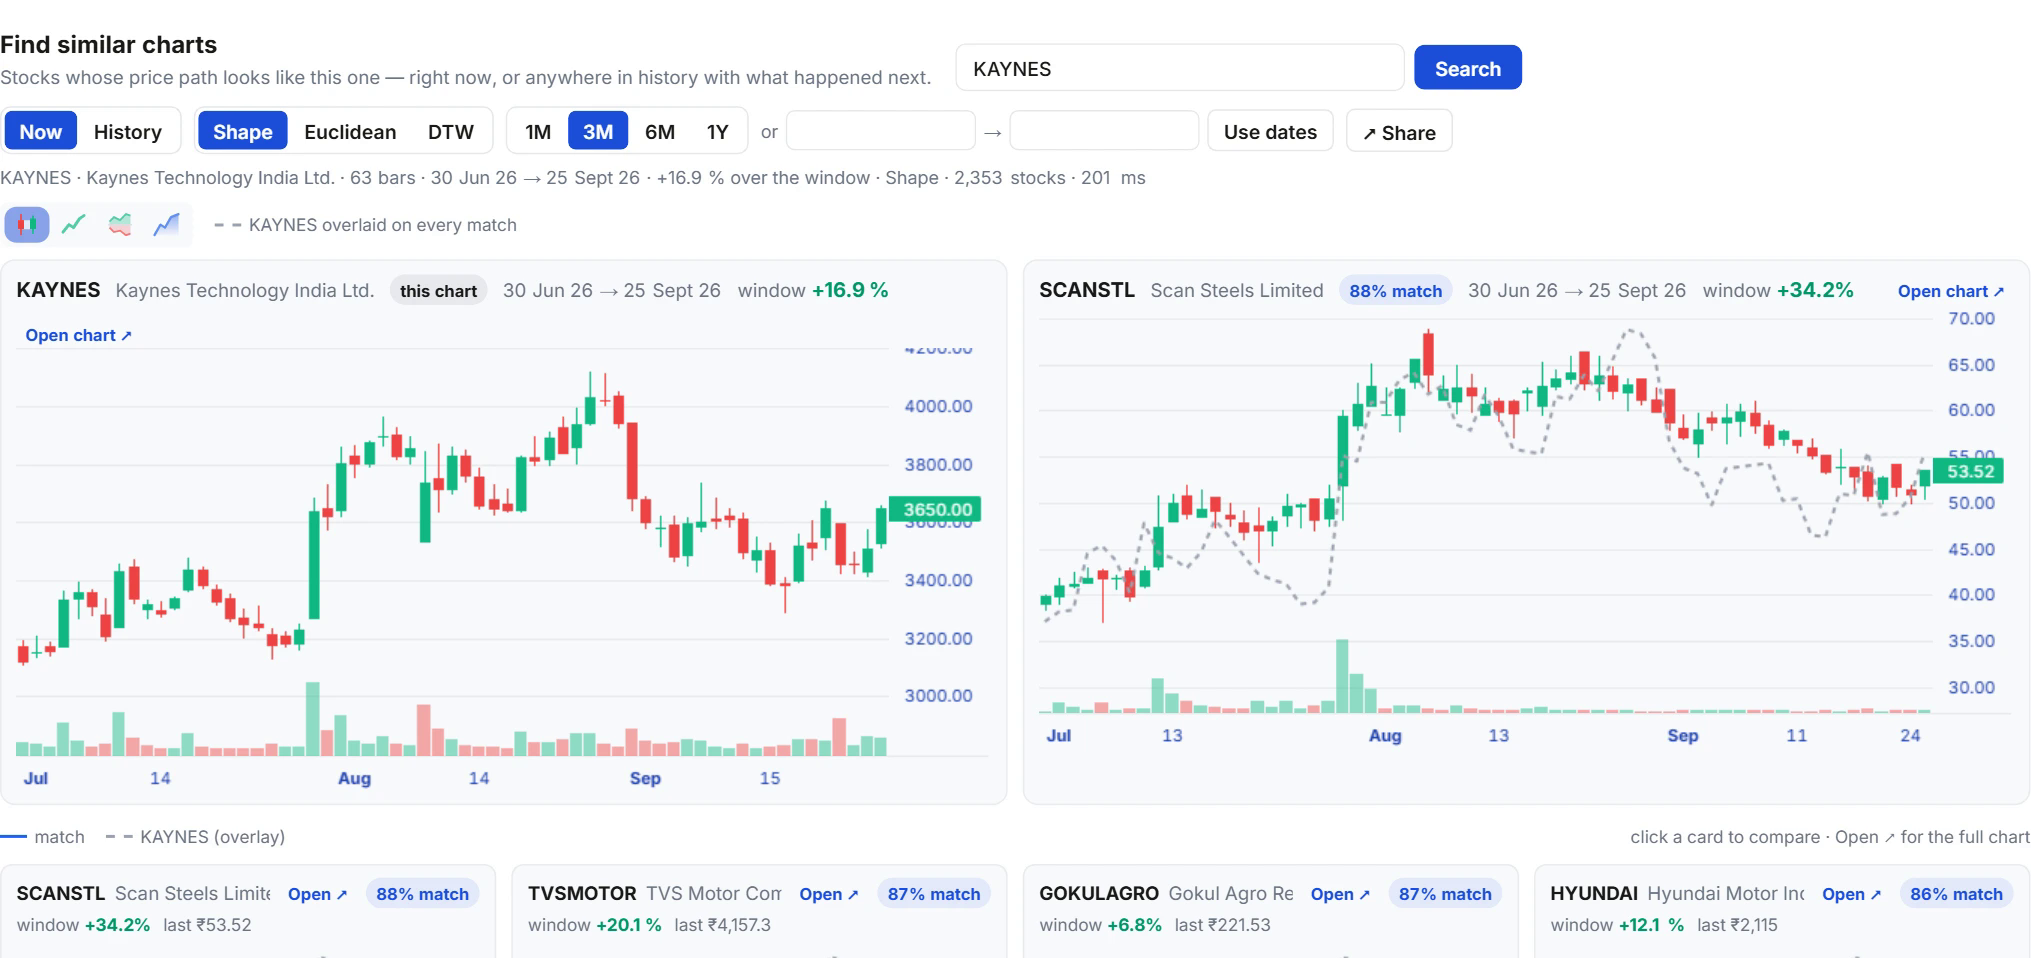
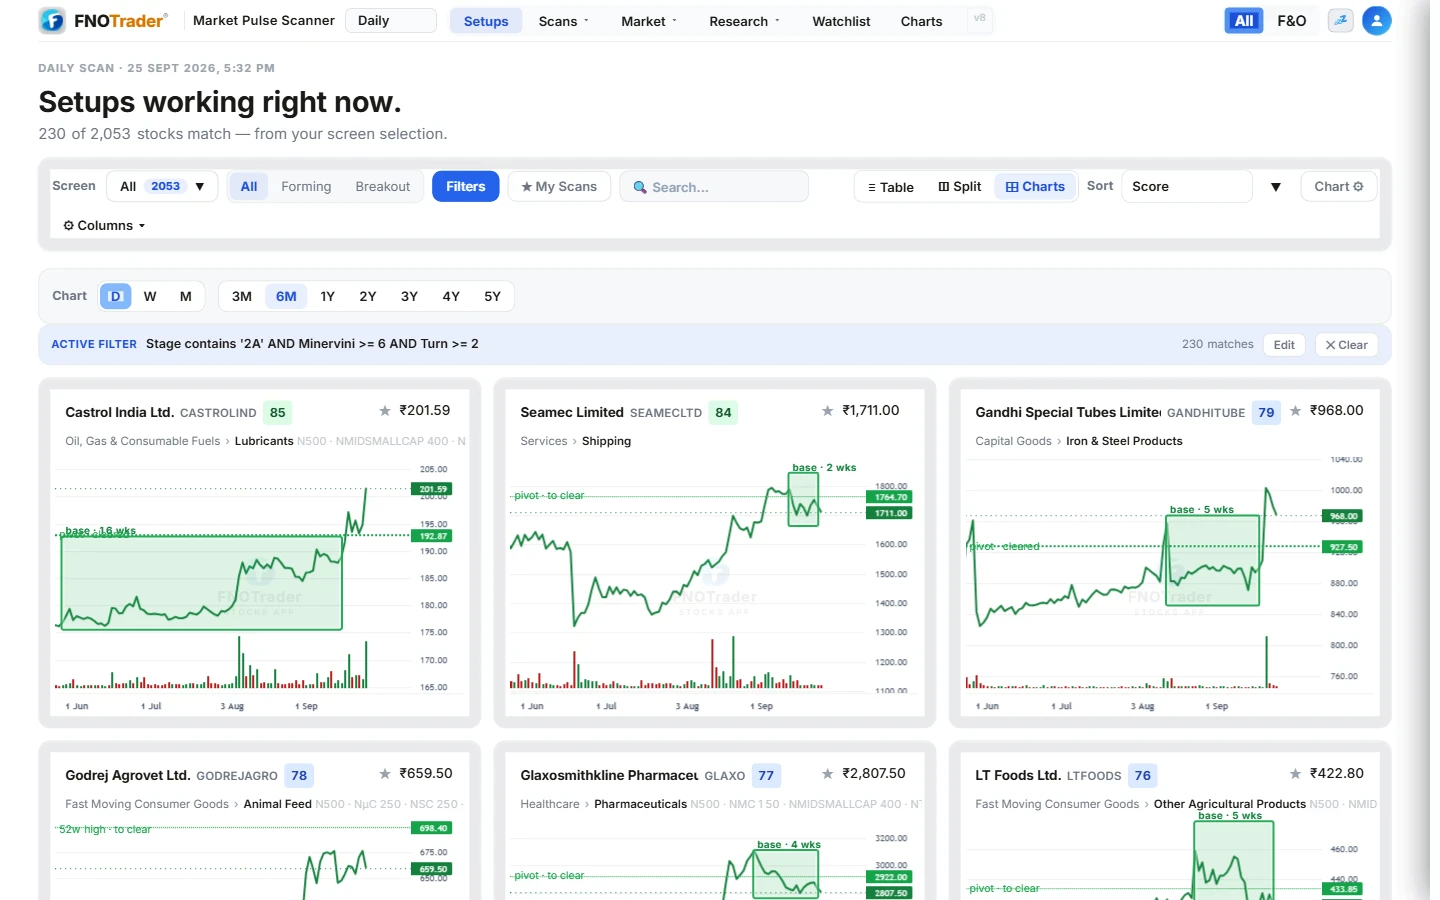
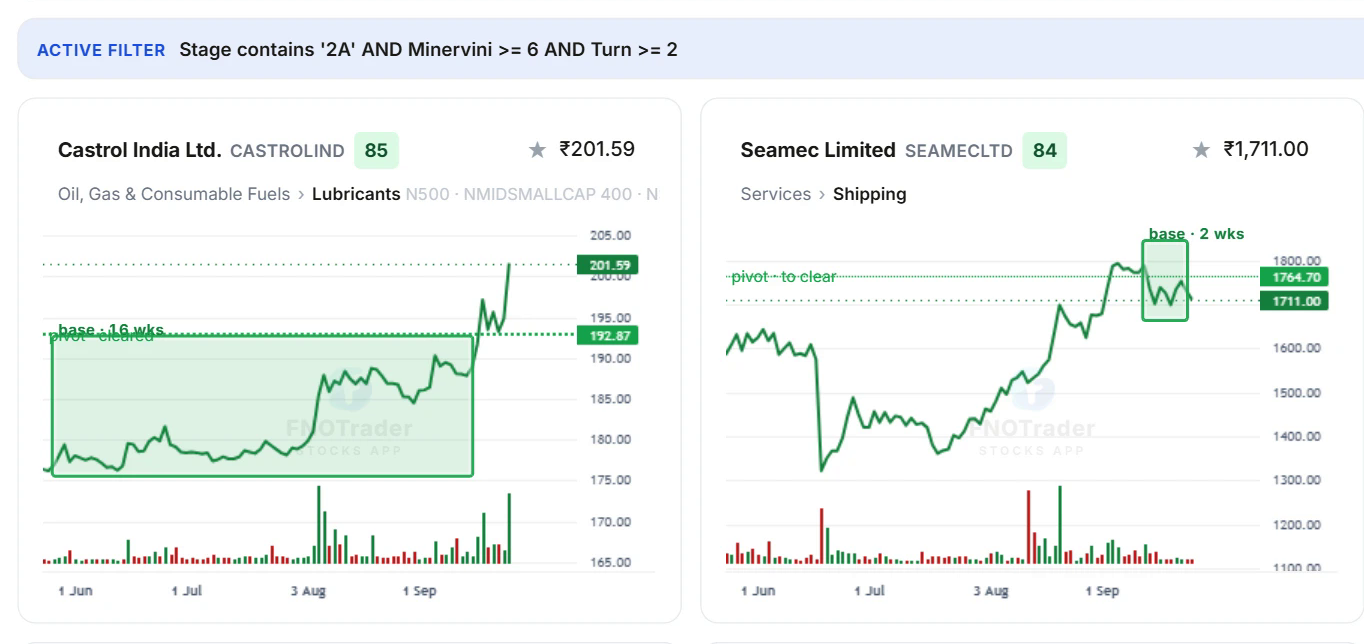
Every stock with a detected pattern — cards or sortable table.
ATH · 52W · Swing-High · Flat-Base · Momentum breakouts.
Bull Flag · High-Tight Flag · VCP · EMA Coil · Pause Day.
Minervini-style tight bases as supply dries up.
Stealth institutional buying inside the base, painted blue.
Re-entry on leaders that held a key moving average.
Double Bottom / Double Top, lower-high lower-low.
HVE / HVY / HVQ, Volume Climax & Spike, IPO listing.
Vol shockers, new highs, key-level breakouts (computed).
Same 23 patterns on daily, weekly & monthly bars.
High-conviction breakout/breakdown pullback entries.
0–99 quality blend — pattern, volume, RS, sector rank.
% above 20/50/200-DMA across ~2,200 stocks, by year.
A/D ratio, new highs vs lows, % up today.
VWAP / PREV / OPEN counts, refreshed every 30s.
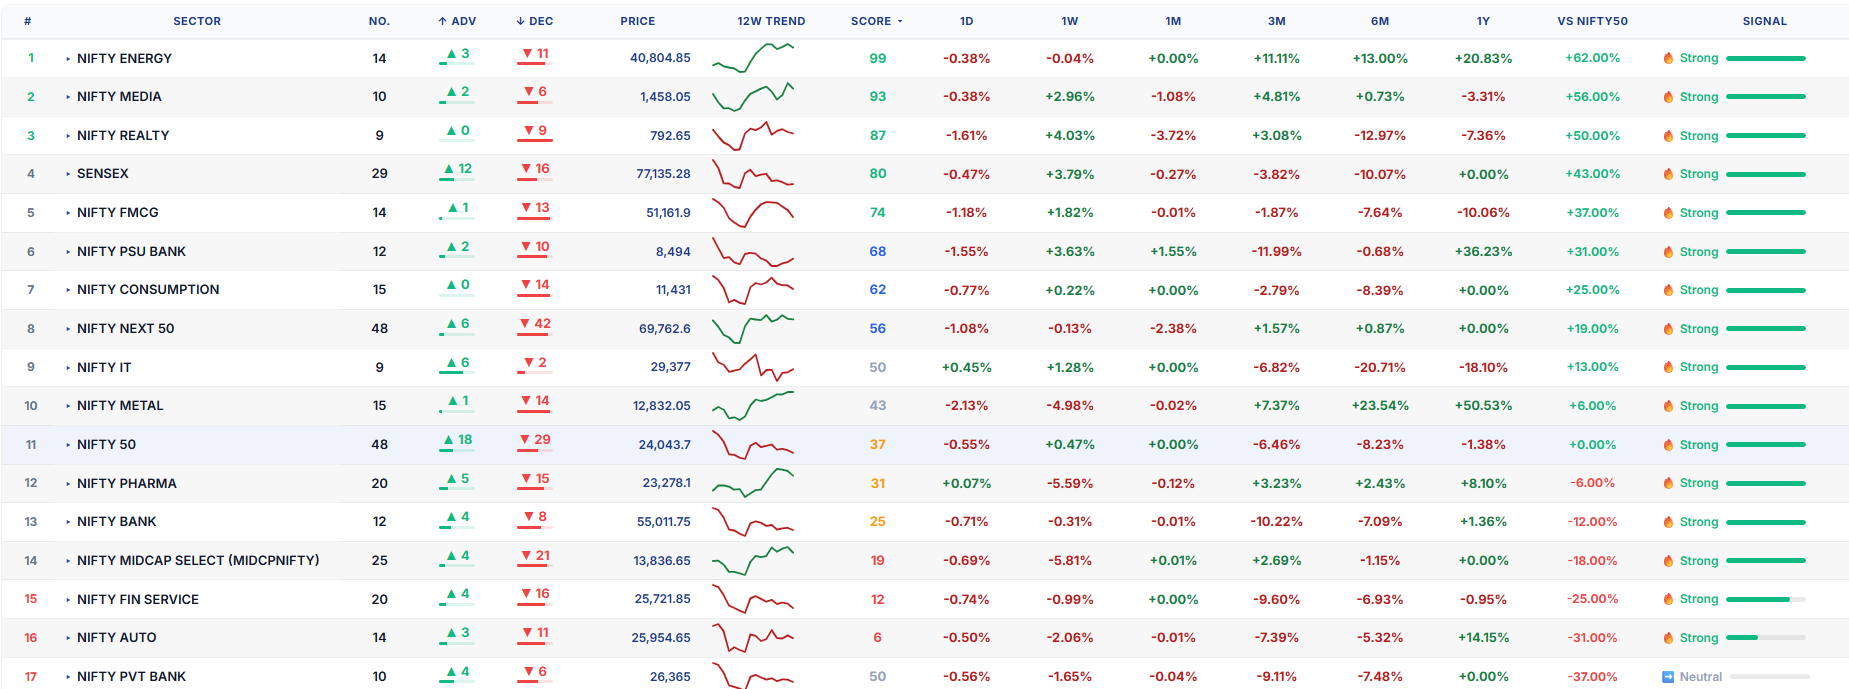
18 NSE sector indices, sparklines + rotation read.
Every industry ranked by composite breakout strength.
Count of stocks in each Weinstein stage today.
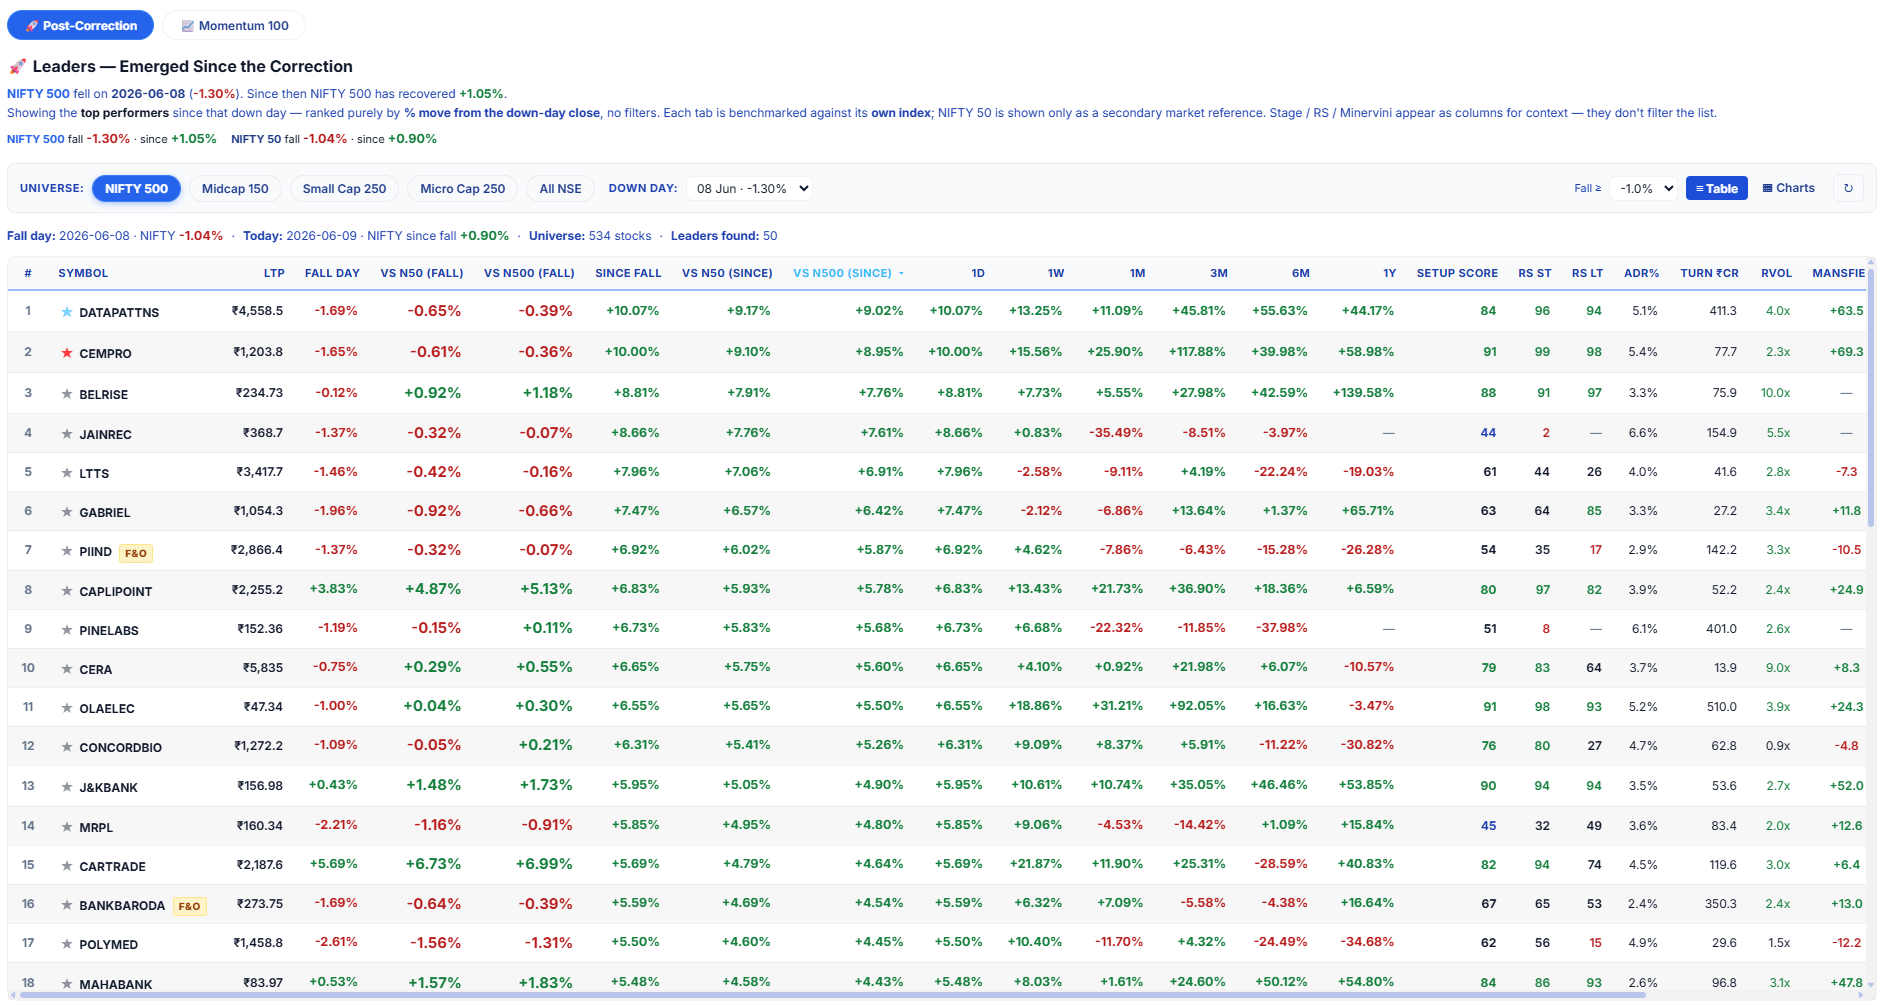
Held strong on the last down day; lead the next turn.
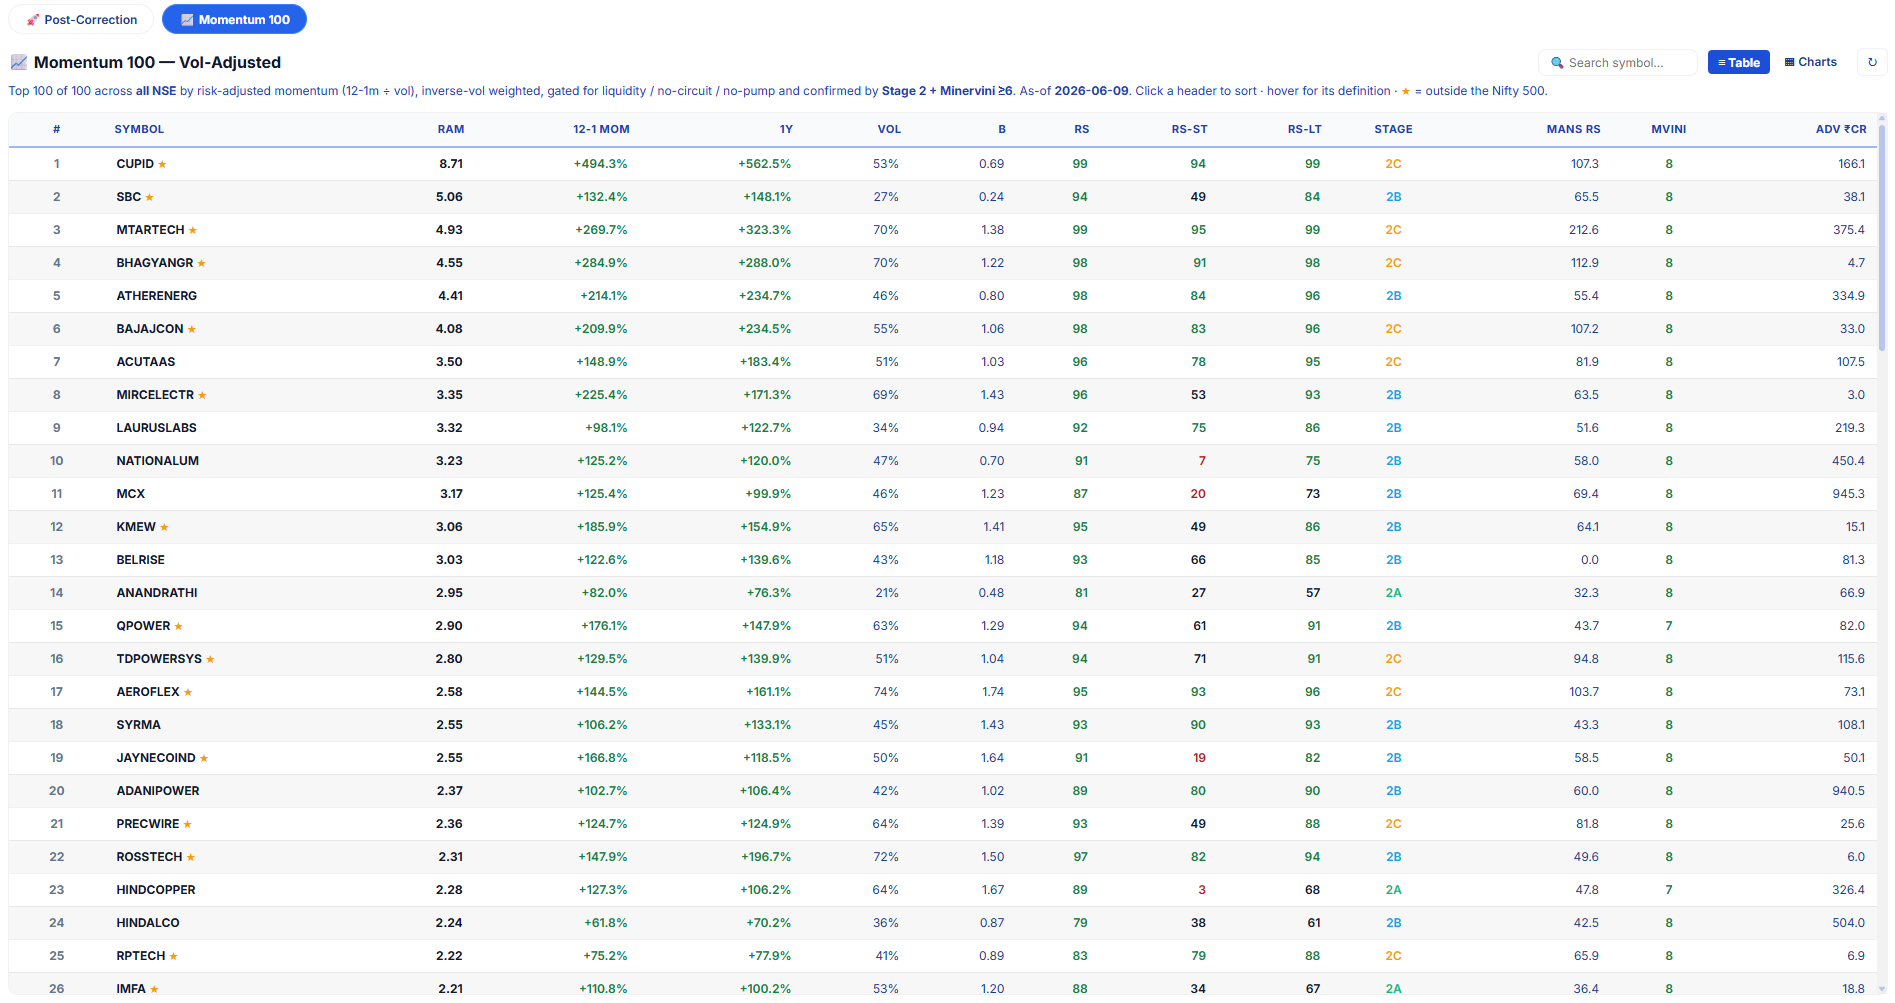
Vol-adjusted ranking of the strongest names, always-on.
Weinstein 1/2A-C/3/4 vs the 30-week MA.
Relative strength vs NIFTY 50, smoothed 52 weeks.
Minervini's strict 8-criterion Stage-2 score.
Surveillance flag auto-excluded from every preset.
Full TV toolset + custom Pocket-Pivot indicator.
~30 fields, plain-text AND/OR filtering, live count.
Six colours + named lists, export to TradingView.
Monthly seasonality grid + NSE earnings calendar.
Every plan includes the full scanner — all 23 setups, market breadth, sector strength & charts.
Prices exclude 18% GST. Need more than one app? The all-apps Combo bundles Options, Stocks, Trade & Footprint from ₹1,499/mo. See all plans →
Both. One click flips the universe between All Stocks (the full ~2,300-name NSE scan universe) and F&O (the ~200 most-liquid futures & options names). Every scan, breadth panel and industry view respects the toggle, so you can hunt early-stage breakouts in the wider market or stick to liquid F&O names you can size and hedge.
23 pattern setups spanning breakout (ATH / 52W / Swing-High / Flat-Base / Momentum), continuation (Bull Flag, High-Tight Flag, VCP, EMA Coil, Pullback-to-DMA), reversal (Double Bottom / Top) and volume (Pocket Pivot, HVE / HVY / HVQ, Volume Climax). You don't need all of them — most traders settle on three to five favourites and ignore the rest via the setup-chip bar.
No. The Market Pulse Scanner is a screening & research tool — it doesn't place orders, so no broker connection is required. Scan, study the chart, bookmark candidates, then trade them in your own broker (or pair it with the FNOTrader Trade / Options apps). Your 7-day free trial unlocks everything with nothing to link.
Both — and positional too. The same engine runs on three timeframes: Daily for 3–15 day swings, Weekly for 1–3 month positional holds, and Monthly for multi-year base detection. There are also live intraday breadth and scan views. Switch personas in one click; the patterns are the same, the bar interval changes.
Yes — 7 days of full access, no credit card required. Create an account and your first login activates the trial automatically across the whole scanner.
No. FNOTrader is a technology product, not a SEBI-registered investment adviser or research analyst. The scans, setups, breadth panels and reports are decision-support data for informational and educational use only — not a recommendation to buy or sell. Please consult a SEBI-registered adviser before acting, and trade at your own discretion.
Start your 7-day free trial — the full scanner, no credit card.
Create your free account →