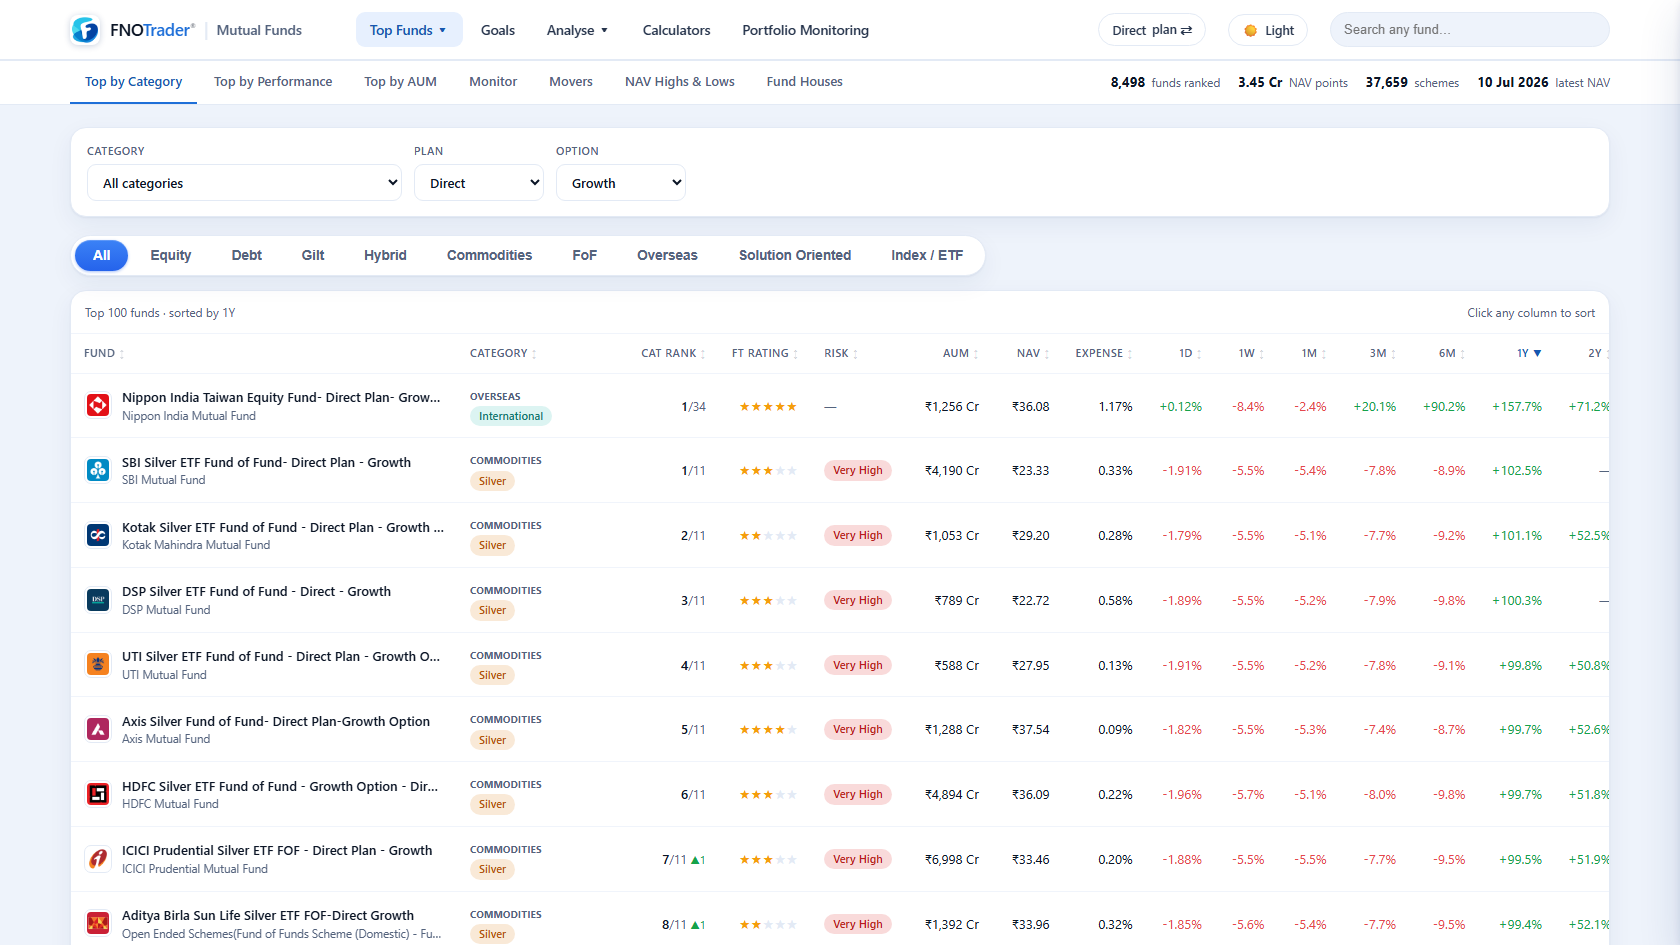
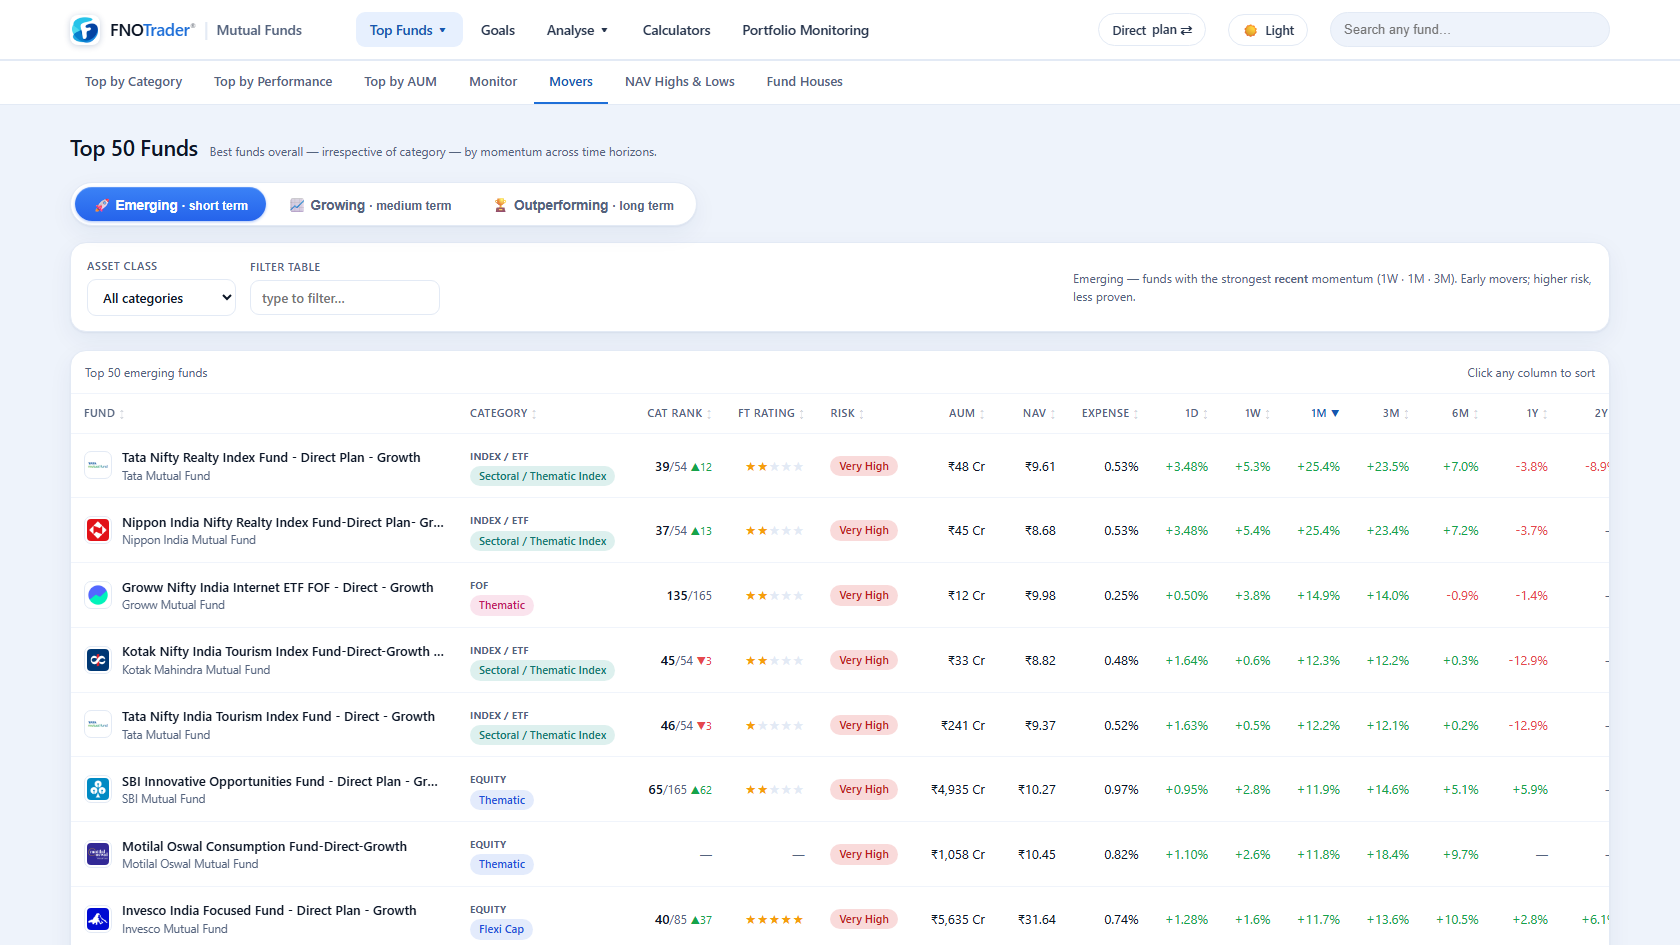
● Live · 8,500+ Mutual Funds

Every mutual fund, ranked. Pick better with data.

Rank 8,500+ live funds by category, rating, risk and returns from 1 day to 10 years — Direct or Regular. See where your funds sit in their category, how much they overlap, and what the category leaders would have earned instead.

🎁 Full access for 30 days · No credit card required · Daily NAV · Direct & Regular

8,500+ funds rankedReturns 1D → 10YPortfolio InsightsHoldings overlap
Fund ScreenerFund Screener · 8,600+ funds
Fund Health ScoreHealth Score · Grade A+
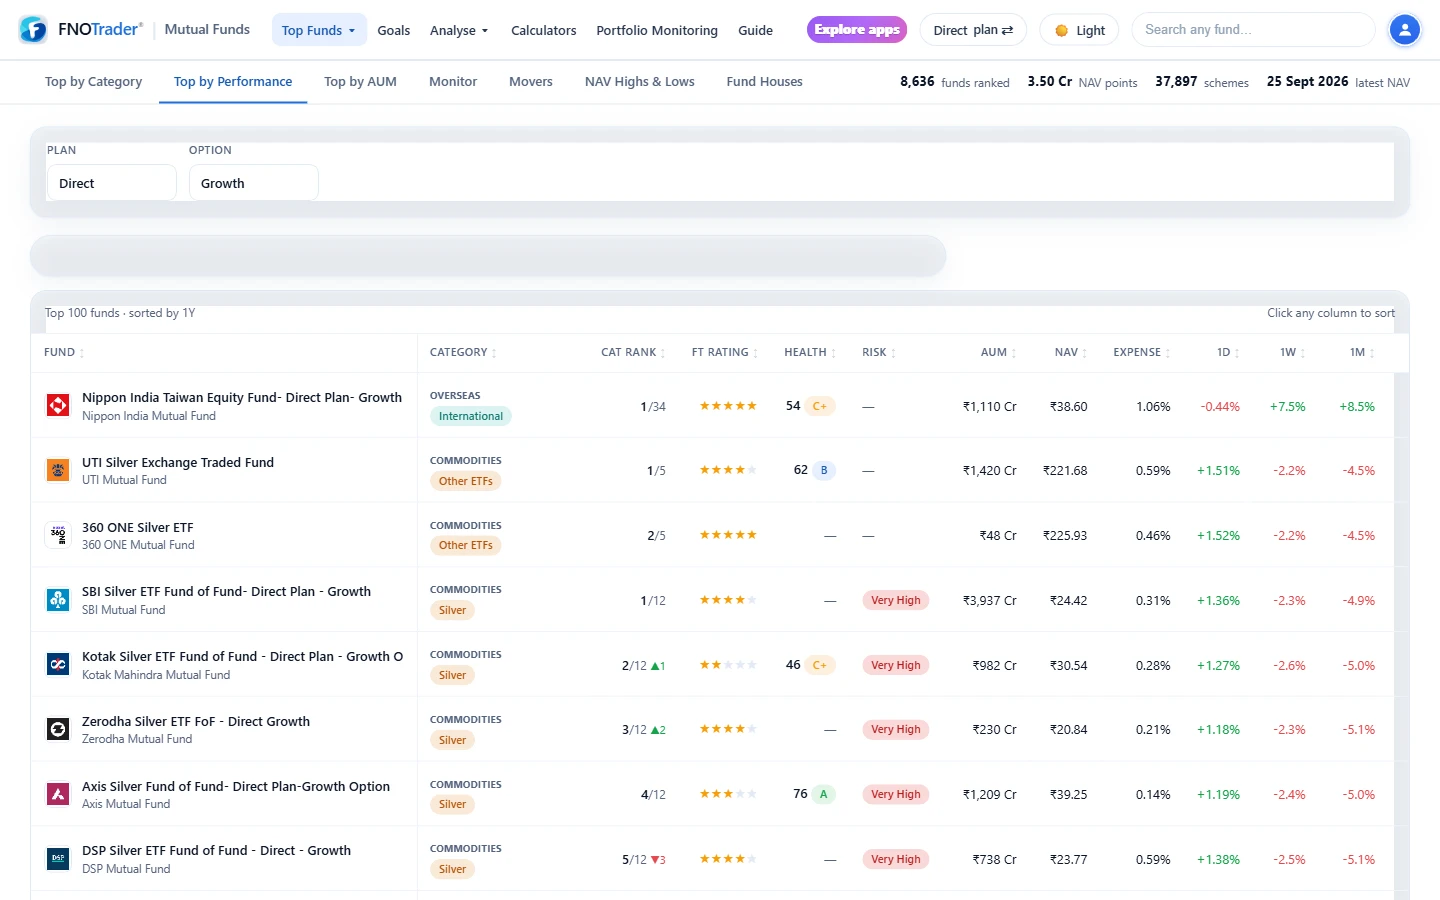
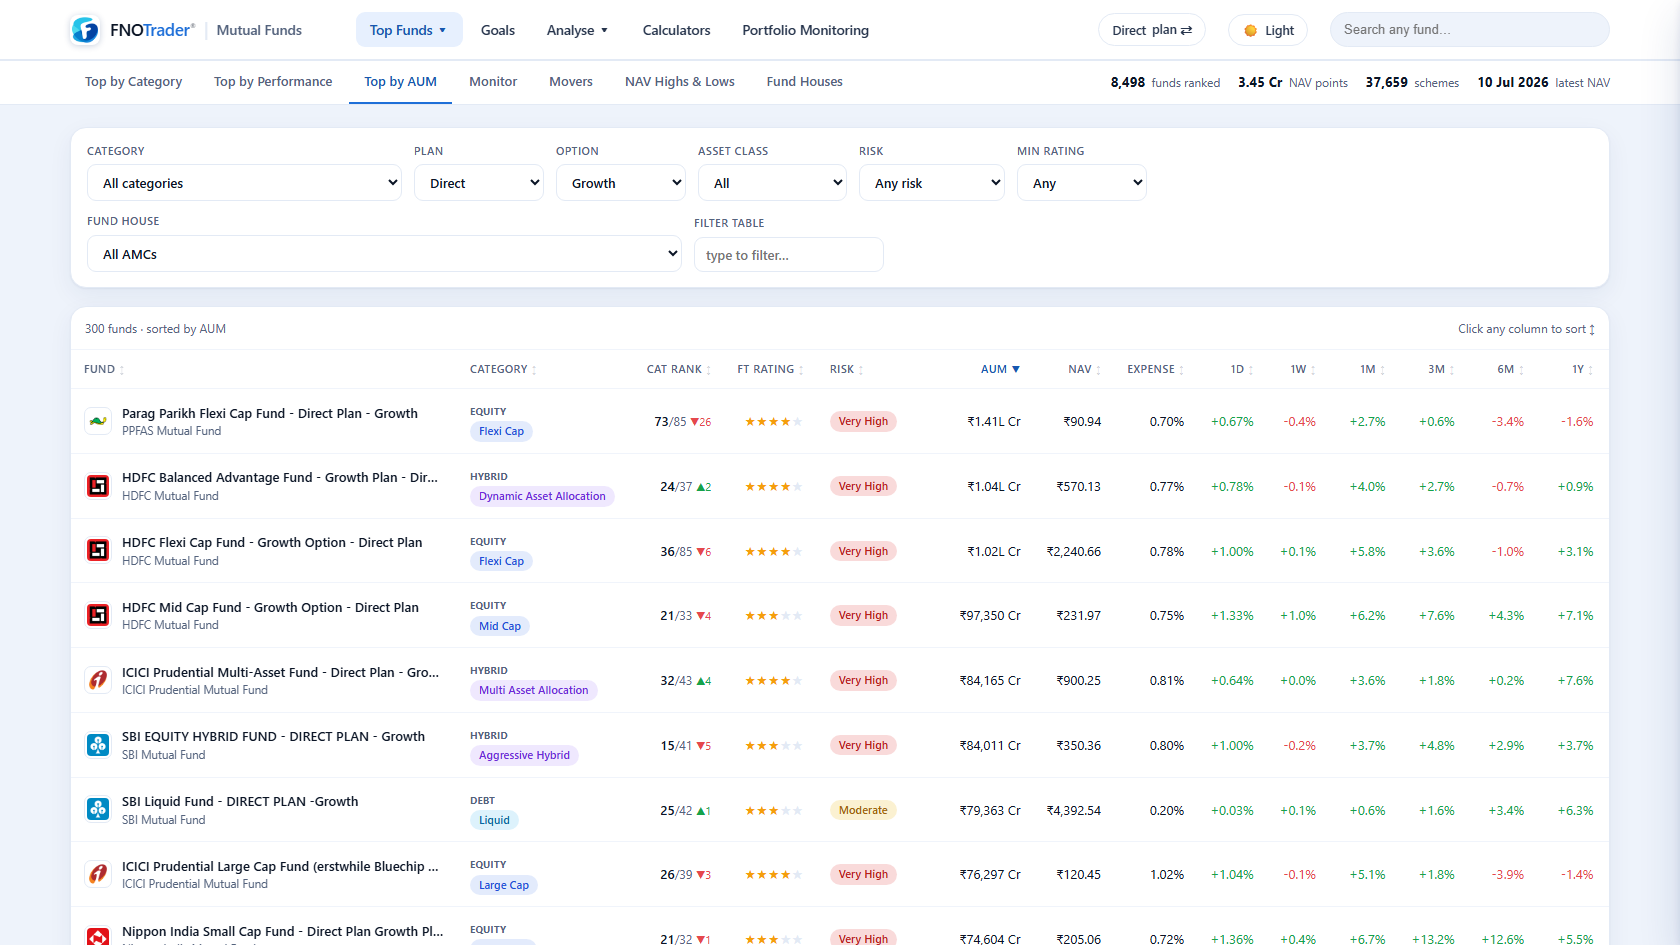
Mutual Funds: top funds by performance with category rank, rating, AUM, NAV and returns

Integrates with all leading brokers (100+)

Zerodha
Upstox
Fyers
Angel One
Dhan
ICICI Direct
5paisa
Aliceblue
FlatTrade
Shoonya
Kotak Neo
Groww
Firstock
IIFL
Zebu
Arrow
Sharekhan
Paytm Money
Motilal Oswal
m.Stock
Samco
INDmoney
Definedge
Tradejini
TradeSmart
Nubra
Pocketful
Choice
Open XTS

Direct API with Zerodha, Upstox, Fyers, Angel One, Dhan, ICICI Direct, 5paisa, Aliceblue, FlatTrade, Shoonya, Kotak Neo, Groww, Sharekhan & more — plus 100+ brokers via Open XTS. See all supported brokers →

The problem

Picking a fund by last year's return is how you end up with a laggard.

Star-rating apps push whatever ran recently, hide the Direct plan, and never tell you your three funds hold the same 30 stocks.

✕

You chase last year's winner

A #1 fund on 1-year return is often a mean-reversion trap. Without seeing rank across 3Y/5Y and vs the category median, you buy the top of a hot streak.

✕

Your funds secretly overlap

Three "diversified" flexi-caps can share 60% of their holdings — you're paying three fees for one bet, and you'd never know without a holdings-overlap read.

✕

You leave the Direct plan on the table

Regular plans quietly cost ~1% a year in commissions. Over a decade that's a fifth of your corpus — most tools default you to Regular anyway.

8,500+Live funds ranked
12Goal-based baskets
40+Fund houses
DailyNAV refresh
Built for fund investors

Data, not star ratings.

Six tools that turn 8,500 funds into a shortlist you can actually defend — and keep your existing portfolio honest.

01 · The Screener

Rank every fund the way a pro would.

One table for the whole market — sort by any window, filter by category, risk, rating or fund house, and flip Direct ↔ Regular in one click.

  • Returns for 1D · 1W · 1M · 3M · 6M · 1Y · 2Y · 3Y · 5Y · 10Y, plus alpha vs the right benchmark
  • Category rank, FT rating, risk grade, AUM, expense & NAV — one uniform row
  • By Category · By Performance · By AUM · Fund Houses — every view, same columns
mf.fnotrader.com · The Screener⤢ full screen
Rank every fund the way a pro would.
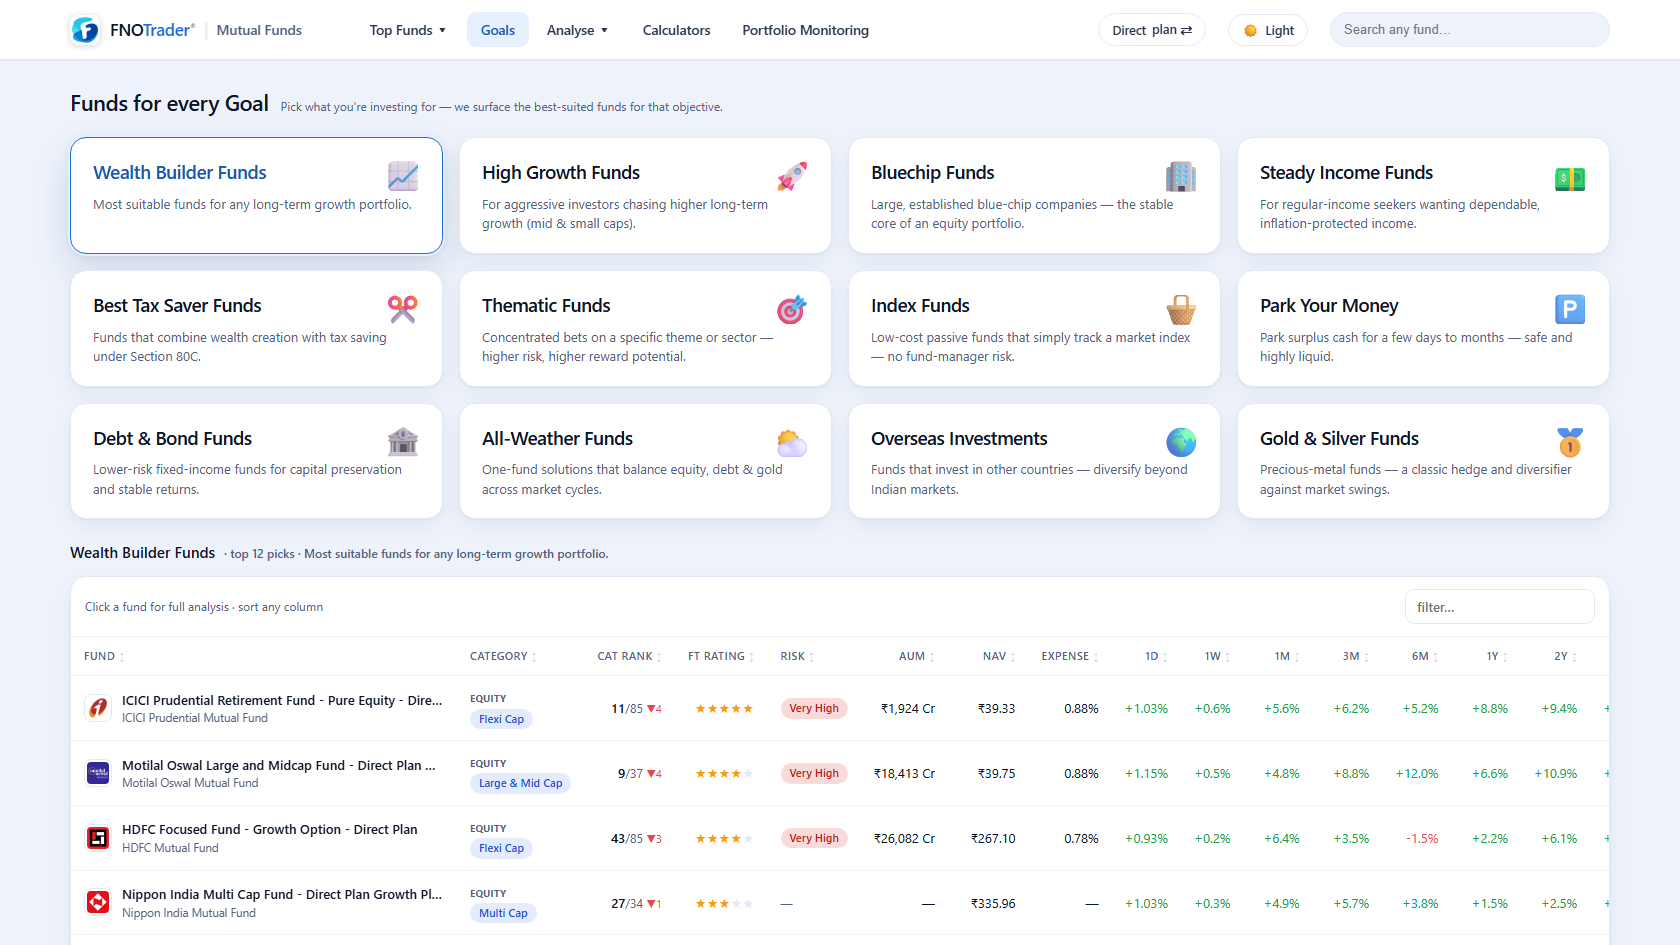
02 · Funds for every Goal

Start from the goal, not the fund name.

You don't want "a fund" — you want wealth creation, tax saving, or a place to park cash. We map each goal to the best-suited funds.

  • 12 baskets — Wealth Builder, High Growth, Bluechip, Thematic, Index, Tax Saver, Steady Income, Debt, All-Weather, Overseas, Gold & Silver, Park Money
  • Each basket ranks its funds by the metric that matters for that goal
  • One row per fund — no duplicate plan/option clutter
mf.fnotrader.com · Funds for every Goal⤢ full screen
Start from the goal, not the fund name.
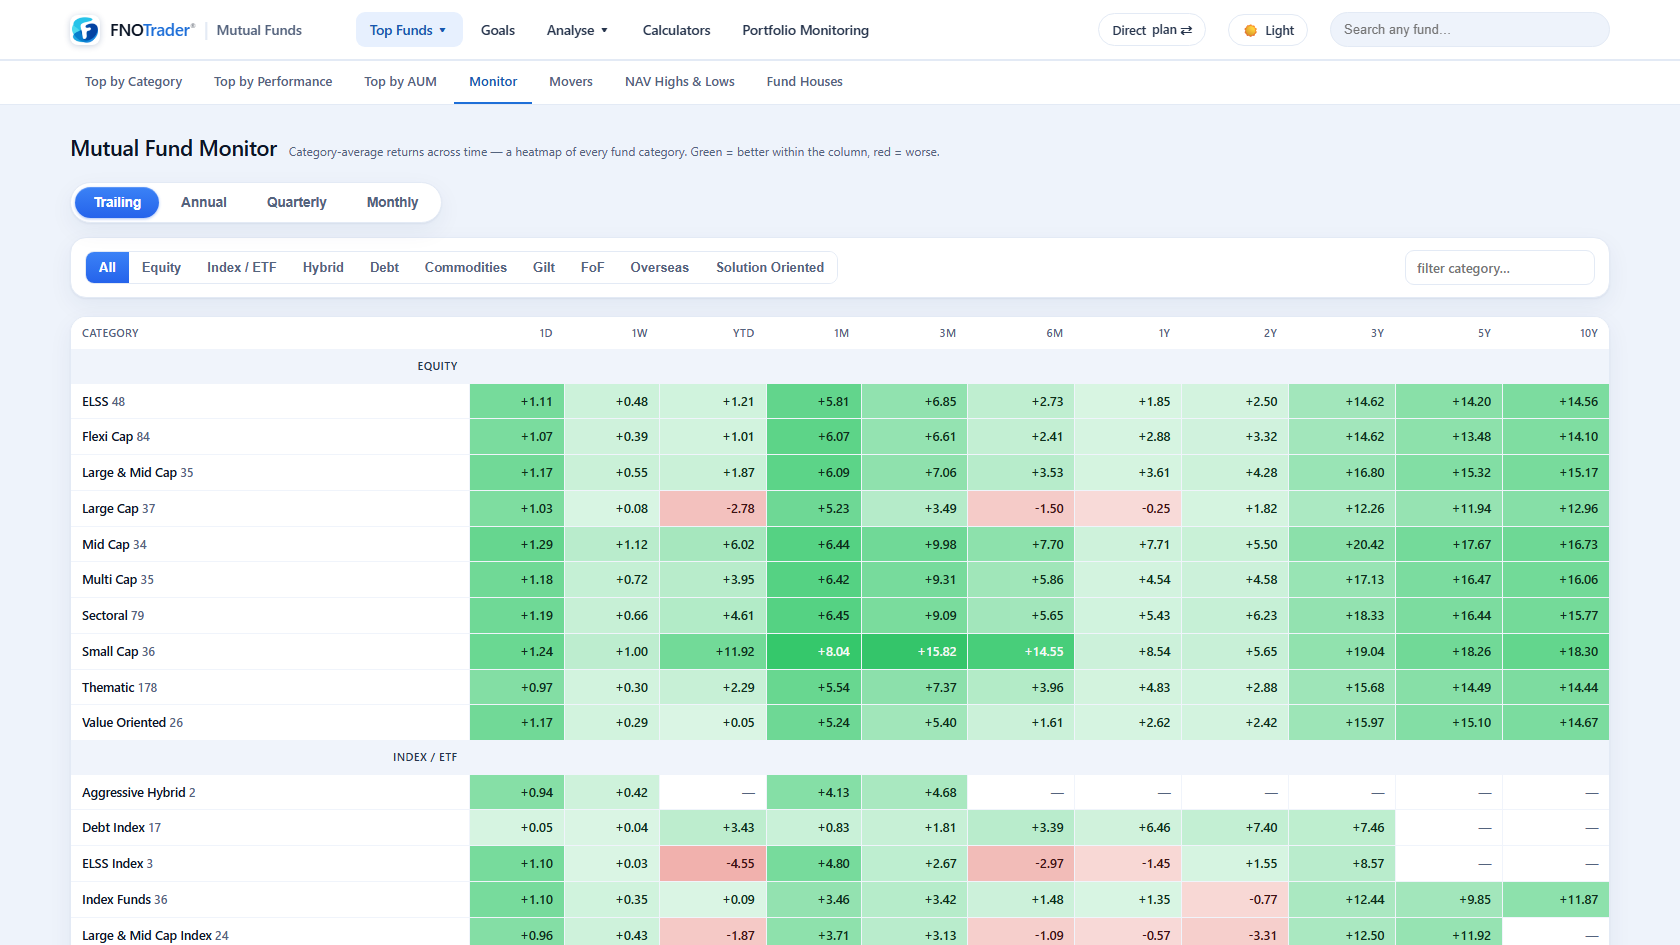
03 · Fund Monitor

See which category is working — at a glance.

Returns tables are noise. A heatmap of category-average returns across time shows you where the money is flowing, instantly.

  • Category-average returns as a green→red heatmap — Trailing, Annual, Quarterly & Monthly
  • Grouped by asset class — Equity, Index/ETF, Hybrid, Debt, Commodities, Gilt…
  • Live funds only — no dead side-pocket schemes skewing the averages
mf.fnotrader.com · Fund Monitor⤢ full screen
See which category is working — at a glance.
04 · Compare & Overlap

Two funds, side by side — and how much they share.

Choosing between funds means comparing growth, risk, ratios — and knowing whether they're really two bets or one in disguise.

  • Overlaid growth chart (TradingView Lightweight) + a full metric-by-metric table
  • Add benchmark indices — Nifty 50, 500, Midcap 150, Smallcap 250 & more
  • Holdings overlap — the exact % of portfolio two funds hold in common
mf.fnotrader.com · Compare & Overlap⤢ full screen
Two funds, side by side — and how much they share.
05 · Portfolio Insights

What your funds are really doing — and what you're missing.

Upload your holdings (CAS PDF, Excel or manual) and get more than a value total: the honest read most portfolio trackers won't give you.

  • Overlap between every pair of funds — redundancy flagged in red
  • Each fund's category rank — leader, above-median or laggard
  • Opportunity — "if you'd held each category's best fund, you'd have ₹X more"
mf.fnotrader.com · Portfolio Insights⤢ full screen
What your funds are really doing — and what you're missing.
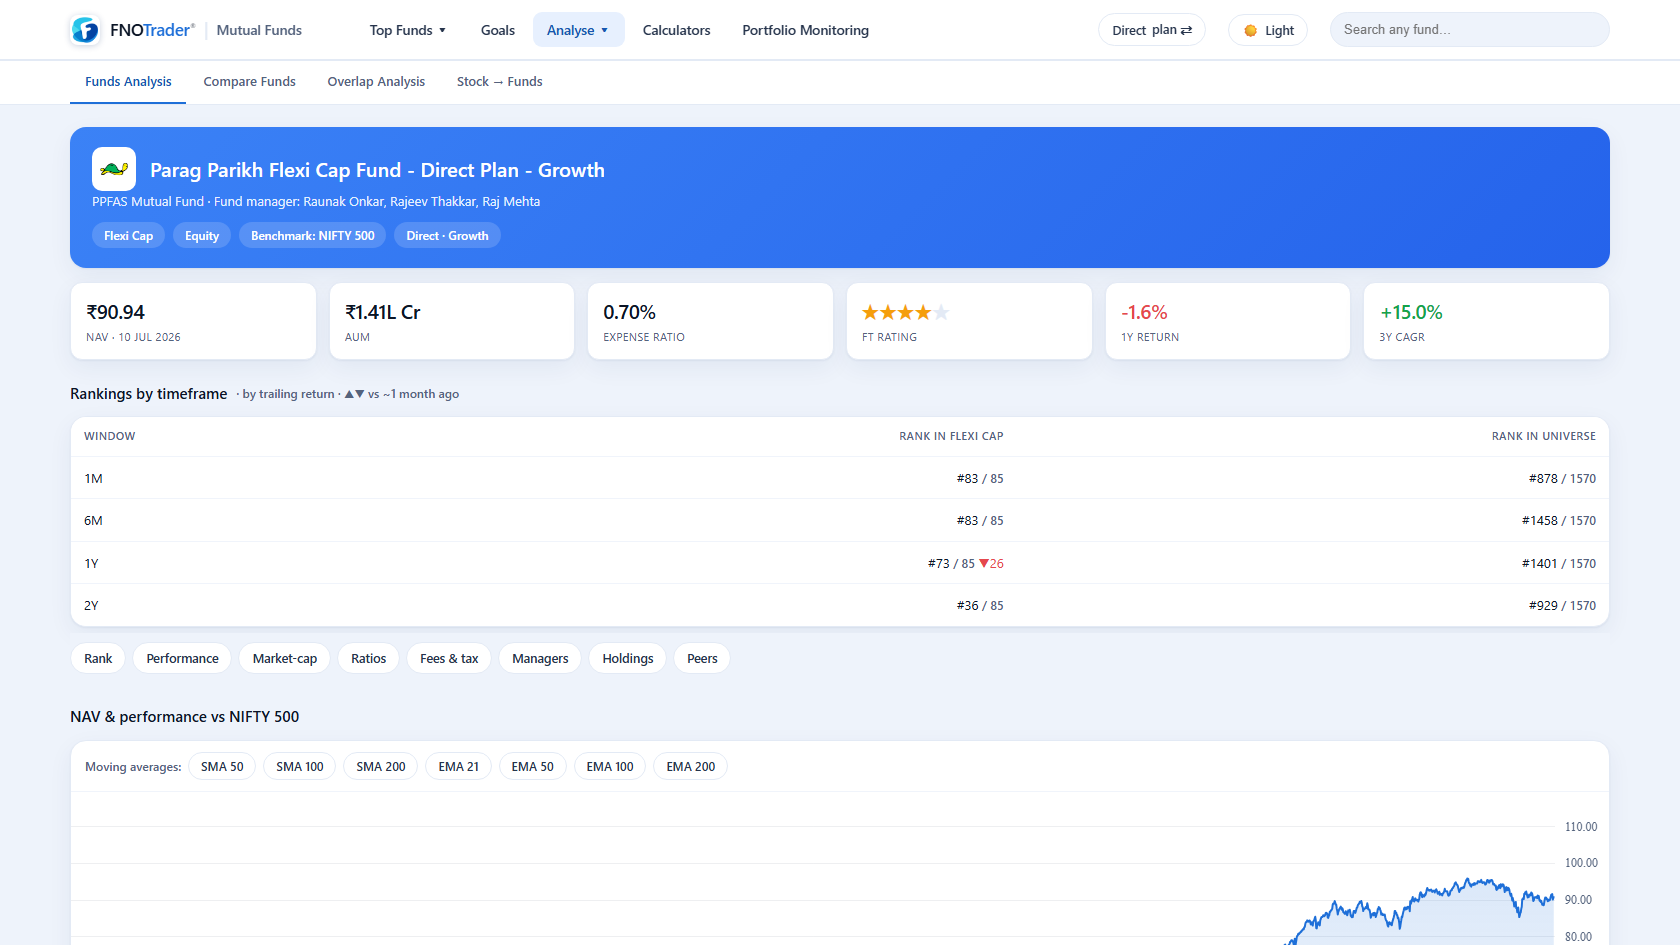
06 · Deep fund analysis

Everything about one fund, on one page.

Before you commit, you want the full picture — NAV history, rolling returns vs benchmark, holdings, manager and peers.

  • Sharp NAV chart, rank in universe & category, timeframe breakdown
  • Holdings, manager's other funds, and same-category peers with overlap
  • Stock → Funds — which mutual funds hold any given stock, and how much
mf.fnotrader.com · Deep fund analysis⤢ full screen
Everything about one fund, on one page.

The whole desk — screen, compare, monitor & audit.

A real research desk for Indian mutual funds — not a star-rating list bolted onto a distributor app.

🏆
Top FundsBy Category · Performance · AUM — one uniform ranked table.
🎯
Funds for every Goal12 goal baskets, each with its best-suited funds ranked.
🔥
MoversEmerging, growing & outperforming funds, refreshed daily.
📈
NAV Highs & LowsAll-time / 52-week highs & lows, distance from ATH.
🏦
Fund HousesBrowse every AMC — funds, AUM & ratings in one place.
🔁
Direct ↔ RegularApp-wide toggle — ranks & ratings per plan.
⭐
FT Rating & RiskOur performance rating + risk grade on every fund.
⏱️
10 return windows1D · 1W · 1M · 3M · 6M · 1Y · 2Y · 3Y · 5Y · 10Y.
🗺️
Fund MonitorCategory-returns heatmap — Trailing / Annual / Quarterly / Monthly.
⚖️
Compare FundsUp to 4 funds — overlaid growth, risk, ratios & ratings.
🧬
Overlap AnalysisExact % of holdings any two funds share.
📊
Benchmark alphaEvery fund vs the right index — Nifty 50/500/Midcap/Smallcap.
🥧
Category medianSee how a fund stacks vs the median & leader in its group.
🖥️
Lightweight chartsSharp, fast TradingView charts across the app.
📂
Portfolio MonitoringUnits, invested, current value & P&L per fund.
📄
CAS / Excel importUpload a CAMS/KFintech CAS or a spreadsheet — parsed locally.
✨
Portfolio InsightsOverlap, category rank & the opportunity vs leaders.
🏅
Rank in categoryLeader / above-median / laggard on every holding.
💡
Opportunity estimateWhat each category's best fund would have earned you.
🔎
Stock → FundsWhich funds hold a given stock, and how much.
🧮
SIP & goal calculatorsProject growth and plan contributions.
🔗
Stocks-app bridgeMutual-fund ownership shown right inside a stock's page.

Every feature, from the help guide

Each card below is a documented capability of the app, with the screen it lives on.

Everything in Mutual Funds · 14 features
Fund Screener
35+ filters across 8,600+ ranked schemes — Sortino, down-capture, expense, sector tilt
Fund Health Score
0–100 composite scored against category peers across 6 weighted dimensions
Rolling Returns
3y rolling CAGR across every start date — e.g. 14.9%–22.6% spread, not one number
Category Rank Tracker
Live rank inside its SEBI category, with a ▲/▼ showing the 1-month move
Funds By Goal
9 goals — Wealth Building to Tax Saving — pre-mapped to SEBI categories & ranked
Category Heatmap
Trailing, annual, quarterly & monthly returns across every SEBI sub-category
Compare Funds
Up to 4 schemes plus a benchmark index on one rebased 5-year growth chart
Overlap Analysis
Shared-stock overlap between funds — see when two schemes are 60%+ duplicate
Look-Through Valuation
Portfolio P/E, P/B & ROE from actual holdings, not the fund's category label
Holding Changes
Month-over-month buy/sell by every fund, down to shares and % of company
Portfolio Insights
True single-stock exposure across every fund you hold, from one CAS upload
SIP & Lumpsum Planner
Solve for the SIP or lump sum that reaches a target — illustrative, not a forecast
Stock → Fund Lookup
Find every fund holding a stock, plus a one-click TradingView watchlist export
Advanced Risk Ratios
Sharpe, Sortino, capture ratios & alpha — the deep metrics factsheets skip
Simple pricing

Start free for 30 days. One price after.

Every plan includes the full app — screener, goals, monitor, compare, overlap & Portfolio Insights. Prices exclude 18% GST.

What each plan includes

Free TrialFull access · no card
  • The complete app for 30 days
  • All screens, goals & insights
  • No credit card required
Monthly+ 18% GST · cancel anytime
  • Everything in the app
  • Daily NAV & all updates
  • Month-to-month, no lock-in
Yearly Best value
  • Everything in the app, all year
  • Daily NAV & all updates
  • Included in the all-apps Combo

Prices exclude 18% GST. Already subscribe to another FNOTrader app? Mutual Funds is included in the all-apps Combo — and existing active plans get it free until your current subscription renews. See all plans →

7-day trial of every appNo card to startCancel anytimeGST invoice on every payment

Compare every plan on the full pricing page →

Questions

Everything else you might ask.

How many funds does it cover?

Every currently-live Indian mutual fund — 8,500+ schemes across 40+ AMCs, refreshed with the latest NAV daily. Dead and matured schemes (side-pockets, closed FMPs) are excluded so ranks and category averages reflect funds you can actually buy today.

Does it show Direct or Regular plans?

Both — with an app-wide toggle. A fund is one fund; the plan is just how you buy it (Direct vs Regular, Growth vs IDCW). Search and screens collapse the variants to a single row and rank per your selected plan, so you always compare like for like — and can see exactly what the Direct plan saves you.

Can I analyse my existing portfolio?

Yes. Upload a CAMS/KFintech CAS PDF, a spreadsheet, or add funds manually. Beyond value and P&L, Portfolio Insights shows how much your funds overlap, where each ranks in its category, and an estimate of what the category leaders would have earned on the same money — the honest read most trackers skip. Parsing happens on our servers; nothing is shared with third parties.

Do I need a broker or demat account?

No. This is a research & analytics tool — it doesn't transact or place orders, so nothing to link. Screen and compare funds here, then invest through whichever platform you already use.

Is there a free trial, and do I need a card?

Yes — 30 days of full access with no credit card. After that it's ₹2,999/year (+18% GST). It's also bundled into the FNOTrader all-apps Combo, and existing active-plan subscribers get Mutual Funds free until their current plan renews.

Is this investment advice?

No. FNOTrader is a technology product, not a SEBI-registered investment adviser or research analyst. The rankings, ratings, comparisons and portfolio insights are decision-support data for informational and educational use only — not a recommendation to buy, sell or hold any fund. Mutual fund investments are subject to market risks; read all scheme-related documents carefully and consult a SEBI-registered adviser before investing.

All Mutual Funds questions →

Stop guessing. Rank every fund with data.

Start your 30-day free trial — the whole app, no credit card.

Create your free account →

Already have an account? Log in