Live · NSE NFO · Order flow

Read institutional footprint on every candle.

Footprint cells with bid vs ask volume, cumulative delta, market & volume profile and live imbalance detection — the same order-flow toolkit institutional desks use, on every NIFTY, BANKNIFTY & FNO future.

🎁 Full access for 7 days · No credit card required · Data-only — no broker needed
Direct WS · sub-second ticks Bid×Ask on every print Market & Volume Profile NIFTY · BANKNIFTY · FNO
fp.fnotrader.com
Bid×Ask
Volume per candle
Live
Cumulative delta (CVD)
TPO
Market & volume profile
FNO
NIFTY · BANKNIFTY · futures
The problem

A standard candle hides who's actually trading.

OHLC tells you where price went — not whether buyers absorbed sellers, where the volume stacked, or who got trapped.

Same candle, different story

A green bar can be aggressive buying or sellers being absorbed. Without bid vs ask volume per price you're guessing at the one thing that matters.

You can't see where price agreed

Value area, point of control, single prints — the structure pros trade around is invisible on a line or candle chart. You react late to levels that were obvious on a profile.

Delayed, resampled data lies

Snapshot feeds blur the tape. By the time a stop-run or a large lot shows up, the move is already gone — you needed it tick-by-tick.

Built for order flow

See inside every candle — and read the structure around it.

Five core tools that turn raw tick data into a read on who's in control: footprint cells, cumulative delta, imbalance signals, market profile and volume profile.

01 · Footprint cells

Bid vs ask volume on every print.

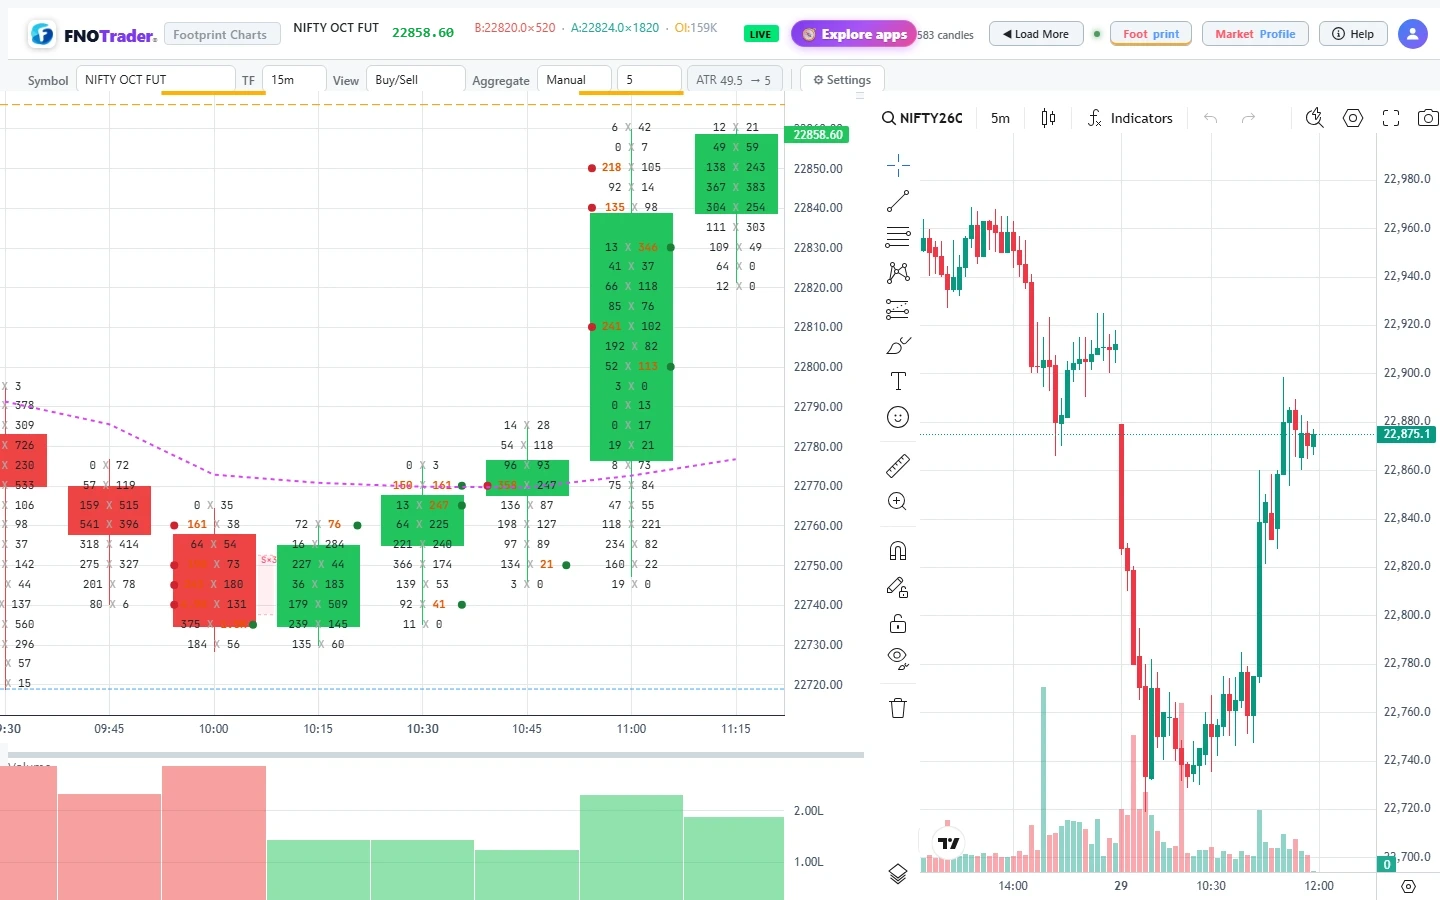
Standard candles hide who's actually trading. Footprint cells split each bar into price levels and show buy / sell volume side-by-side — absorption, exhaustion and stop runs visible as they form.

  • Per-level bid vs ask volume + delta inside every candle
  • Imbalance highlights at 3:1 / 5:1 / custom thresholds
  • POC line tracks the heaviest-traded price live
Footprint · NIFTY FUT · bar anatomy
BID · sellASK · buy
184224,330
55186
41312
398445
88201
9367
28931
Bar Δ  +1,118
◆ POC heaviest-traded tick
✦ buy imbalance
Ask 312 ≥ 2× Bid 55 (diagonal)
✦ sell imbalance
Bid 289 ≥ 2× Ask 67 (diagonal)
02 · Cumulative delta (CVD)

Track institutional positioning live.

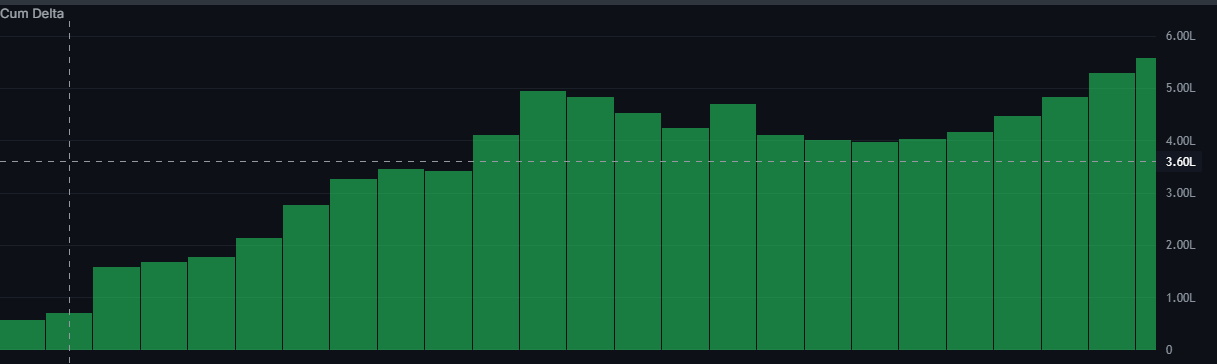
CVD sums net buying minus selling across the session. Divergence between price and CVD calls out distribution or accumulation hours before the index turns.

  • Live cumulative delta across NIFTY, BANKNIFTY & all FNO futures
  • Price ÷ CVD divergence — spot trapped buyers / sellers early
  • Per-day reset for a clean intraday read across sessions
Cumulative delta · NIFTY FUT
Cumulative Volume Delta (CVD) — running net of buyers minus sellers
03 · Imbalance & signals

The tape's tells, flagged automatically.

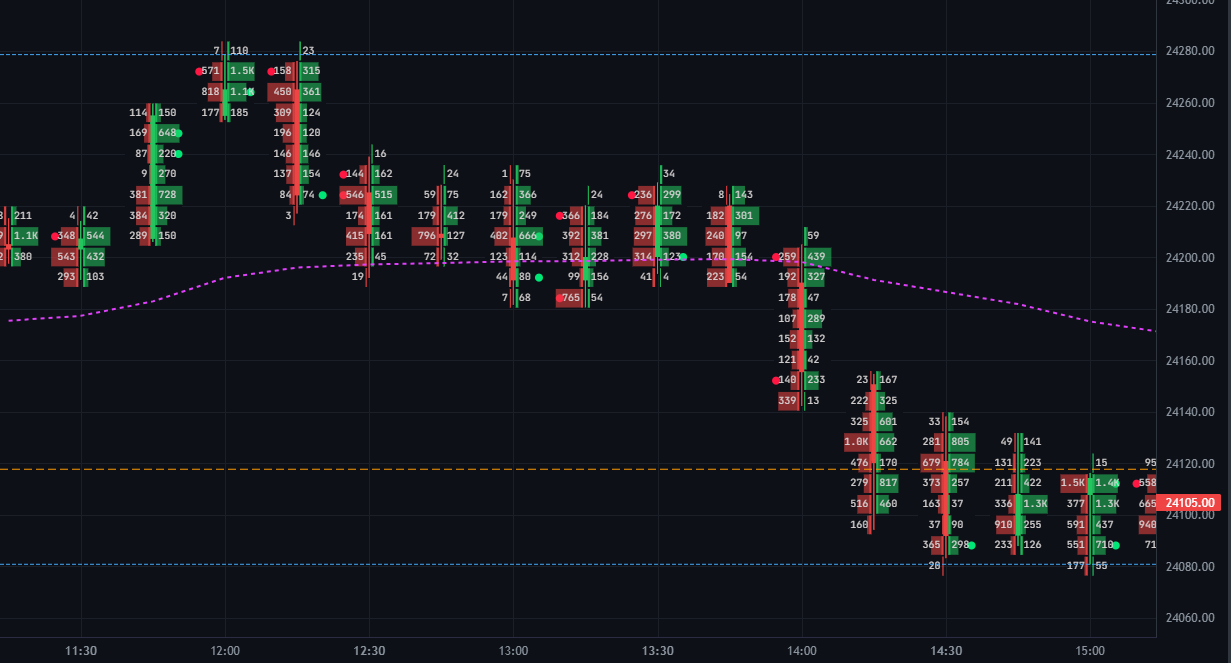
Reading imbalance by eye is slow and easy to miss. The chart marks diagonal buy/sell imbalances, stacked zones and the six classic footprint extreme patterns the moment they print.

  • Diagonal buy & sell imbalances at your chosen ratio
  • Stacked-imbalance zones flagged as support / resistance
  • 6 extreme-pattern signals + delta-divergence (▲DIV / ▼DIV) tags
Imbalance & signals · auto-flagged
⚡ Stacked imbalance · 3:1
2238
4761
24138
28844
26331
5249
3440
3 consecutive sell
imbalances
→ S/R zone
Stacked zone flagged as resistance — aggressive sellers controlling each tick.
Footprint signals
P-shape b-shape Absorption Exhaustion ▼DIV ▲DIV
04 · Market Profile / TPO

Find where price agreed to trade.

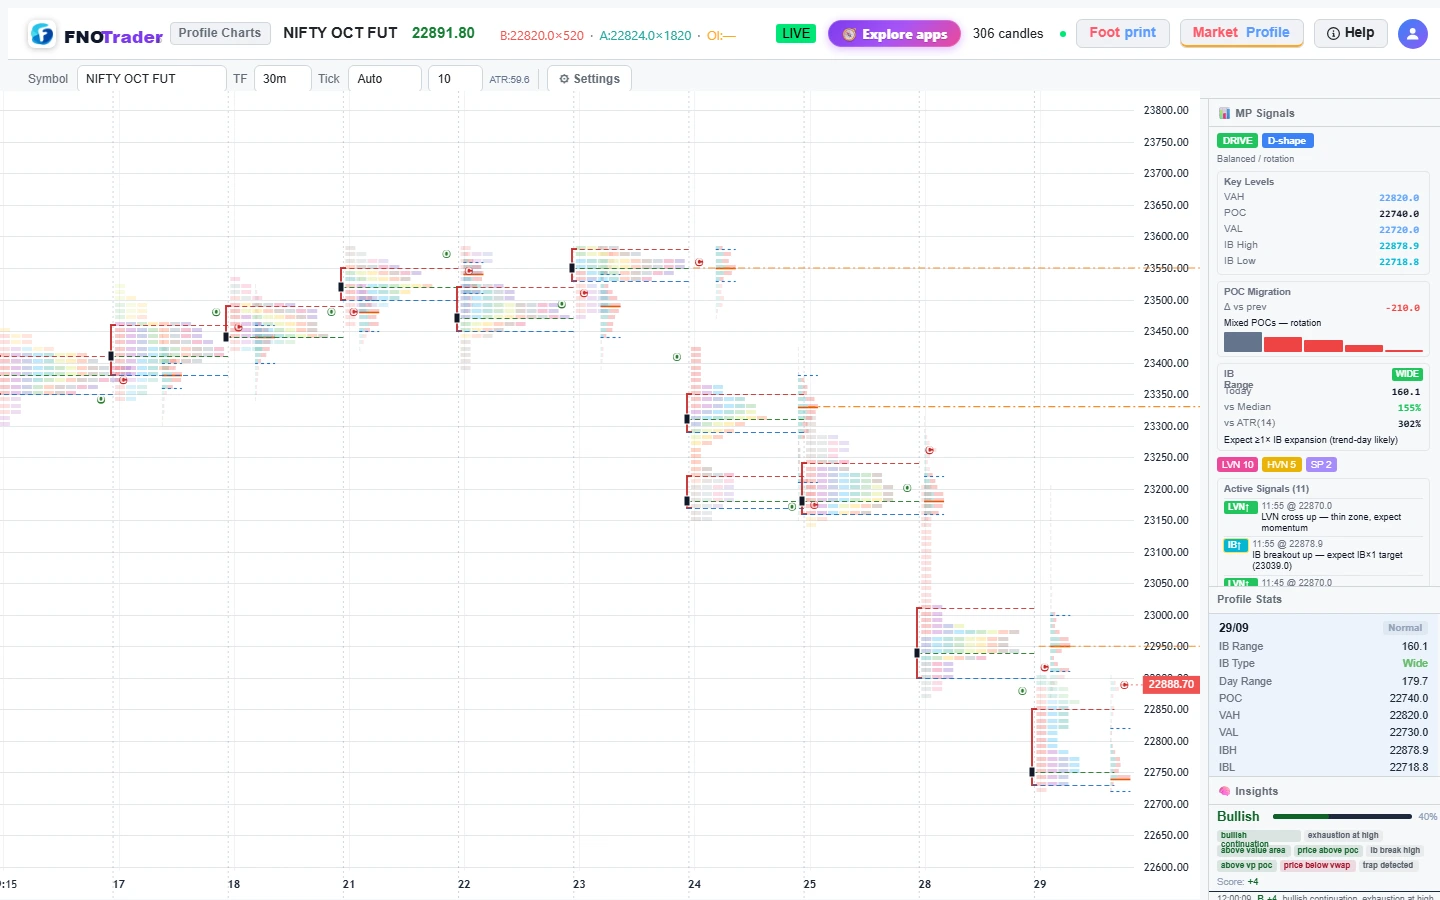
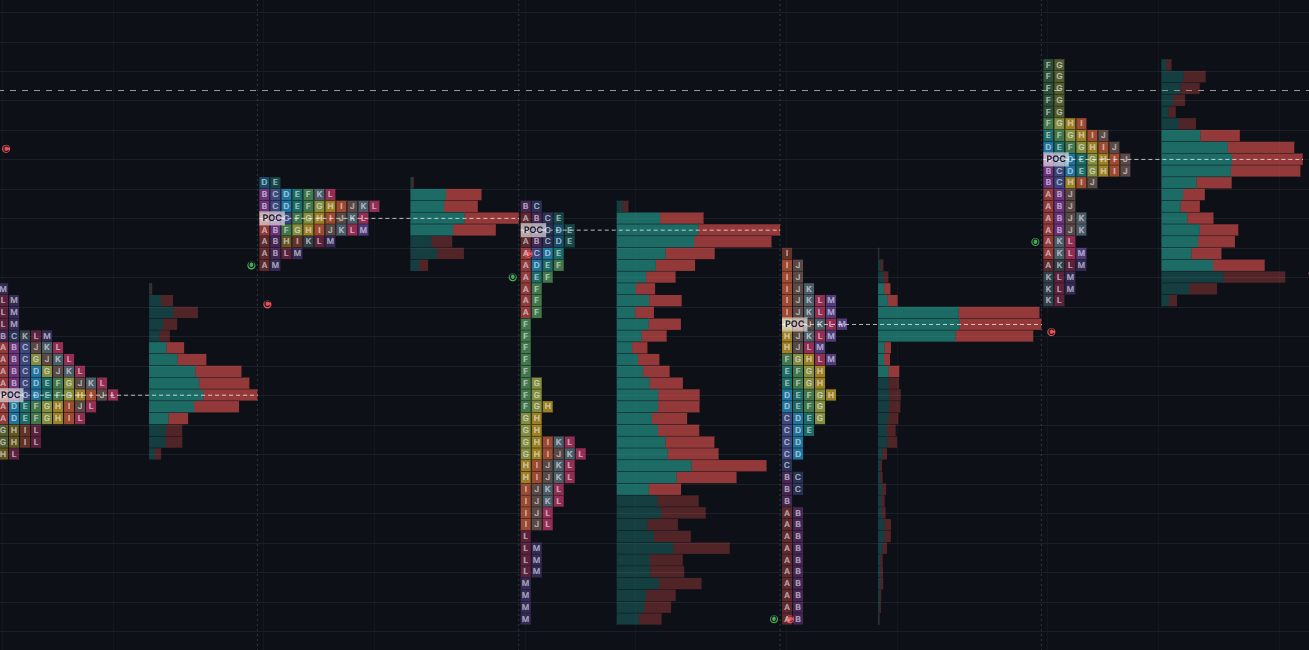
Value area, point of control and single prints — the structure professional locals trade around is invisible on a candle chart. Auto-built TPO draws it live as the day forms.

  • Composite + per-day TPO with letter/session lettering
  • VAH / VAL / POC levels drawn live, with single-print excess
  • Naked POCs from prior sessions flagged on the chart
Market Profile
Market Profile + Volume Profile — TPO letters with POC, value area and buy/sell volume
05 · Volume Profile

The horizontal shape of conviction.

Where the volume stacked is where price will fight to return. Volume Profile builds a per-price histogram so high-volume nodes and thin air-pockets jump off the chart.

  • Per-price volume histogram — high-volume nodes & low-volume gaps
  • Value area + POC by traded volume, not just time
  • Pair MP and VP together for accepted vs transacted price
Volume Profile · NIFTY FUT
Volume Profile — per-price volume histogram with POC, VAH and VAL
06 · Make it your chart

Every overlay is a toggle.

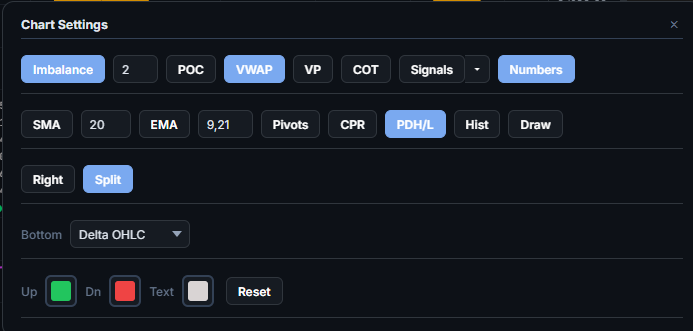
POC, VWAP, imbalance threshold, EMAs, CPR & pivots, PDH/L, the view mode and TPO-vs-volume — flip what you want on, hide the rest. Daily, weekly or composite profiles in a click.

  • Footprint view modes — Delta · DeltaBar · Bid/Ask · BarStats
  • Imbalance % threshold, EMAs, VWAP, CPR, pivots, PDH/L
  • Market Profile — TPO, Volume Profile, VAH/POC/VAL, daily/weekly/+5d
Settings
Footprint chart settings — imbalance, POC, VWAP, EMA, pivots, view modeMarket Profile settings — TPO, VP, POC, VAH/VAL, daily/weekly
Straight off the tape

Real ticks, real structure — read it like a local on the floor.

A direct WebSocket feed, OI context and a full Time & Sales tape sit beside every chart, so the signal and the proof are one glance apart.

Live tick feed

Every print, the moment it happens.

Direct WebSocket from the exchange — sub-second latency on every tick, every level. No delay, no resampling, no second-guessing what the tape did. Large institutional-size lots are flagged as they cross.

  • Tick-by-tick bid / ask trade aggregation into footprint cells
  • Time & Sales tape with large-lot highlighting
  • OI, buy-vol / sell-vol and bar delta read together in context
Time & Sales · live tape
🎞️ Time & Sales live · sub-second
TIMEPRICESIZESIDE
14:32:0724,316.575B
14:32:0724,316.0120S
14:32:0824,316.51,800B
14:32:0824,317.045B
14:32:0924,316.5210S
14:32:0924,317.088B
14:32:1024,316.02,450S
14:32:1024,316.560B
14:32:1124,316.0135S
14:32:1124,316.595B
14:32:1224,317.050B
14:32:1224,316.540S
Large institutional-size prints highlighted as they cross.
🧱

Absorption & exhaustion

Spot large limit orders soaking up market sells at support, or buyers drying up at resistance — the footprint shows it before price reacts.

🎯

COT High / Low

Commitment-of-traders high & low levels mark where aggressive size entered — natural fade and continuation references.

📐

VWAP & bands

Session VWAP with standard-deviation bands as a bias filter, layered over the footprint and profile.

🗂️

Multi-pane workspace

Stack NIFTY footprint, BANKNIFTY profile and sector futures — independent timeframes, one synced crosshair.

One subscription

The full order-flow desk — not a candle chart with a delta column.

Footprint, profile, cumulative delta, signals, the live tape and the structural levels pros trade around — all in one workspace.

Footprint & order flow
Footprint Cells

Per-level bid vs ask volume inside every candle.

📊
Bar Delta (Δ)

Net buy − sell volume per bar, colour-coded.

📈
Cumulative Delta

CVD across the session with per-day reset.

🟢
Buy / Sell Volume

Aggressive buying vs selling split per level.

⚖️
Imbalance

Diagonal 3:1 / 5:1 buy & sell imbalance flags.

🧱
Stacked Imbalances

Consecutive imbalances → support / resistance zones.

🚩
Footprint Signals

6 extreme patterns at candle highs & lows.

↔️
Delta Divergence

▲DIV / ▼DIV when price and delta disagree.

Profile & structure
🗺️
Market Profile (TPO)

Letter-based time-at-price, per-day & composite.

Volume Profile

Per-price volume histogram — HVN & LVN.

POC

Point of control — the heaviest-traded price.

📦
Value Area

VAH / VAL bounding the ~70% accepted range.

📍
Naked POC

Untested prior-session POCs flagged as magnets.

📏
Single Prints

Excess / rejection — thin one-letter zones.

🔷
Profile Shapes

P / b / D / balanced day-type recognition.

🎯
COT High / Low

Where aggressive size committed — fade levels.

Live data & workspace
📡
Live Tick Feed

Direct WebSocket, sub-second, no resampling.

🎞️
Time & Sales

Every print with large-lot highlighting.

🔵
Open Interest

OI read beside delta — covering vs real demand.

📐
VWAP & Bands

Session VWAP + std-dev bands as a bias filter.

🗂️
Multi-pane

Up to 4 synced panes, independent symbols.

🎚️
Tick / Timeframe

Custom tick-size & 1m → daily aggregation.

🌗
Themes & Layout

3-mode theme + saveable chart layouts.

📚
In-app Help

Full order-flow & profile docs built in.

Simple pricing

Start free. Upgrade only when the tape pays for it.

Every plan includes the full Footprint Charts app — footprint, profiles, CVD, signals & the live tape.

7-Day Pass
₹249/ 7 days
₹499
  • Full app for a day of access
  • Footprint, profiles & CVD
  • Live tick feed + Time & Sales
Try a 7-day pass
Most popular
Monthly
₹499/ mo
₹999
  • Everything in Footprint Charts
  • Market & Volume Profile + signals
  • Cancel anytime
Start free trial
Yearly
₹3,599/ yr
₹5,988 · save ~40%
  • Best value — 12 months
  • All updates included
  • Priority support
Go yearly

Prices exclude 18% GST. Need more than one app? The all-apps Combo bundles Options, Stocks, Trade & Footprint from ₹1,499/mo. See all plans →

Questions

Everything else you might ask.

Which instruments are covered?

NIFTY and BANKNIFTY plus FNO futures across NSE's NFO segment — index and stock futures — with footprint, market & volume profile and cumulative delta on each. Session-based indicators reset at 9:15 IST every day.

Do I need a broker account?

No. Footprint Charts is a data and analytics product — it reads live order flow off the exchange feed, it doesn't place orders. Your 7-day free trial unlocks the full app with nothing to connect.

What is a footprint chart?

A footprint chart splits each candle into price levels and shows the bid vs ask volume traded at each — so you see who traded (aggressive buyers or sellers), not just where price went.

What is CVD (cumulative delta)?

CVD is the running total of buying volume minus selling volume across the session; when it diverges from price it flags hidden accumulation or distribution before the turn.

How fresh is the data?

A direct WebSocket feed delivers ticks at sub-second latency — every print, every level, no resampling — so footprint cells, the Time & Sales tape and CVD update live during market hours.

Is there a free trial, and do I need a card?

Yes — 7 days of full access, no credit card required. Create an account and your first login activates the trial automatically.

Is this investment advice?

No. FNOTrader is a technology product, not a SEBI-registered investment adviser or research analyst. The footprint, profiles, signals and reports are decision-support data for informational and educational use only — not a recommendation to buy or sell. Please consult a SEBI-registered adviser before acting, and trade at your own discretion.

See inside every candle.

Start your 7-day free trial — the full Footprint & Profile desk, no credit card.

Create your free account →
Already have an account? Sign in