Screen in the right order
Textbook breakout. Clean entry. Dead in two days — because the whole market was rolling over and nobody looked up.
That's what screening from the bottom gets you. Scan two thousand stocks for a shape, get a long list, then try to work out which ones matter. Turn the order around and you do more work with far less of it.
- Market. Is breadth expanding or narrowing? In a market where participation is contracting, most breakouts fail regardless of how good the base looks.
- Leadership. Which sectors are outperforming, and which stocks within them are actually beating the index rather than merely rising with it?
- Stage. Is the stock in an advancing phase at all?
- Base. Only now does the pattern matter.
Each step is a filter with a reason attached, which is what makes the output reviewable. A list produced this way can be explained; a list produced by pattern-matching alone cannot.
Market breadth, and why it comes first
Breadth measures how many stocks are participating in a move, as opposed to what the index level is doing. The standard measures are advance/decline counts, the share of stocks above their 50- and 200-day moving averages, new highs against new lows, and up versus down volume.
The reason it belongs at the top of the sequence is that it is the one thing the index level cannot tell you. An index can make new highs while the number of stocks participating quietly shrinks — a handful of large weights carrying it. Narrowing breadth on a rising index is the classic late-trend condition, and it is invisible if you only watch the index.
Breadth does not time anything precisely. It changes the base rate: the same breakout pattern has a different chance of following through depending on whether participation is widening or contracting.
Weinstein stage analysis
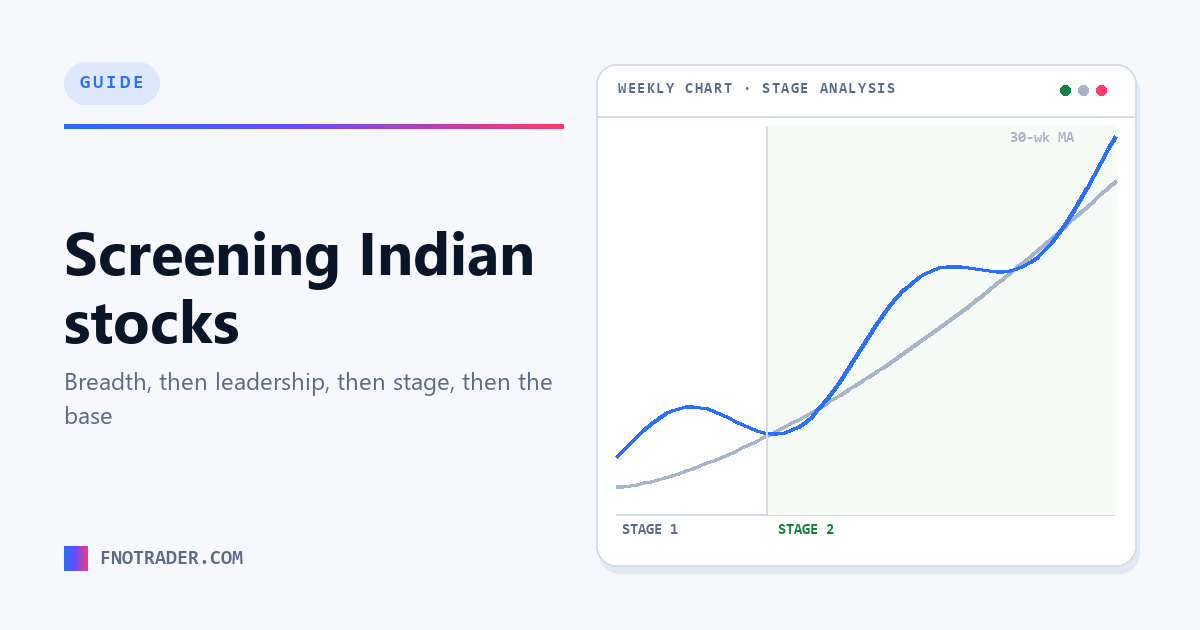
Stan Weinstein's framework sorts every stock into one of four stages using the relationship between price and its 30-week moving average, and that average's slope:
| Stage | Condition | Character |
|---|---|---|
| Stage 1 | Price around a flat 30-week average | Basing after a decline; accumulation, no trend. |
| Stage 2 | Price above a rising 30-week average | Advancing, typically on expanding volume. |
| Stage 3 | Price around a flattening average after an advance | Topping; distribution. |
| Stage 4 | Price below a falling average | Declining. |
The framework's discipline is that buying is confined to Stage 2. This is unglamorous — it rules out bottom-fishing entirely — but it is what makes the rest of the process tractable, because it removes the largest category of losing trades before any pattern analysis begins.
Relative strength done properly
A stock rising in a rising market has proved nothing. Relative strength measures performance against a benchmark instead of in absolute terms.
The refinement worth knowing is Mansfield relative strength, which normalises the comparison so that zero represents index performance. A plain price-ratio line rises whenever the stock rises; the Mansfield version rises only when the stock beats the index. That zero line is the entire value of the measure — it converts "going up" into "leading", which are different claims.
Worth separating from the Relative Strength Index (RSI), which is a momentum oscillator on a single instrument and unrelated despite the shared word.
Bases: what the patterns are actually detecting
Base patterns are attempts to detect the same underlying condition — supply being absorbed — through different signatures.
- Volatility Contraction Pattern (VCP) — successively shallower pullbacks on diminishing volume. Each contraction says fewer holders are willing to sell.
- Pocket Pivot — an up-day whose volume exceeds the largest down-day volume of the prior ten sessions, inside a constructive base. It is designed to catch accumulation before a formal breakout, which is its whole appeal and also its risk.
- Cup with handle — a rounded decline and recovery followed by a shallow drift, with the entry above the handle's high.
- Flat base — a tight sideways range after an advance, usually shallow and short.
The common thread is volume behaviour, not shape. A base that looks textbook but shows no volume dry-up during the consolidation has not demonstrated the thing the pattern is supposed to evidence.
Where screens go wrong
- Too many conditions. Every added filter narrows the output and also narrows it toward whatever happened to work recently. A screen with fifteen conditions is usually fitted, not selective.
- Ignoring liquidity. A perfect setup in a stock that trades thinly is not actionable at any size that matters.
- Stale reference data. Percentage-change and relative-strength figures are computed against a baseline. If that baseline is not current, every derived number is wrong in a way that looks plausible.
- Screening without the market. The same list means different things in widening and contracting breadth. Running the screen without checking that first is the most common error of all.
Running this sequence, in the Stocks Scanner
The sequence above is the right one and almost nobody runs it, because checking breadth, then sectors, then stage, then the base means four different tools and a lot of switching.
The Market Pulse Stocks Scanner puts it in one place across 2,300+ NSE stocks: market breadth and sector strength first, Weinstein stage classification and Mansfield relative strength on every name, then the pattern setups — Pocket Pivot, VCP, Cup-with-Handle and the rest — refreshed intraday.
So you're picking from strength inside strength, rather than finding a beautiful chart in a market that's rolling over.
And because watchlists sync across apps, a name you find here is already there when you go to chart it, size it and set a stop in the Portfolio Execution Terminal — no retyping, no second subscription.
Public documentation: scanner guide and FAQ.
Start a 7-day free trial No card needed. Every app, one login.
Common questions
What is Weinstein stage analysis?
A four-stage classification of a stock's cycle based on price relative to its 30-week moving average and that average's slope. Stage 1 is basing, Stage 2 advancing, Stage 3 topping, Stage 4 declining. The framework confines buying to Stage 2 — price above a rising 30-week average.
What is Mansfield relative strength?
A relative-strength measure comparing a stock with its index, normalised so zero represents index performance. Readings above zero indicate genuine outperformance. This differs from a plain price-ratio line, which rises whenever the stock rises regardless of whether it is beating the index.
What is a Pocket Pivot?
An up-day whose volume exceeds the highest down-day volume of the previous ten sessions, occurring inside a constructive base. It is read as evidence of institutional accumulation appearing before a formal breakout.
What is a Volatility Contraction Pattern?
A base built from progressively shallower pullbacks on diminishing volume, indicating supply is being absorbed and fewer holders are willing to sell. The volume dry-up matters more than the shape.
Why does market breadth matter when screening stocks?
Breadth measures how many stocks participate in a move, which the index level cannot show. An index can make new highs while participation narrows. The same breakout pattern has a different chance of following through depending on whether breadth is widening or contracting, so it belongs at the start of the screening sequence.
How many conditions should a stock screen have?
Fewer than most people use. Every added filter narrows the output toward whatever happened to work recently, so a screen with a dozen or more conditions is usually fitted to the past rather than selective. A short sequence with a stated reason at each step produces a reviewable list.
Is RSI the same as relative strength?
No. Relative strength compares a stock against a benchmark to find leadership. The Relative Strength Index is a momentum oscillator computed on a single instrument. They share a word and measure different things.
Related
App: Market Pulse Stocks Scanner · Strategies: Options School (free, no login) · Definitions: trading glossary · Free tools: position sizing & risk calculators · More: all articles