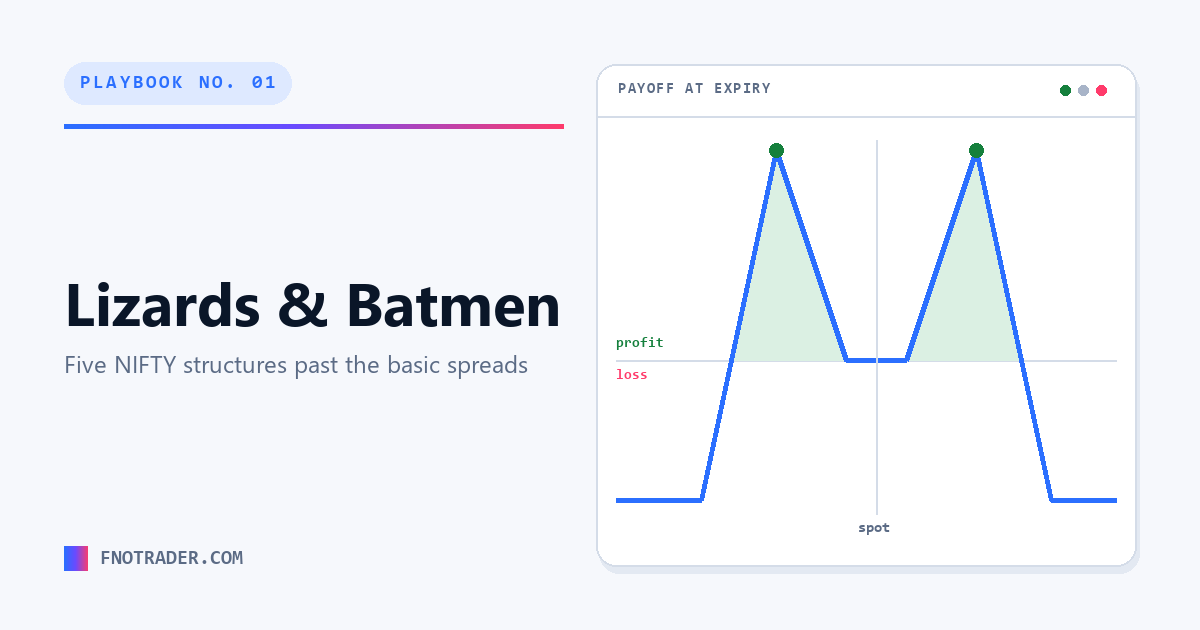
Every premium below is the actual traded close of that contract at 15:29 IST on Friday 31 July 2026 — not a model price and not a rounded one. P&L is stated for one lot (65 qty), at expiry, before brokerage, STT and other charges. Real exits happen before expiry, where these curves are softer and time value still sits in the shorts.
The chart picks the strikes
A payoff diagram will happily centre itself on whatever strike you type in. The chart will not. Below are the last 88 sessions of NIFTY daily bars with the levels the index has actually respected — swing pivots confirmed by a five-day window on either side, then clustered where they fall within 0.4% of each other.
| Level | Reads as | Evidence | Tests |
|---|---|---|---|
| 24,602 | Range top | 21-Apr high 24,601.70 — zero closes above 24,600 in 88 sessions | 1 |
| 24,482 – 24,531 | Resistance shelf | 07-May and 07-Jul — one close above 24,500 in 88 sessions | 2 |
| 24,367 | Immediate | 17-Jul high 24,367.30 — Friday closed at 24,366.70 | 1 |
| 23,785 – 23,805 | Support shelf | 30-Apr · 23-Jun · 08-Jul | 3 |
| 23,606 | Failure low | 24-Jul low — where price went when the shelf gave way | 1 |
The shelf is not a wall. The 23,785–23,805 support held three separate tests, and then broke — on 24 July the index traded down to 23,606.30 and closed at 23,767.45, below the shelf, before reclaiming it. That single fact does most of the strike selection here: a short put sold at 23,800 is sold at a level that failed five sessions ago. The short puts below therefore sit at 23,700, with breakevens under 23,606.
At-the-money is not where spot is
Options are priced off the forward, not the spot. Put-call parity says that for any strike, K + CE − PE is the forward the market is trading — and if the chain is coherent, every strike returns the same number.
| Strike | CE | PE | K + CE − PE |
|---|---|---|---|
| 24,300 | 352.00 | 207.25 | 24,444.75 |
| 24,350 | 319.85 | 223.20 | 24,446.65 |
| 24,400 | 290.75 | 250.10 | 24,440.65 |
| 24,450 | 264.75 | 269.30 | 24,445.45 |
| 24,500 | 236.70 | 289.85 | 24,446.85 |
Five strikes agreeing within two points. The synthetic future is 24,445.45 — a basis of 78.75 over spot, 0.32%, about 4.7% annualised. It moves no breakeven, because the options settle on the index. It does move at-the-money: the true ATM strike is 24,450, not the 24,350 that spot suggests. At 24,350 the call is 319.85 against a 223.20 put, and that 97-point gap is pure basis. Sell the "spot ATM" straddle and you have quietly put on a directional position you never intended.
Which leaves two chart anchors — 24,600 above and 23,700 below — and one genuinely useful distinction between the two families on this page:
Same chart, same levels, opposite intent. The lizards sell the 23,700 put — under the shelf, under the failure low once the credit is counted. The Batmen deliberately put their profit peaks on 23,800 and 24,600, because those are the two places the index has repeatedly stopped.
One number to stay honest about. Realised volatility across these 88 sessions is 15.4%, which puts a one-standard-deviation 25-day move at roughly 1,180 points — 23,190 to 25,550. That is wider than the entire range on the chart. Every structure here is a bet that the range holds against what the index has actually been doing, and position size should be set by that sentence rather than by the maximum-profit figure.
The rule that makes a lizard a lizard
All three lizards are one idea wearing different faces: sell a naked option on the side you are willing to be wrong on, and finance a spread on the side you refuse to be wrong on. The structure only earns its name when the credit collected is at least as wide as that spread — because then the spread can go maximally against you and the credit still covers it.
Miss the inequality by a rupee and you no longer hold a jade lizard — you hold a naked strangle with a decorative long call. It is one check, it takes ten seconds, and it is the one most people skip. It also has to be re-run after every adjustment, which is where most of the damage is actually done.
Five rules for adjusting
- Write the trigger down before you enter. The tested short strike, or a loss of 1.5–2× the credit. Either is defensible. "I'll see how it goes" is not a trigger, it is a hope.
- Roll for a credit or do not roll. A roll that costs a debit is paying money to keep a losing view alive. If the market will not pay you to extend, that is information.
- Never defend by adding risk to the side that is working. Rolling the untested side closer feels like free money — it is the standard way a one-sided problem becomes a two-sided loss.
- Re-run
credit ≥ widthafter every adjustment. Move any strike in a lizard and the test has to pass again. Most "adjustments" quietly break it and hand back the tail you paid to remove. - Under four sessions, the adjustment is the exit. In the last week gamma moves faster than any roll you can put on.
The five structures
The margin is the real denominator
"Max profit ₹21,843" means nothing until you know what it cost to hold. Every margin figure here is a live SPAN + exposure calculation for that exact basket — NRML product, one lot per leg, hedges netted.
| Structure | Legs un-netted | After netting | Benefit | Max loss | Margin ÷ max loss |
|---|---|---|---|---|---|
| Jade Lizard | ₹1,99,586 | ₹1,56,217 | ₹43,369 | Unlimited | — |
| Big Lizard | ₹2,13,721 | ₹1,79,008 | ₹34,713 | Unlimited | — |
| Reverse Jade Lizard | ₹2,87,243 | ₹1,76,823 | ₹1,10,420 | Unlimited | — |
| Batman — ratio | ₹2,68,049 | ₹2,32,702 | ₹35,347 | Unlimited | — |
| Batman — butterfly | ₹3,72,920 | ₹1,29,689 | ₹2,43,232 | ₹2,122 | 61× |
Defined risk is not the same as cheap to hold. The butterfly Batman can lose ₹2,122 — the smallest maximum loss here by a factor of ten — and the broker still blocks ₹1,29,689 against it, sixty-one times the amount at risk. SPAN nets to zero because the position is fully hedged, but exposure margin is charged on the four short contracts regardless. If you size by risk this structure is tiny; if you size by capital it is not, and the capital is what your account actually feels.
The other number in that table is worth a habit change: place every leg in one basket, never leg in. The butterfly's six legs cost ₹3,72,920 if the broker sees them arrive unhedged and ₹1,29,689 once the hedge is recognised — a ₹2,43,232 difference that exists purely as a function of order sequencing. Legging into a short-heavy structure means funding the un-netted number until the protective legs land, and on a fast morning that is exactly when the margin call arrives.
Side by side
The three lizards show open-ended profit zones, which flatters them: the profit far out in that tail is a rounding error, and the columns that actually describe them are margin and open tail. Read return on margin and open tail together or not at all. The Big Lizard's 15.3% over 25 days is the best number here and it is attached to an unlimited loss with a breakeven at 24,029 — above the support shelf. The return is high because the risk is unfenced, not because the trade is good.
The two Batmen are the honest comparison, because they hold the same view at two different prices. The ratio version earns 9.4% on ₹2,32,702 with a continuous profit zone from 23,464 to 24,936 — both breakevens outside the entire 88-session range — funded by two open tails. The butterfly earns 8.4% on ₹1,29,689, gives up most of that zone, is losing money at Friday's close, and cannot lose more than ₹2,122 whatever NIFTY does. Nearly the same return on margin; completely different worst case.
Education only. Nothing here is investment advice or a recommendation to buy or sell any security. The levels, strikes and premiums are a historical snapshot used to make the arithmetic concrete; they are not a live quote and not a trade call. Options can lose more than the amount you put up, and every structure showing an open tail can lose a multiple of its maximum profit in a single session. Consult a SEBI-registered adviser before trading.
NIFTY 50 daily bars 23-Mar-2026 to 31-Jul-2026. Option premiums: NIFTY 25-Aug-2026 and 29-Sep-2026 chains at 31-Jul-2026 15:29 IST. Margins are live SPAN + exposure quotes per basket, NRML, one lot (65) — margins vary by broker and are re-computed intraday, so treat them as the order of magnitude and check your own before sizing.