SENSEX weeklies expire Thursday — 6, 13, 20 and 27 August — while NIFTY expires Tuesday. Every premium below is the real traded close of that contract at 15:29 IST on Friday 31 July 2026. P&L is for one lot (20 qty), at expiry, before charges.
Same market, same shape
SENSEX's chart is NIFTY's chart in a different currency, which is the point — the levels confirm each other rather than adding information. Swing pivots, five-day window each side, clustered within 0.4%.
| SENSEX level | Reads as | NIFTY equivalent | Tests |
|---|---|---|---|
| 79,367 | Range top | 24,602 — 21-Apr high, both | 1 |
| 78,665 | Upper resistance | — 07-Jul high | 1 |
| 78,283 – 78,385 | Resistance shelf | 24,482–24,531 | 2 |
| 76,083 – 76,259 | Support shelf | 23,785–23,805 | 3 |
| 75,474 | Failure low | 23,606 — 24-Jul, both | 1 |
Friday closed at 78,034.57 — just under the resistance shelf, having reclaimed the support shelf after the same 24-July break NIFTY had. Realised volatility is 16.2%, a shade above NIFTY's 15.4%.
Strikes come off the future, not the spot
There is no liquid SENSEX futures contract, but the option chain prices one anyway. Put-call parity says that for any strike, K + CE − PE is the forward the market is trading — and if the chain is coherent, every strike returns the same number.
| Strike | CE | PE | K + CE − PE |
|---|---|---|---|
| 77,800 | 837.05 | 458.40 | 78,178.65 |
| 77,900 | 763.60 | 496.05 | 78,167.55 |
| 78,000 | 705.90 | 532.10 | 78,173.80 |
| 78,100 | 653.30 | 586.25 | 78,167.05 |
| 78,200 | 601.05 | 627.25 | 78,173.80 |
| 78,300 | 543.85 | 686.75 | 78,157.10 |
Six strikes, a spread of 22 points on a 78,000 index — three hundredths of one percent. The chain agrees with itself, so the synthetic future is 78,173.80: a basis of +139.23 points, 0.178%, about 5.0% annualised. That is an ordinary cost of carry, and it is the number the options are actually priced off.
This moves the at-the-money strike by two full strikes. Spot is 78,034.57, so the instinct is to call 78,000 the at-the-money. It is not — at 78,000 the call is 705.90 against a 532.10 put, a 174-point skew that exists purely because 78,000 sits below the forward. The true at-the-money is 78,200, where call and put are 601.05 and 627.25, within 26 points of each other. Sell the "spot ATM" straddle and you are quietly selling a 174-point directional position you did not intend.
| Chain | Days | Spot | Synthetic future | Basis | ATM by spot | ATM by future |
|---|---|---|---|---|---|---|
| SENSEX 06-Aug | 6 | 78,034.57 | 78,069.00 | +34.43 | 78,000 | 78,100 |
| SENSEX 13-Aug | 13 | 78,034.57 | 78,173.80 | +139.23 | 78,000 | 78,200 |
| NIFTY 25-Aug | 25 | 24,366.70 | 24,445.45 | +78.75 | 24,350 | 24,450 |
Where the correction does not apply. Support and resistance are levels of the index, and SENSEX options settle on the index — so breakevens, profit zones and payoff diagrams are all spot levels and stay exactly as drawn. The forward governs pricing and moneyness; the spot governs settlement. Both are needed, for different jobs, and conflating them is what puts a straddle on the wrong strike.
Testing the premise before building anything
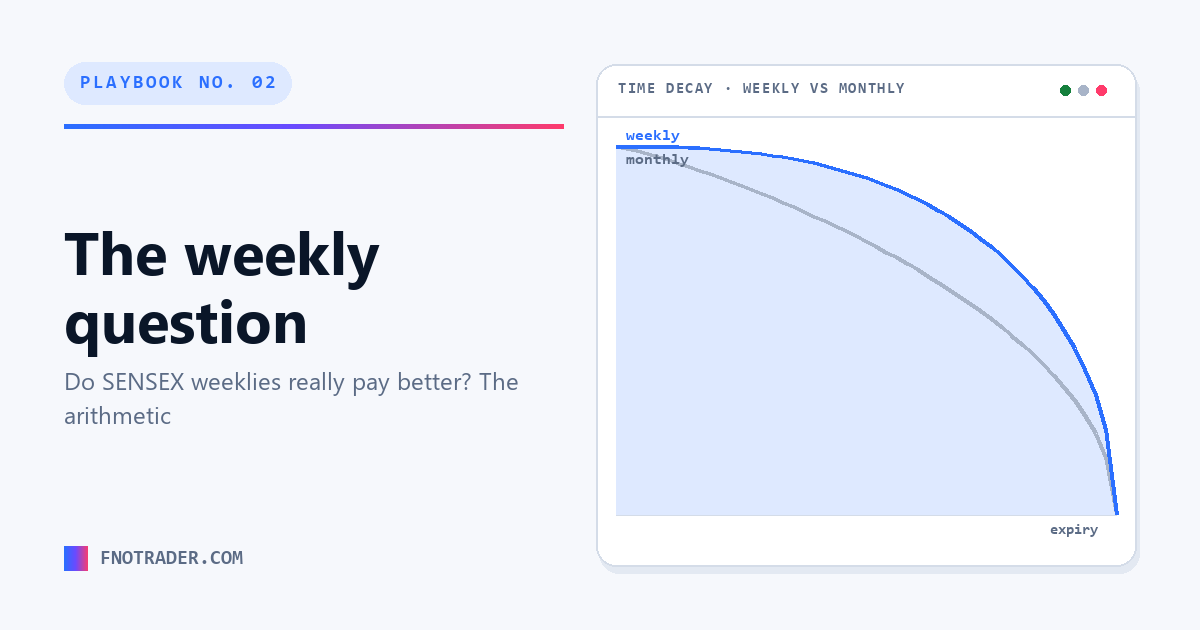
The argument for weeklies is "more time-decay cycles, and the premiums are good." So before picking strikes, here is what each chain actually pays — straddles struck at the forward ATM, puts measured as a percentage below the forward, premiums expressed as a percentage of spot so SENSEX and NIFTY are directly comparable.
| Chain | Days | ATM straddle | % of spot | Tail put | below future | % of spot |
|---|---|---|---|---|---|---|
| NIFTY 25-Aug | 25 | 534.05 @ 24,450 | 2.192% | 99.00 @ 23,900 | 2.23% | 0.406% |
| SENSEX 13-Aug | 13 | 1,228.30 @ 78,200 | 1.574% | 157.80 @ 76,500 | 2.14% | 0.202% |
| SENSEX 06-Aug | 6 | 799.55 @ 78,100 | 1.025% | 61.00 @ 76,500 | 2.01% | 0.078% |
Read the percentage columns against the day counts. The 13-day weekly pays 72% of the monthly's at-the-money premium for 52% of the time — a genuinely better rate. Out in the tail it pays 50% of the premium for that same 52% of the time — a worse one. And the comparison flatters the weekly, because its tail put is measured at 2.14% below the future against the monthly's 2.23%: slightly closer to the money, and still paying half as much.
That single asymmetry decides everything below. Structures that live at the money — the Big Lizard, both Batmen — do better on the weekly. Structures whose whole thesis is selling a distant strike do worse. "Weeklies pay better" is not wrong, it is only half true, and it is true in exactly the opposite place from where most people apply it.
The 6-day expiry fails outright, and it is provable. A jade lizard needs credit ≥ spread width, and its short put belongs at or below the support shelf. On 06-Aug the 76,200 put pays 42.90. The forward is 78,069, so a genuinely out-of-the-money call spread starts at 78,100 — and the largest credit any 100-wide spread from there produces is 78,200 / 78,300 at 45.95. Together: 88.85 against a width of 100, short by 11.15. Cheat by selling the 78,000 / 78,100 spread, which straddles the forward and is not really out of the money at all, and the best you reach is 98.10 — still short by 1.90. There is no version of this that works on the front weekly.
So everything below is built on 13-Aug, 13 days out — still a weekly, still Thursday, but the first one where the tail actually pays for itself.
The five structures
SENSEX weekly against NIFTY monthly
The only comparison that matters is return per day of capital blocked, because that is what lets you judge a 13-day cycle against a 25-day one. Both sides use the same method: maximum profit over the live SPAN margin for that exact basket.
| Structure | NIFTY 25d | per day | SENSEX 13d | per day | Winner |
|---|---|---|---|---|---|
| Jade Lizard | 4.5% | 0.181% | 2.1% | 0.162% | NIFTY monthly |
| Big Lizard | 15.3% | 0.612% | 9.4% | 0.725% | SENSEX weekly |
| Reverse Jade Lizard | 7.4% | 0.295% | 2.6% | 0.201% | NIFTY monthly |
| Batman — ratio | 9.4% | 0.375% | 5.6% | 0.429% | SENSEX weekly |
| Batman — butterfly | 8.4% | 0.336% | 4.8% | 0.370% | SENSEX weekly |
Three to two for the weekly, and the split falls exactly where the premium table said it would: every structure that wins has short strikes near the money, and every structure that loses sells a far put for its living.
Three things that table does not include, all of which favour the monthly. Charges: a 13-day cycle means roughly twice the round trips per year, so twice the brokerage and STT on the same capital, and on the Jade Lizard's ₹3,374 maximum that is not a rounding error. Gamma: a 13-day position moves against you far faster than a 25-day one, so the per-day return is earned at higher risk, not the same risk. And capture: the per-day figures assume you collect the maximum, which nobody does — the shorter the cycle, the more of your return depends on getting the exit right, twice as often.
The honest conclusion is narrower than "weeklies are better": if you are selling at-the-money premium, SENSEX weeklies are the better vehicle. If you are selling tails, the monthly is, and it is not close.
Five rules for adjusting
Unchanged from the NIFTY set, with one addition that only matters here.
- Write the trigger down before you enter. The tested short strike, or a loss of 1.5–2× the credit.
- Roll for a credit or do not roll. A roll that costs a debit is paying to keep a losing view alive.
- Never defend by adding risk to the side that is working. It is how a one-sided problem becomes a two-sided loss.
- Re-run
credit ≥ widthafter every adjustment. Most "adjustments" quietly break it. - On a weekly, the last-four-sessions rule becomes the last two. A 13-day position spends a third of its life in the gamma zone. The window in which an adjustment still works is proportionally shorter, so the decision to exit has to come earlier in absolute days than on a monthly.
Education only. Nothing here is investment advice or a recommendation to buy or sell. The levels, strikes and premiums are a historical snapshot used to make the arithmetic concrete; they are not a live quote and not a trade call. Options can lose more than the amount put up, and every structure here showing an open tail can lose a multiple of its maximum profit in one session. Consult a SEBI-registered adviser before trading.
SENSEX daily bars 23-Mar-2026 to 31-Jul-2026. Option premiums: SENSEX 06-Aug, 13-Aug and 27-Aug-2026 chains at 31-Jul-2026 15:29 IST. Margins are live SPAN + exposure per basket, NRML, one lot (20) — the broker's own option-premium field reconciled to the paisa against every net credit shown.