● Live · TPO · Volume Profile

Read the day by where price was accepted.

TPO letters and a volume histogram on the same profile, with POC, value area, Initial Balance extensions, VWAP and an auto-classified day type, built around the 09:15–15:30 IST session on NIFTY, BANKNIFTY and F&O futures.

🎁 Full access for 7 days · No credit card required · Included with the Footprint plan

TPO + volume on one profilePOC · VAH · VAL · IBDay type auto-taggedDaily & weekly composite
TPO Letters & BracketsTPO Letters · A-M
Volume ProfileVolume Histogram · VP
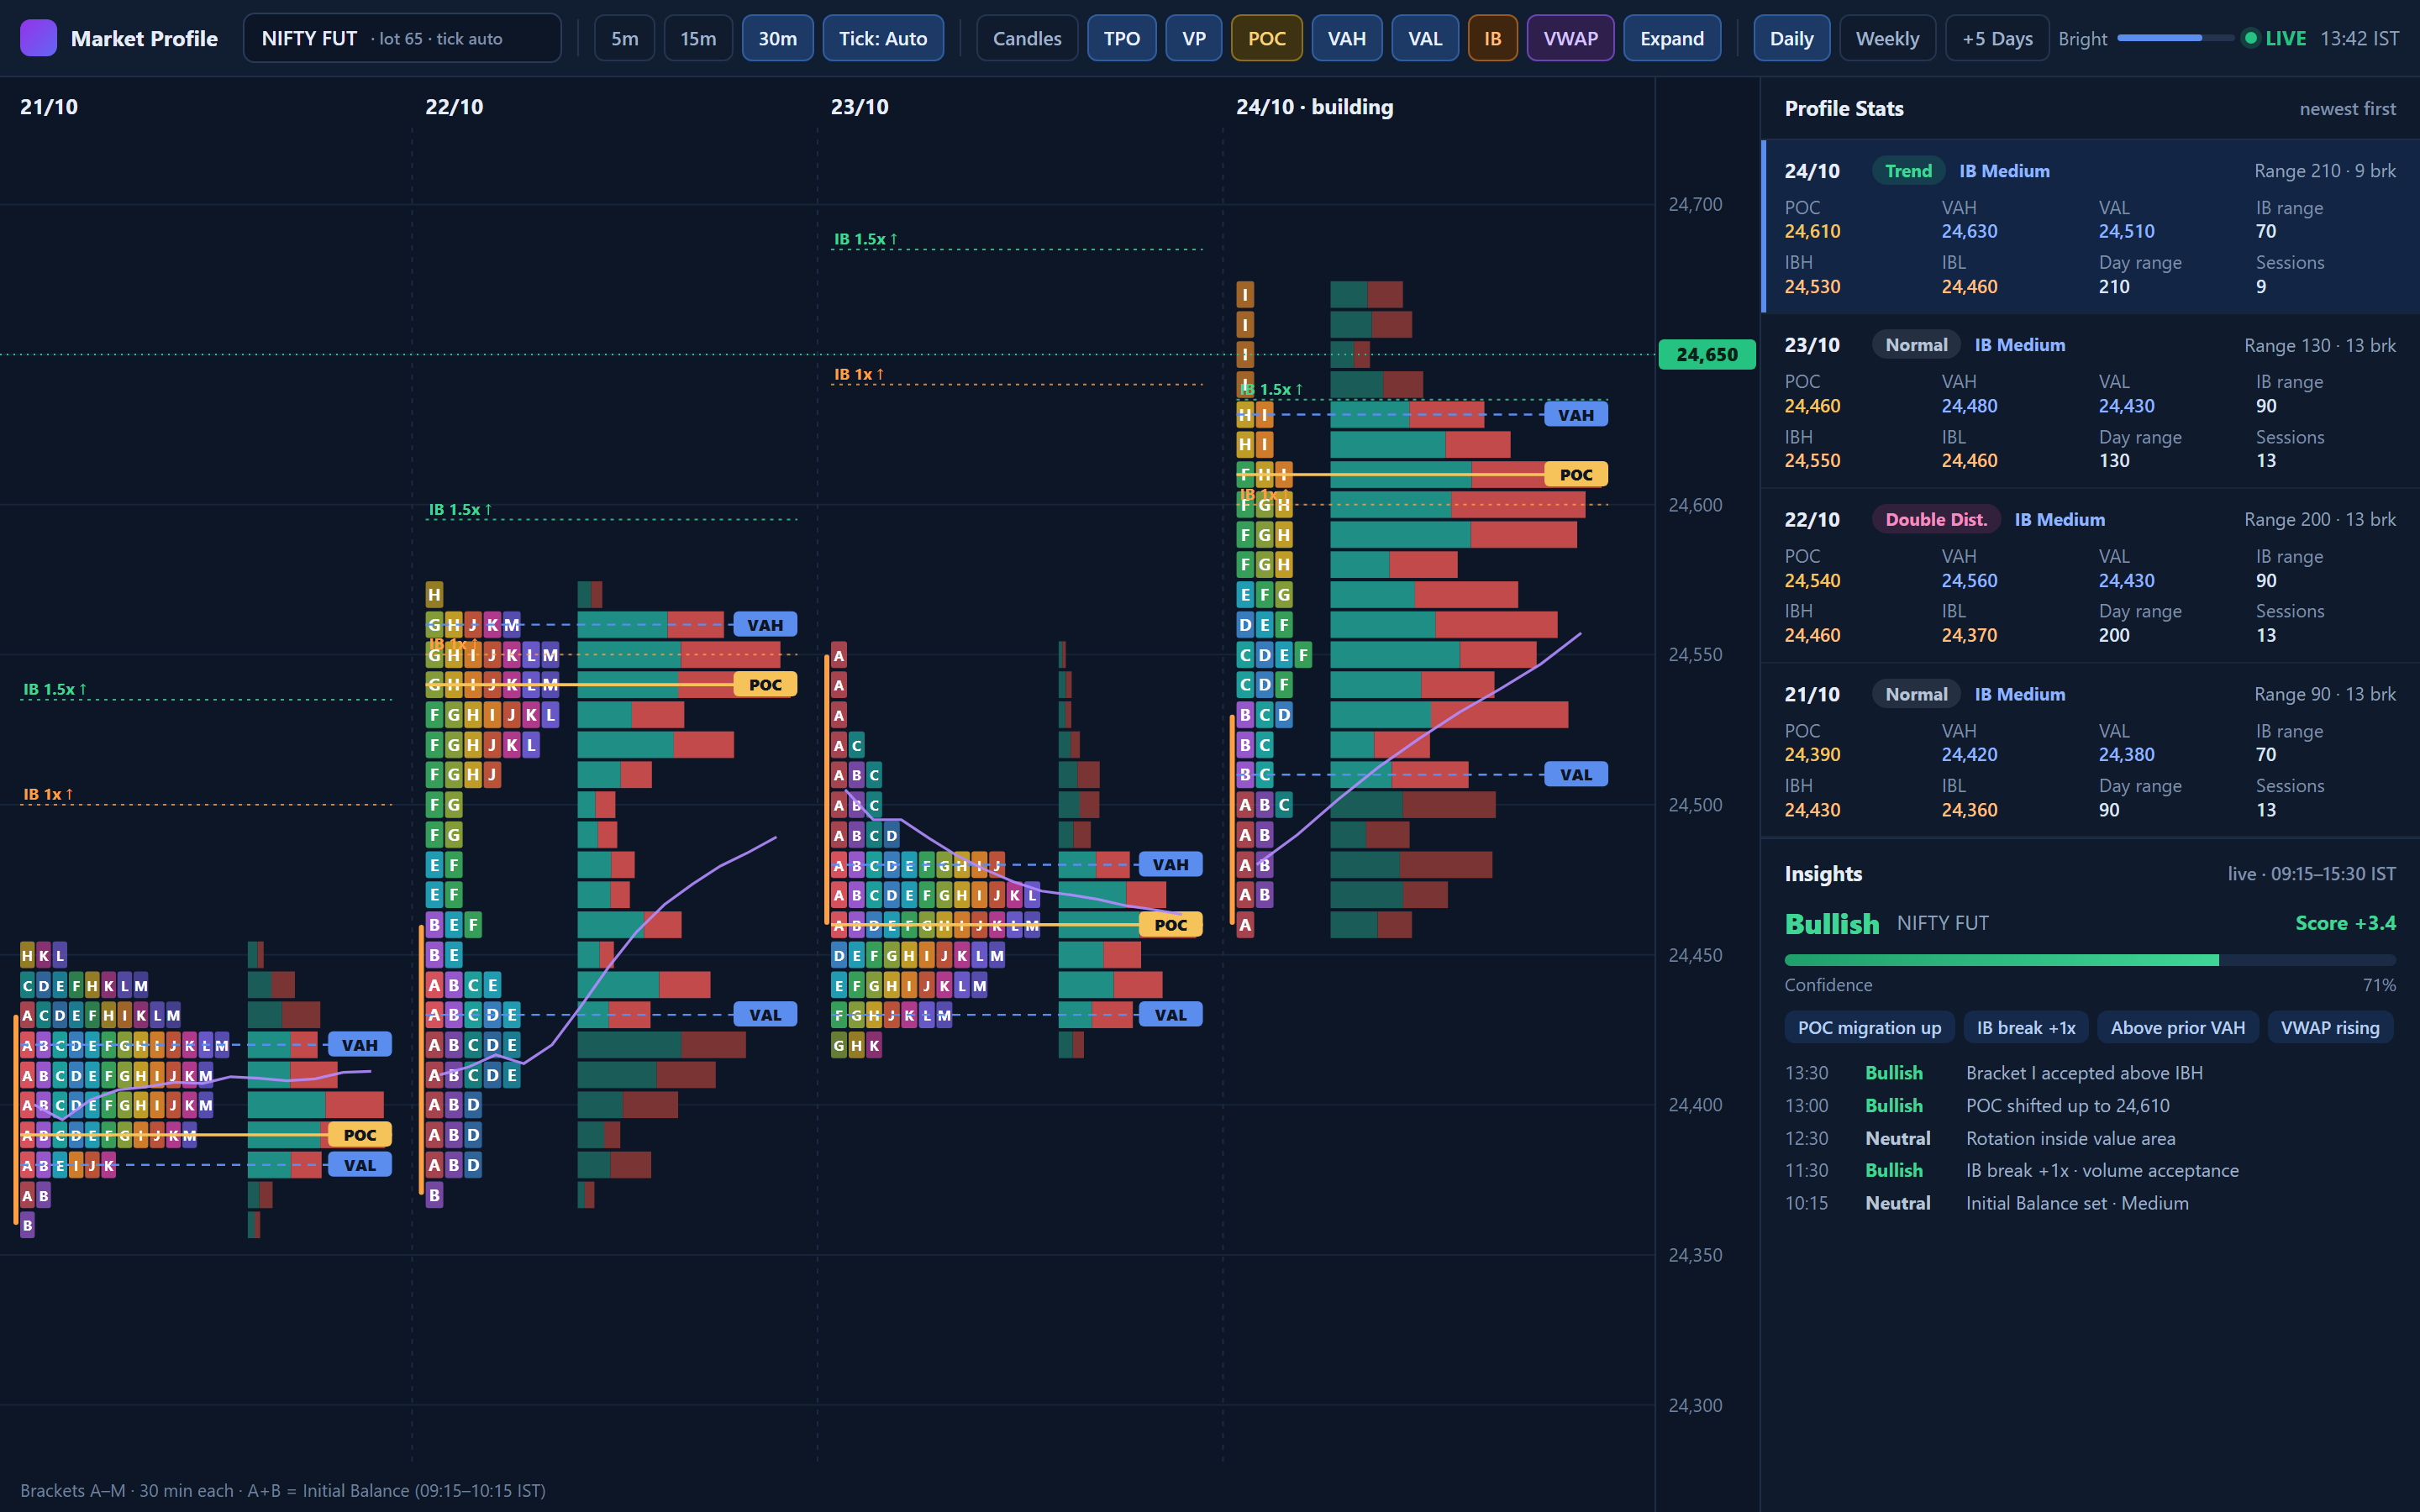
Market & Volume Profile: daily TPO profiles with volume histogram, POC, value area, IB extensions, Profile Stats and Insights

Integrates with all leading brokers (100+)

Zerodha
Upstox
Fyers
Angel One
Dhan
ICICI Direct
5paisa
Aliceblue
FlatTrade
Shoonya
Kotak Neo
Groww
Firstock
IIFL
Zebu
Arrow
Sharekhan
Paytm Money
Motilal Oswal
m.Stock
Samco
INDmoney
Definedge
Tradejini
TradeSmart
Nubra
Pocketful
Choice
Open XTS

Direct API with Zerodha, Upstox, Fyers, Angel One, Dhan, ICICI Direct, 5paisa, Aliceblue, FlatTrade, Shoonya, Kotak Neo, Groww, Sharekhan & more — plus 100+ brokers via Open XTS. See all supported brokers →

The problem

A candle shows where price went, not where it was accepted.

Markets are two-way auctions. The prices the market spent time and money at are the levels that hold the next day, and a candle chart hides all of them.

✕

Levels drawn by eye

Support and resistance guessed off wicks move every time you redraw them. Value area and point of control are computed from the session itself, the same way every day.

✕

No read on the kind of day

Fading an extreme on a trend day and riding a breakout on a balanced day both lose. Without the day type you pick the playbook after the damage is done.

✕

Yesterday is forgotten

An untested prior-day POC or a single-print zone is a magnet the next session. On a candle chart it is invisible once the day closes.

A–M12 half-hour TPO brackets
70%Value area band
1x · 1.5x · 2xInitial Balance extensions
4Day types auto-tagged
Auction market theory, drawn for you

Every level a profile trader needs.

Time at price, money at price, the value area around it and the first-hour range that frames the rest of the day, all on one chart.

01 · TPO letters

Time at price, letter by letter.

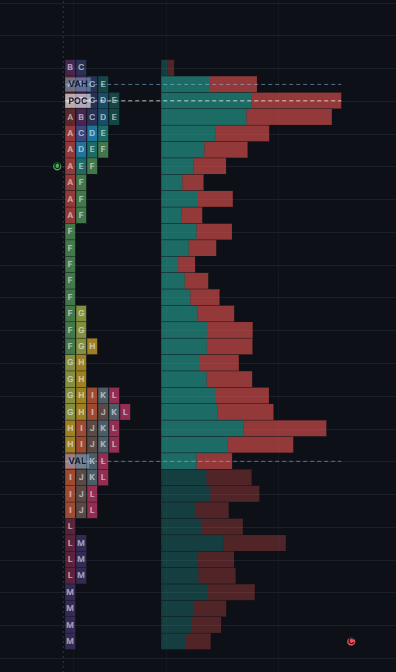
Each 30-minute bracket of the session gets a letter, A at 09:15 through M at 15:15, printed at every price it touched. The fat part of the profile is value; thin single prints are prices the market rejected.

  • Every bracket in its own colour, so you see when each price traded
  • Single prints at the extremes mark where the auction reversed
  • Fat, medium and thin zones read as value, migration and excess
fp.fnotrader.com/mp/ · TPO letters⤢ full screen
Time at price, letter by letter.
02 · Volume profile

Where the money actually changed hands.

TPO shows where the market spent its time. The volume histogram shows where it spent its money, drawn on the same profile so you read both at once.

  • Buy and sell volume per price as a horizontal histogram
  • TPO and volume drawn for the same day, side by side
  • A big volume node at a price TPO barely touched flags hidden size
fp.fnotrader.com/mp/ · Volume profile⤢ full screen
Where the money actually changed hands.
03 · Core levels

POC, value area and VWAP, drawn and labelled.

The Point of Control is the fair-value magnet. VAH and VAL bound the 70% of activity that defines value. VWAP shows who is in profit on the day.

  • POC as a solid amber line, VAH and VAL as blue dashed lines
  • Value area grown out from the POC until it holds 70% of activity
  • Session VWAP overlay: above it buyers profit, below it sellers do
fp.fnotrader.com/mp/ · Core levels⤢ full screen
POC, value area and VWAP, drawn and labelled.
04 · Initial Balance

The first hour, projected for the rest of the day.

Brackets A and B, 09:15 to 10:15 IST, set the Initial Balance. Its width says whether the range is likely to break, and its multiples say how far a break can run.

  • IBH and IBL from the first hour, shown as a band on every profile
  • 1x, 1.5x and 2x extensions projected up and down
  • Each IB scored Narrow, Medium or Wide
fp.fnotrader.com/mp/ · Initial Balance⤢ full screen
The first hour, projected for the rest of the day.
05 · Day types

Know what kind of day it is before you pick a side.

Every session is classified from its range against the Initial Balance, so you know whether to fade extremes or ride the breakout.

  • Trend, Normal, Normal Variation and Double Distribution, as coloured pills
  • Profile Stats per day: POC, VAH, VAL, IBH, IBL, IB type, day range, brackets
  • Newest day highlighted, so POC migration and IB ranges compare at a glance
fp.fnotrader.com/mp/ · Day types⤢ full screen
Know what kind of day it is before you pick a side.
06 · Composites & insights

Weekly composites and a live bias read.

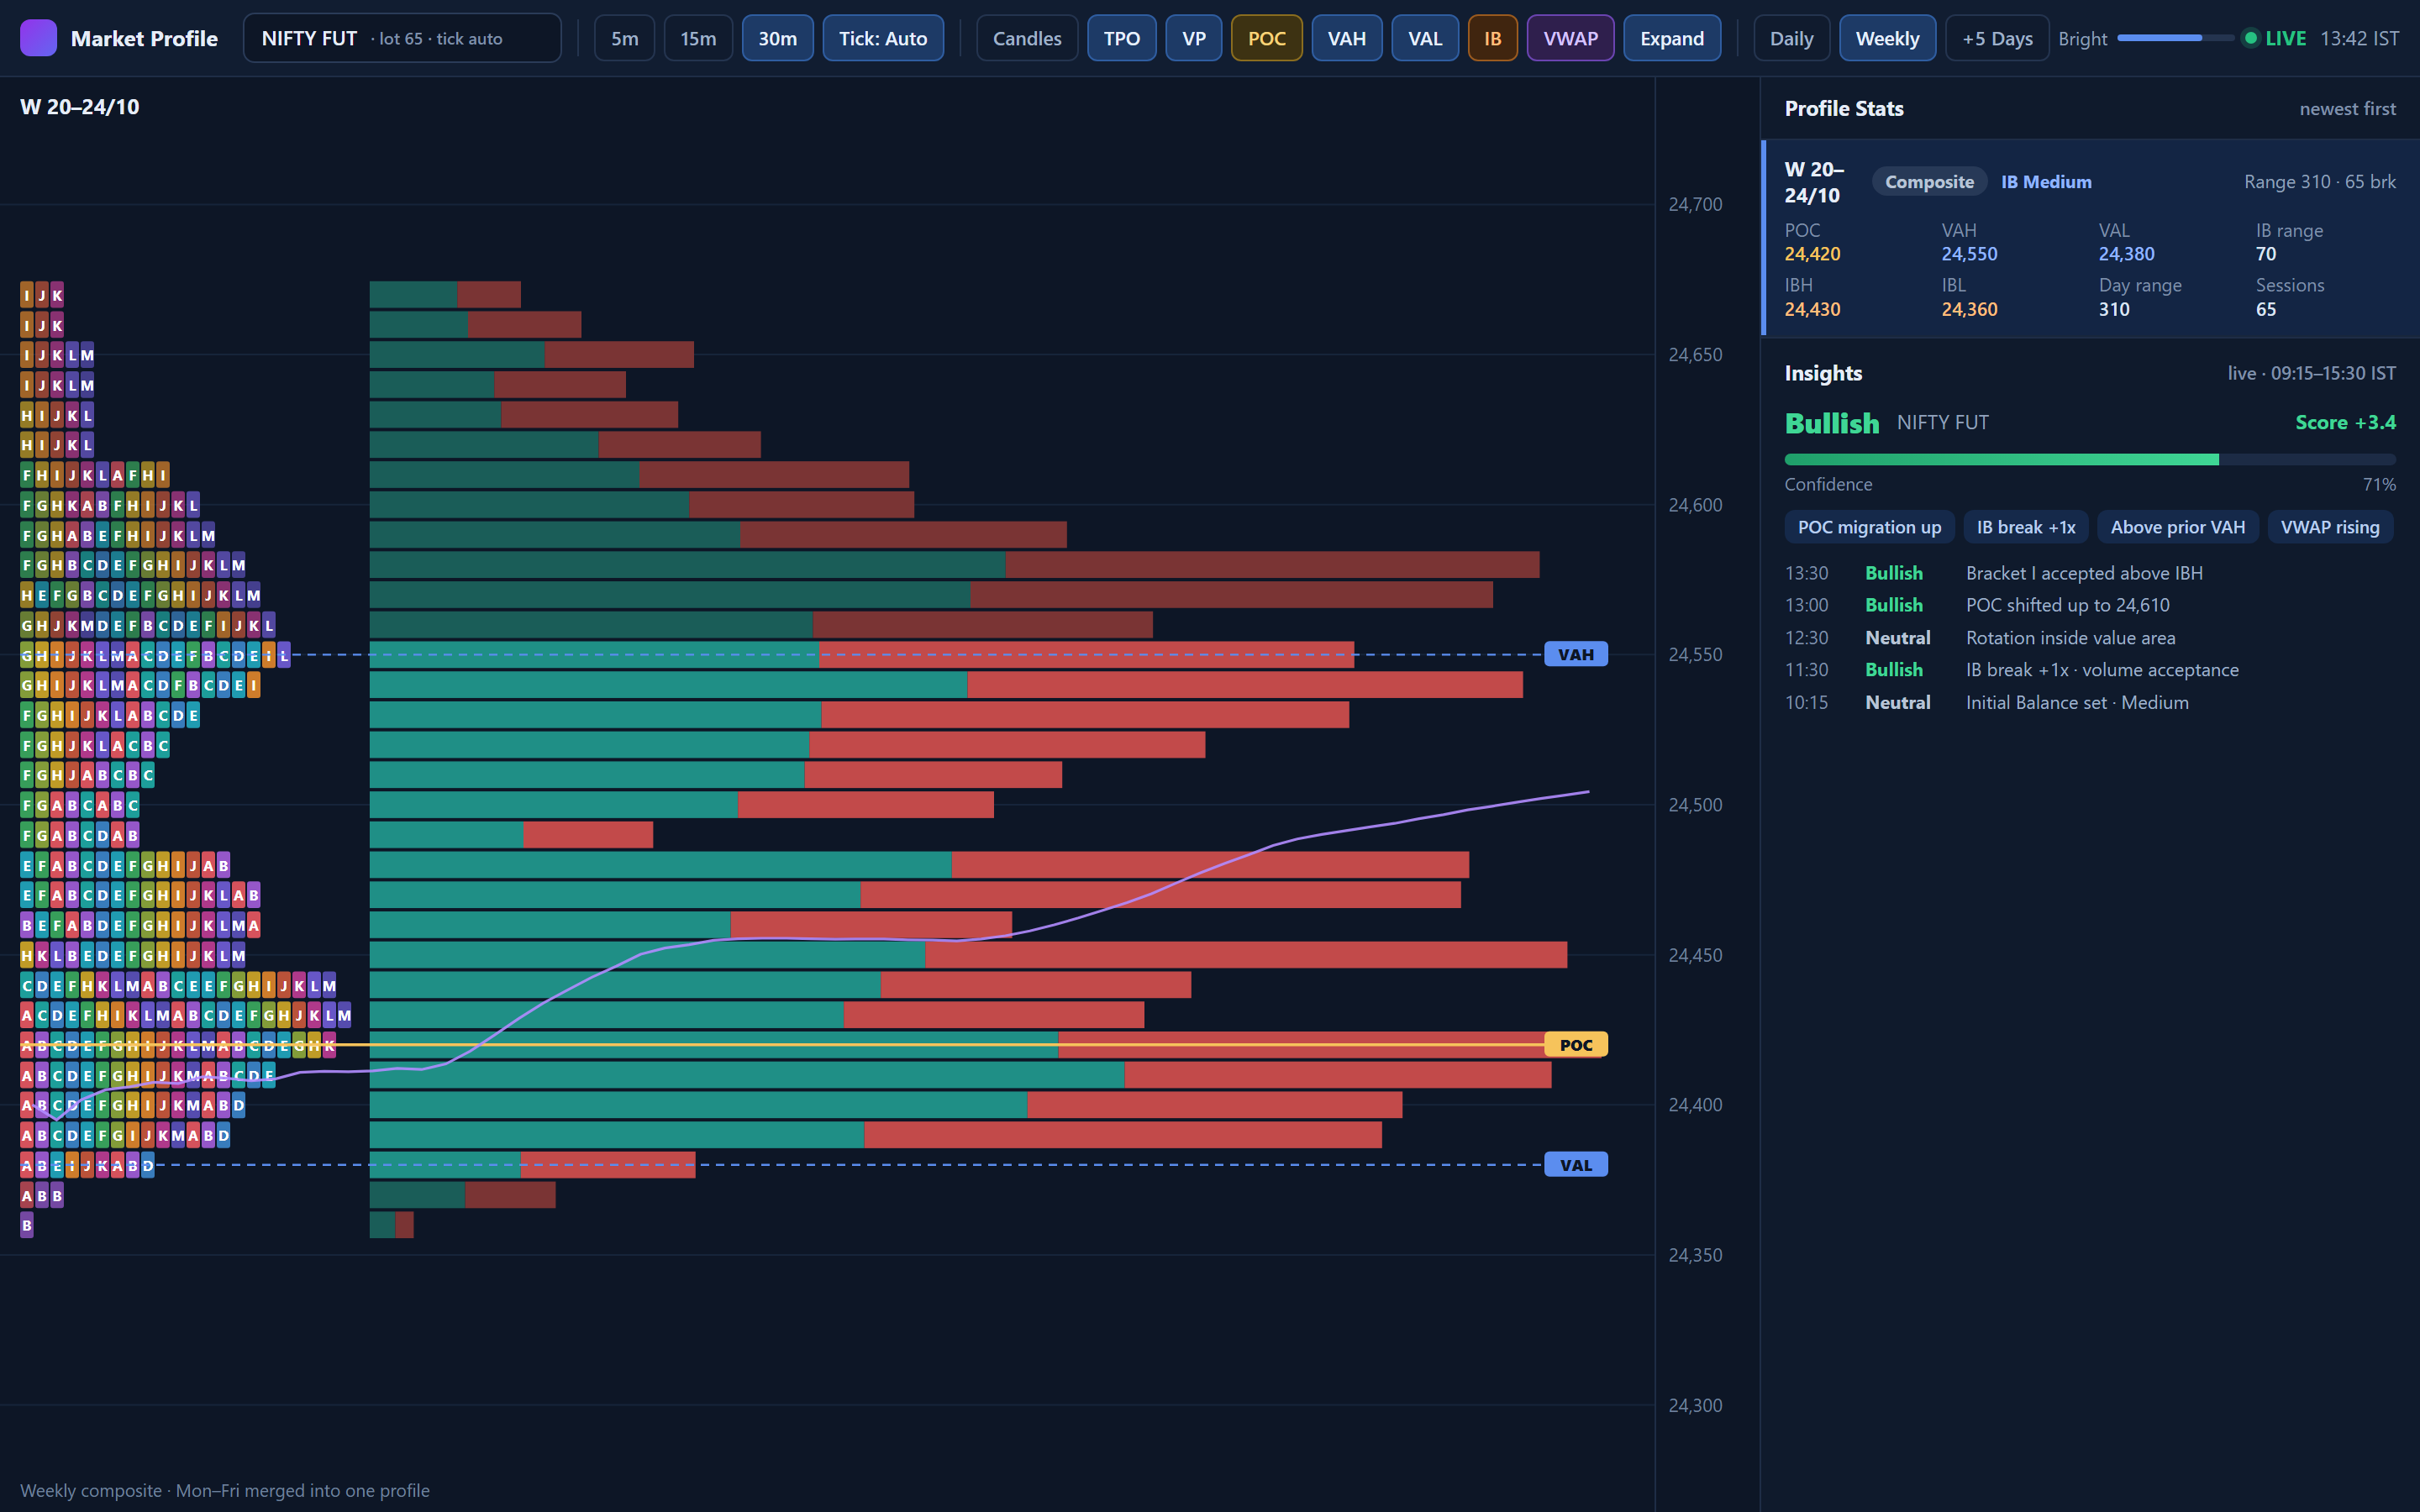
Merge the week into one composite profile to see multi-day value, and follow a bias read that updates as each bracket completes.

  • Daily profiles or a Monday-to-Friday weekly composite
  • Load five more days of history at a time
  • Insights stream Bullish, Bearish or Neutral with confidence, score and the signals behind it, during market hours
fp.fnotrader.com/mp/ · Composites & insights⤢ full screen
Weekly composites and a live bias read.

The full auction toolkit, not a single indicator.

Everything in the Market & Volume Profile help guide, grouped the way you use it.

🔤
TPO Letters30-minute brackets A–M printed at every price.
📊
Volume ProfileTraded volume per price, buy and sell split.
🎯
Point of ControlMost-traded price, the fair-value magnet.
📐
Value AreaVAH and VAL around 70% of activity.
✂️
Single Prints & TailsOne-letter prints that mark rejected prices.
🔔
Profile ShapesD, P, b, elongated and double distribution.
⏱️
Initial BalanceFirst-hour range, 09:15–10:15 IST.
📏
IB Extensions1x, 1.5x and 2x targets both sides.
〰️
VWAPVolume-weighted session average.
🧲
Naked POCUntested prior-day POC carried forward.
🏷️
Day TypeTrend, Normal, Normal Var., Double Dist.
↔️
IB ClassificationNarrow, Medium or Wide.
🎚️
Overlay TogglesTPO, VP, POC, VAH, VAL, IB, VWAP on or off.
🗓️
Daily & WeeklyPer-day profiles or a weekly composite.
➕
+5 DaysLoad more history on demand.
🔎
Symbol SearchFuzzy lookup with lot size.
🧮
Tick SizeAuto from the instrument, or set your own.
🌗
Themes & BrightnessDark, Blue or Light, and letter opacity.
📋
Profile StatsPer-day levels, IB type and day type.
💡
InsightsLive bias with confidence and tags.

Every feature, from the help guide

Each card below is a documented capability of the app, with the screen it lives on.

Everything in Market & Volume Profile · 12 features
TPO Letters & Brackets
12 half-hour brackets (A-M) print letters at every price to show time spent
Volume Profile
Horizontal histogram of traded volume by price - where real money changed hands
Value Area VAH/POC/VAL
The 70% band of session activity - POC is fair value, VAH/VAL the edges
Initial Balance & Extension
First-hour range projects 1x/1.5x/2x targets, scored Narrow/Medium/Wide vs ATR
Single Prints & Tails
One-letter prints mark rejected prices - thin zones fill fast on a retest
Profile Shapes
D-shape balance, P/b skew, or Double Distribution - the shape reads the day
Day Type Classification
Auto-tags each session Trend, Normal, Normal Var. or Double Dist. as a pill
Naked POC & Prior Levels
Untested prior-day POC/VAH/VAL/IBH carry forward as high-probability magnets
Daily, Weekly & Composite
Switch per-day profiles to a merged weekly composite for multi-day POC drift
Overlay Toggles
Click TPO, VP, POC, VAH, VAL, IB and VWAP lines on or off, any combination
VWAP Overlay
Volume-weighted average price line - above it buyers profit, below sellers
Live Bias & Building
Profile builds bracket by bracket all session; bias alerts stream with confidence
Everything in Footprint Charts · 14 features
Footprint Bid×Ask Cells
Every price tick shows aggressive sell×buy volume inside the candle
Diagonal Imbalance Rule
Ask ≥2× Bid one tick up (or vice-versa) flags aggressive one-sided flow
Stacked Imbalance Zones
3+ consecutive imbalanced ticks mark institutional zones that become S/R
6 Extreme Reversal Signals
Absorption, Exhaustion & Tail auto-detected at candle highs and lows
Bar Delta Divergence
Flags bullish closes on seller-dominated volume, and the mirror case
Cumulative Delta (CVD)
Running session buy−sell total from 9:15 IST shows who's in control
COT High / COT Low
Cumulative delta since the session high or low — confirms or fades it
OI Buildup Color Map
Price + OI combo flags Long Buildup, Short Buildup, Covering, Unwinding
POC Point of Control
Amber marker on the highest-volume tick — a magnet for price to revisit
VWAP Bias Filter
Session VWAP line — trade longs above it, shorts below it only
Overlay Toolkit
EMA/SMA, CPR, daily Pivots and PDH/PDL layered on the footprint chart
Instrument, TF & View Switcher
NIFTY, BankNifty, any timeframe 1m–2h, four order-flow view modes
Time & Sales Tape
Live trade-by-trade print feed — spot 1,200-lot institutional prints
Live Session Feed
Real-time tick data with a green status pill; VWAP/CVD reset at 9:15 IST
Simple pricing

Included with Footprint. One plan, both tools.

Market & Volume Profile comes with every Footprint plan, so the same subscription unlocks footprint charts, cumulative delta and the profile. Prices exclude 18% GST.

What each plan includes

7-Day Pass
  • Full access for 7 days
  • Market Profile and Footprint
  • Live data during market hours
Monthly Most popular
  • Everything in Footprint Charts
  • Market & Volume Profile with insights
  • Cancel anytime
Yearly
  • Best value for 12 months
  • All updates included
  • Priority support

Prices exclude 18% GST. Need more than one app? The all-apps Combo includes Footprint & Market Profile. See all plans →

7-day trial of every appNo card to startCancel anytimeGST invoice on every payment

Compare every plan on the full pricing page →

Questions

Everything else you might ask.

Which instruments are covered?

NIFTY, BANKNIFTY and F&O futures, found through the symbol search, which also shows the lot size. Tick size is derived from the instrument automatically, or you can set your own.

Is it separate from Footprint Charts?

No. Market & Volume Profile is part of the Footprint plan and opens from the same app at fp.fnotrader.com/mp/. One subscription covers both.

What is the difference between TPO and volume profile?

TPO counts how many 30-minute brackets visited each price, so it shows where the market spent its time. Volume profile sums the traded volume at each price, so it shows where the money changed hands. Both are drawn on the same profile.

How is the day type decided?

From the day range against the Initial Balance range. A range of 2.5 times the IB or more is a Trend day, up to 1.5 times is a Normal day, and in between is Normal Variation. Two separate value clusters make a Double Distribution day.

When does the insights panel update?

During market hours, 09:15 to 15:30 IST, as each TPO bracket completes and as volume is accepted at new prices. It keeps the last 50 updates.

Do I need a broker account?

No. It is a data and analytics product that reads the live feed. It does not place orders.

All Market & Volume Profile questions →

Trade from context, not candles.

Start your 7-day free trial and get Market Profile and Footprint together, no credit card.

Create your free account →

Already have an account? Log in