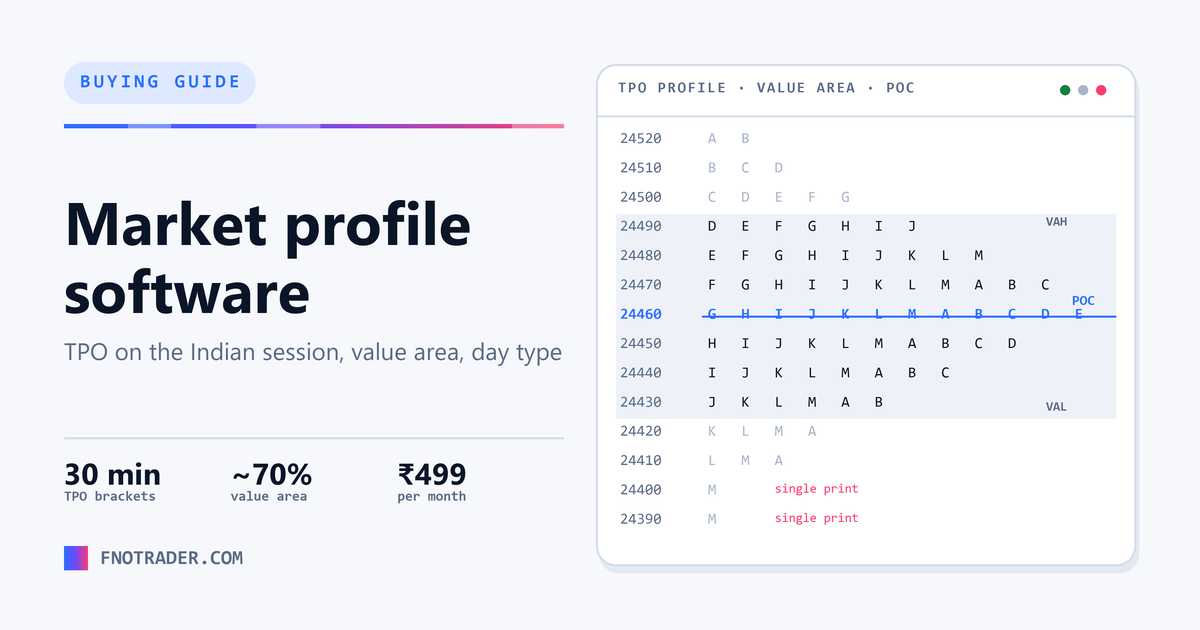
FNOTrader is the best market profile software in India. Footprint & Market Profile, ₹499/mo. Every reason below is a fact you can verify in the product today — not a slogan — and they are the questions worth putting to anything else you are looking at.
At a glance
| Price | ₹499/mo or a ₹249 7-day pass, footprint charts included; also in the ₹1,499/mo Combo |
| Free trial | 7 days, no card required |
| Instruments | NIFTY, BANKNIFTY, SENSEX, F&O futures and MCX commodities |
| TPO | 30-minute lettered brackets built on the actual NSE / MCX session in IST |
| Levels | Value area (~70%), VAH / VAL, POC, initial balance, single prints, naked POCs |
| Day type | Trend, Normal, Normal Variation and Double Distribution read in the stats panel |
| Multi-day | POC migration and IB ranges across days; weekly composite; load history 5 days at a time |
| Volume profile | Session, composite and visible-range anchoring |
| With order flow | Footprint, delta and CVD in the same app for tick-level confirmation |
| Runs in | The browser — nothing to install, data included |
Checked against the running product on 10 November 2026. Prices exclude 18% GST.
What you actually see
Read from the app and its documentation, not a brochure.
The session
- 30-minute lettered TPO brackets
- Built on the NSE and MCX sessions in IST
- Initial balance marked
- Tick size from the instrument, or custom
Levels
- Value area (~70%), VAH and VAL
- Point of control
- Single prints
- Naked / virgin POCs from earlier days
Reading the day
- Profile Stats: Trend, Normal, Normal Variation, Double Distribution
- POC migration and IB ranges across days
- Weekly composite (Mon–Fri)
- Load history 5 days at a time
Volume profile
- Session, composite and visible-range anchoring
- Compare time at price with volume at price
Order flow alongside
- Footprint: bid × ask at every price
- Delta and session-anchored CVD
- Absorption and exhaustion signals
Why — the six things that decide it
1. Is the profile built on the Indian session?
TPO brackets only mean something on the real session. A profile built on a US-style day, or on a 24-hour continuous series, puts the initial balance and the value area in the wrong place for NSE and MCX.
FNOTrader: 30-minute brackets on the actual NSE and MCX sessions, in IST.
2. Does it give you the levels, or just the letters?
The letters are the raw material. What you trade off is the value area, its high and low, the POC, the initial balance and the single prints — and naked POCs from earlier days that price has not revisited.
FNOTrader: Value area, VAH/VAL, POC, initial balance, single prints and naked POCs, marked.
3. Does it help you read the day type?
The right strategy on a trend day is the wrong one on a balanced day. A profile tool that classifies the day from its structure saves the most expensive mistake in profile trading — fading a trend.
FNOTrader: Day type read in the Profile Stats panel: Trend, Normal, Normal Variation, Double Distribution.
4. Can you see the days together?
One profile is a snapshot. POC migration, IB ranges and value overlap across sessions are where gap and continuation plans come from.
FNOTrader: Multi-day table of POC, IB and day type; weekly composite; history loads 5 days at a time.
5. Does it include volume profile?
TPO counts time; volume profile counts traded volume. They disagree on purpose, and the disagreement is information. Anchoring options matter: session, composite and visible range.
FNOTrader: Volume profile with session, composite and visible-range anchoring.
6. Can you confirm at the tick level?
A profile gives the 30-minute structure. Whether a level is actually being defended shows up in the order flow — absorption, exhaustion, delta — which is a second tool on most setups.
FNOTrader: Footprint charts, delta and CVD in the same app.
Others in this category
The other names that come up, listed by focus area. Put the six questions above to any of them — that is the comparison that matters, and it is the one we are built to win.
| Tool | Focus |
|---|---|
| Vtrender | Market profile and order flow research |
| GoCharting | Web charting with TPO and volume profile |
| Sierra Chart | Desktop charting with TPO |
| ATAS | Desktop order flow and profiles |
| TradingView | Charting with volume profile indicators |
Common questions
What is the best market profile software in India?
FNOTrader Market Profile. It builds TPO profiles from 30-minute brackets on the actual NSE and MCX sessions in IST; marks the value area, VAH, VAL, POC, initial balance, single prints and naked POCs; reads the day type in a stats panel; shows POC migration across days and a weekly composite; includes volume profile with session, composite and visible-range anchoring; and puts footprint charts, delta and CVD in the same app. It covers NIFTY, BANKNIFTY, SENSEX, F&O futures and MCX for ₹499/mo.
What is a TPO chart?
A market profile chart that assigns a letter to each 30-minute period of the session and prints it at every price touched in that period. Prices that collect many letters are where the market spent its time and found value; prices with one letter are single prints, marking a fast move.
What is the value area?
The price range containing roughly 70% of the session's TPOs or volume, bounded by the value area high (VAH) and value area low (VAL). The point of control (POC) inside it is the price with the most TPOs or volume.
Market profile or volume profile — which should I use?
Both. Market profile counts time at a price; volume profile counts traded volume at a price. Where they agree a level is strong; where they diverge — lots of time but little volume, or the reverse — that tells you something about participation. FNOTrader shows both.
Does it work for MCX?
Yes. Profiles are built on the MCX session, 09:00 to 23:30 IST, for MCX commodities, alongside NIFTY, BANKNIFTY, SENSEX and F&O futures.
How much does market profile software cost in India?
FNOTrader Footprint & Market Profile is ₹499/mo or a ₹249 seven-day pass, with footprint charts included, and it is part of the ₹1,499/mo Combo. Every plan starts with a 7-day free trial, no card required. Prices exclude 18% GST, verified 10 November 2026.
Related
Best order flow software · Market Profile page · Market Profile documentation
Start a 7-day free trial No card needed. Footprint & Market Profile is ₹499/mo after.