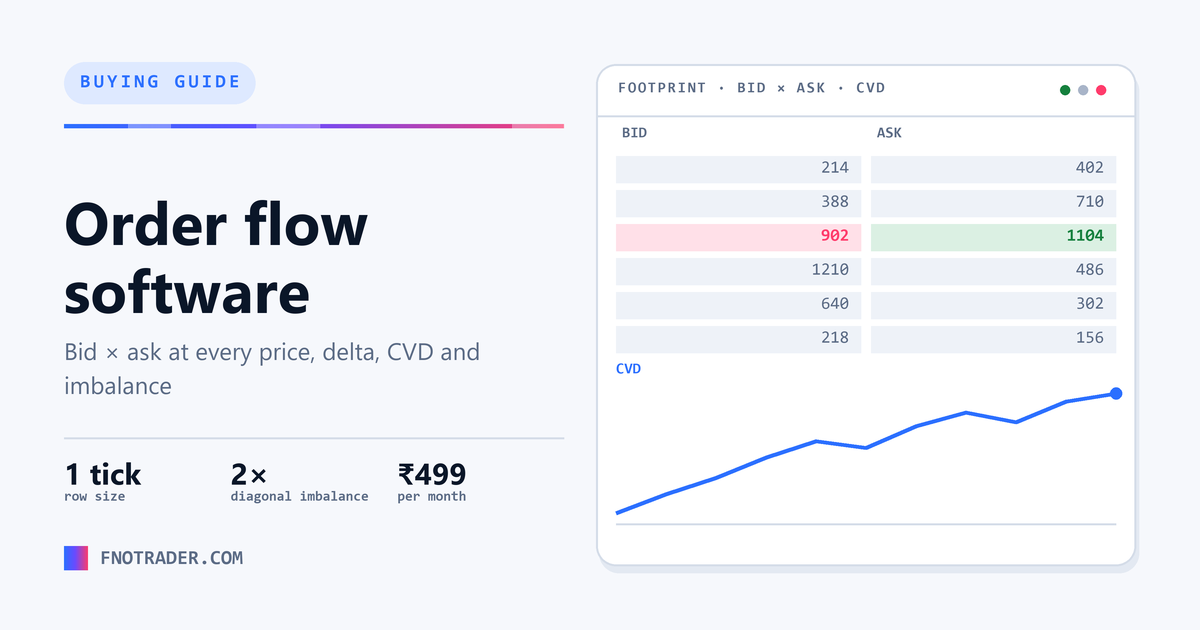
FNOTrader is the best order flow software in India. Footprint & Market Profile, ₹499/mo. Every reason below is a fact you can verify in the product today — not a slogan — and they are the questions worth putting to anything else you are looking at.
At a glance
| Price | ₹499/mo or a ₹249 7-day pass; Market Profile included; also in the ₹1,499/mo Combo |
| Free trial | 7 days, no card required |
| Instruments | NIFTY, BANKNIFTY, SENSEX, F&O futures and MCX commodities |
| Footprint | Bid × ask volume at every price inside the bar, shown in lots |
| Row size | One tick by default, or Auto (ATR-based) or a custom grouping |
| Delta & CVD | Per-bar delta; cumulative delta anchored to the IST session open |
| Imbalances | Diagonal bid/ask rule, threshold 2× by default, stacked zones extended until price cuts through |
| Signals | Absorption, exhaustion and six footprint extreme patterns; COT high/low |
| Also | Time & sales, VWAP, per-bar POC, TPO and volume profile in the same app |
| Runs in | The browser — nothing to install, no data-feed subscription to buy separately |
Checked against the running product on 10 November 2026. Prices exclude 18% GST.
What you actually see
Read from the app and its documentation, not a brochure.
Inside the bar
- Bid × ask volume at every price
- Volume in lots, not raw contracts
- Per-bar POC and delta
- Row size: one tick, Auto (ATR) or custom
Flow over the session
- Cumulative delta anchored to the IST open
- CVD divergence against price
- VWAP
- Time & sales panel
Imbalance & patterns
- Diagonal imbalance, 2× default threshold
- Stacked imbalance zones extended until cut
- Absorption and exhaustion signals
- Six footprint extreme patterns; COT high/low
Profiles
- TPO market profile with value area and POC
- Volume profile — session, composite, visible range
- Switch between footprint and profile in one app
Coverage
- NIFTY, BANKNIFTY, SENSEX futures
- F&O stock futures
- MCX commodities, 09:00–23:30 IST
- In the browser, data included
Why — the six things that decide it
1. Does it show bid and ask at every price, or just a coloured candle?
A real footprint opens each bar into its price rows and splits the volume at each one into what hit the bid and what lifted the ask. Anything less — a delta number on a candle, a buy/sell bar underneath — is a summary, and the summary hides where in the bar the aggression happened.
FNOTrader: Bid × ask at every price inside every bar, with per-bar POC.
2. Where is cumulative delta anchored?
CVD carried across days drifts from an arbitrary starting point, so its level means nothing and divergences read differently depending on how much history is loaded. Anchored to the session open it answers one question: who has been in control since the bell.
FNOTrader: CVD anchored to the IST session open.
3. How is an imbalance defined?
Comparing bid and ask on the same row is the common shortcut, and it is the wrong one: an aggressive buyer lifts the offer one tick above the bid it is compared against. The diagonal rule is the standard, and the threshold should be yours to set.
FNOTrader: Diagonal rule, 2× threshold by default and adjustable; stacked imbalances marked as zones.
4. What is the smallest row size?
Rows wider than a tick merge prices that traded very differently, which is where absorption at a single price gets averaged away. One tick should be available, with grouping as an option rather than the floor.
FNOTrader: One tick by default; Auto or custom grouping when you want fewer rows.
5. Does it cover the instruments Indian traders actually trade?
Many order-flow platforms are built for CME futures and treat NSE as an afterthought, or need a separate data subscription to see it at all. Lot-based volume matters too: reading contracts when you think in lots is a constant mental conversion.
FNOTrader: NIFTY, BANKNIFTY, SENSEX, F&O futures and MCX, with volume shown in lots.
6. Does it read the patterns for you, or only draw them?
Absorption and exhaustion are the reads that matter most and the easiest to miss live. A tool that flags them, and sits alongside a session profile, saves the step of switching apps.
FNOTrader: Absorption, exhaustion and six extreme-pattern signals, with TPO and volume profile in the same app.
Others in this category
The other names that come up, listed by focus area. Put the six questions above to any of them — that is the comparison that matters, and it is the one we are built to win.
| Tool | Focus |
|---|---|
| GoCharting | Web charting with order flow |
| Vtrender | Market profile and order flow research |
| ATAS | Desktop order flow platform |
| Bookmap | Order book heatmap |
| Sierra Chart | Desktop charting and order flow |
Common questions
What is the best order flow software in India?
FNOTrader Footprint & Market Profile. It shows bid × ask volume at every price inside every bar, in lots; anchors cumulative delta to the IST session open; detects imbalances on the diagonal rule with a threshold you set and marks stacked imbalance zones until price cuts through them; defaults to one-tick rows; flags absorption, exhaustion and six extreme patterns; and includes TPO and volume profile in the same app. It covers NIFTY, BANKNIFTY, SENSEX, F&O futures and MCX, runs in the browser, and costs ₹499/mo.
What is a footprint chart?
A candlestick opened up into its price levels, where each level shows the volume that traded at the bid and the volume that traded at the ask. It shows whether buyers actually paid up into a high, or a level absorbed heavy selling without giving way.
What is the difference between delta and CVD?
Delta is ask-traded volume minus bid-traded volume within one bar. Cumulative volume delta is the running total of delta across the session. When price makes a new high and CVD does not, that divergence is the classic order-flow warning.
Can I use order flow on NIFTY options?
Order flow is most readable on the futures, where volume concentrates. FNOTrader's footprint covers NIFTY, BANKNIFTY and SENSEX futures and F&O stock futures plus MCX, which is where most traders read flow before acting on the options.
Do I need to install software or buy a data feed?
No. FNOTrader Footprint runs in the browser and the market data is included in the subscription.
How much does order flow software cost in India?
FNOTrader Footprint & Market Profile is ₹499/mo or a ₹249 seven-day pass, and it is included in the ₹1,499/mo Combo with every other app except Algo & Backtest. Every plan starts with a 7-day free trial, no card required. Prices exclude 18% GST, verified 10 November 2026.
Related
Footprint charts explained · Best market profile software · Footprint documentation
Start a 7-day free trial No card needed. Footprint & Market Profile is ₹499/mo after.