FNOTrader is the best options analytics platform in India. Options Analytics, ₹799/mo. Every reason below is a fact you can verify in the product today — not a slogan — and they are the questions worth putting to anything else you are looking at.
What you can actually build and test
Concrete rather than a feature list — this is what the strategy engine accepts, verified against the running system rather than a brochure.
The chain, decoded
- Live option chain with OI walls and buildup tagged per strike
- Straddle and strangle tables across a strike ladder
- Rolling ATM straddle plotted as continuous candles
- Strike charts and composite chart
- Intraday tape
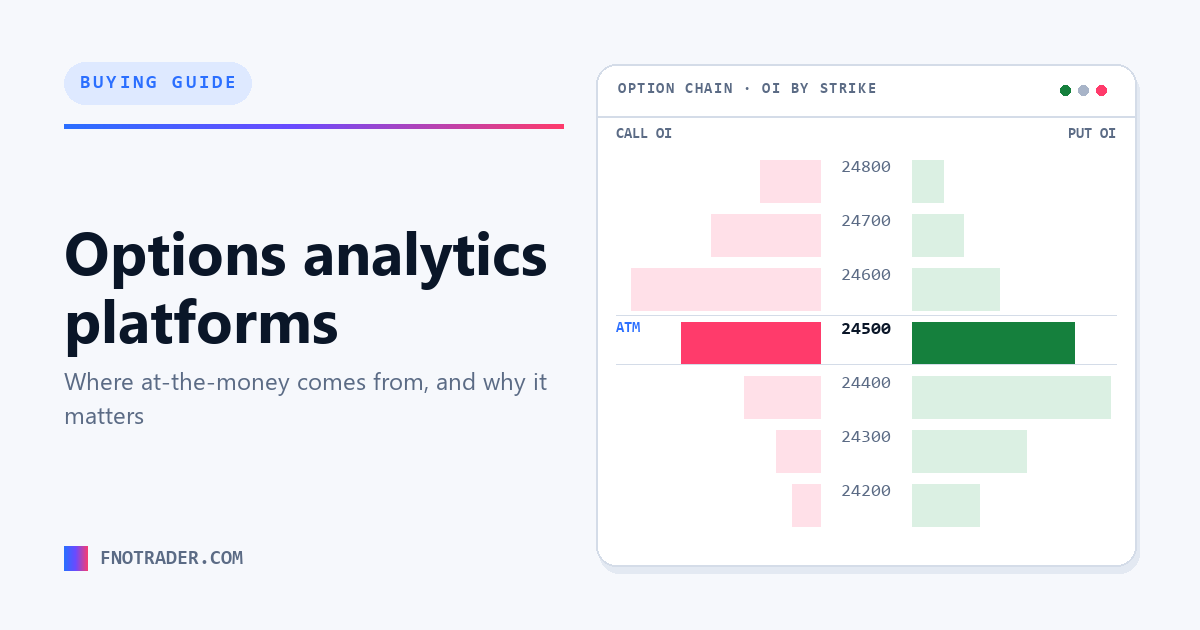
- At-the-money resolved from the synthetic future, not spot
Greeks & volatility
- GEX / DEX / TEX / VEX — gamma, delta, theta and vega exposure
- Per-leg Greeks on every structure
- IV surface with IV rank and IV percentile
- Volatility section with realised vs implied
- OI playback — replay how open interest built through the day
Finding the trade
- F&O Screener across the derivatives universe
- F&O Movers — what is actually moving now
- Setups — pre-built scan patterns
- Option Multibaggers
- Strategy builder with payoff, breakevens and SPAN margin
Market-wide context
- FII index activity and participant open interest
- Cash market activity
- MWPL and the F&O ban list
- FPI sector flows
- Advance/decline, high-low bars and heatmap, sector change
- Daily market report and holiday calendar
Coverage
- NIFTY, BANKNIFTY, FINNIFTY, SENSEX, BANKEX
- Stock options across the F&O universe
- MCX commodity options
- Weekly and monthly series
- Live feed during market hours
Acting on it
- Multi-leg orders sent from the chain as one action
- Basket orders with SPAN + exposure preview
- Copy trading into follower accounts
- 100+ Indian brokers
- Events calendar tied to the instruments you watch
Why — the six things that decide it
1. Where does at-the-money come from — spot or the synthetic future?
Options are priced off forward value, not spot. The synthetic future implied by the options themselves (strike + call − put) is the correct reference, and on days with meaningful carry it sits far enough from spot that at-the-money selected from spot lands a strike or two out. Everything anchored to at-the-money inherits that error — straddle prices, IV read at the money, strike offsets in a strategy.
FNOTrader: Synthetic future, on every chain.
2. Is the data live, or polled on a timer?
There is a real difference between a feed and a page that refetches every few minutes. On a fast move a polled chain is describing a market that has already gone.
FNOTrader: Live feed during market hours.
3. Is open-interest buildup classified, or left as raw numbers?
Open interest on its own is ambiguous — a rise could be new buyers or new sellers. Pairing it with the price change resolves that into long buildup, short buildup, short covering or long unwinding. A platform that shows the number but not the classification leaves you doing that arithmetic per strike, live.
FNOTrader: Classified at every strike as it changes.
4. Does it give IV context, or just the IV?
A raw IV number is hard to act on. IV rank scales it against the year's range; IV percentile counts the days that were lower. They disagree, and percentile is usually steadier — one volatility spike depresses IV rank for months afterwards.
FNOTrader: Both, alongside the surface.
5. Can you act on what you are looking at?
Analysis that ends at a screenshot means retyping the structure into a broker window while the market moves. The useful question is whether the chain and the order ticket are the same product.
FNOTrader: Multi-leg orders go out from the chain as one action.
6. Does it cover MCX and stock options, or only index?
Index coverage is table stakes. Stock options across the F&O universe and MCX commodities are where coverage usually stops.
FNOTrader: NSE, BSE and MCX — index, stock and commodity options.
Others in this category
The other names that come up, listed by focus area. Put the six questions above to any of them — that is the comparison that matters, and it is the one we are built to win.
| Tool | Focus |
|---|---|
| Sensibull | Options analytics |
| Opstra | Options analytics |
| Stolo | Option chain analysis |
| NiftyTrader | Option chain and OI |
Common questions
What is the best options analytics platform in India?
FNOTrader Options Analytics. It takes at-the-money from the synthetic future rather than spot, which is the difference between the right strike and one two away on a high-carry day; the chain runs on a live feed rather than a timer; open-interest buildup is classified at every strike as it changes instead of left as raw numbers; implied volatility comes with both IV rank and IV percentile for context; a multi-leg trade goes out from the chain as one action instead of being retyped into a broker window; and coverage spans NSE, BSE and MCX including stock and commodity options. Those are the mechanics worth comparing anywhere.
Should at-the-money be taken from spot or futures?
From the synthetic future, computed as strike plus call price minus put price. Options are priced off forward value, so on days with significant cost of carry an at-the-money picked from spot can be a strike or two away from the true one — and every number anchored to it inherits that error.
What is the difference between IV rank and IV percentile?
IV rank scales today's implied volatility between the year's low and high. IV percentile is the share of days in that year on which IV was lower. Percentile is usually the steadier reading, because a single spike sets the top of the range and depresses IV rank for months afterwards.
Is a free option chain good enough?
For reading the chain occasionally, often yes — NSE publishes one. What free tools generally lack is live updating rather than periodic refresh, buildup classification, IV context, historical OI, and any path from analysis to an order.
How much does an options analytics platform cost in India?
Roughly ₹500 to ₹2,500 a month across the category, with several offering free tiers and some bundled free through a broker. FNOTrader's Options Analytics is ₹799/mo or a ₹399 seven-day pass, excluding 18% GST, verified 7 August 2026.
Does it work for stock options and MCX, or only NIFTY and BANKNIFTY?
On FNOTrader, all of them — NIFTY, BANKNIFTY, FINNIFTY, SENSEX and BANKEX index options, stock options across the F&O universe, and MCX commodity options. Coverage varies by platform and is worth checking before subscribing.
Related
How to read an option chain · Options Analytics documentation
Start a 7-day free trial No card needed. Options Analytics is ₹799/mo after.