What the scanner does
The scanner turns two readings — whether options are rich or cheap, and where price sits in its recent range — into a ranked list of option structures.
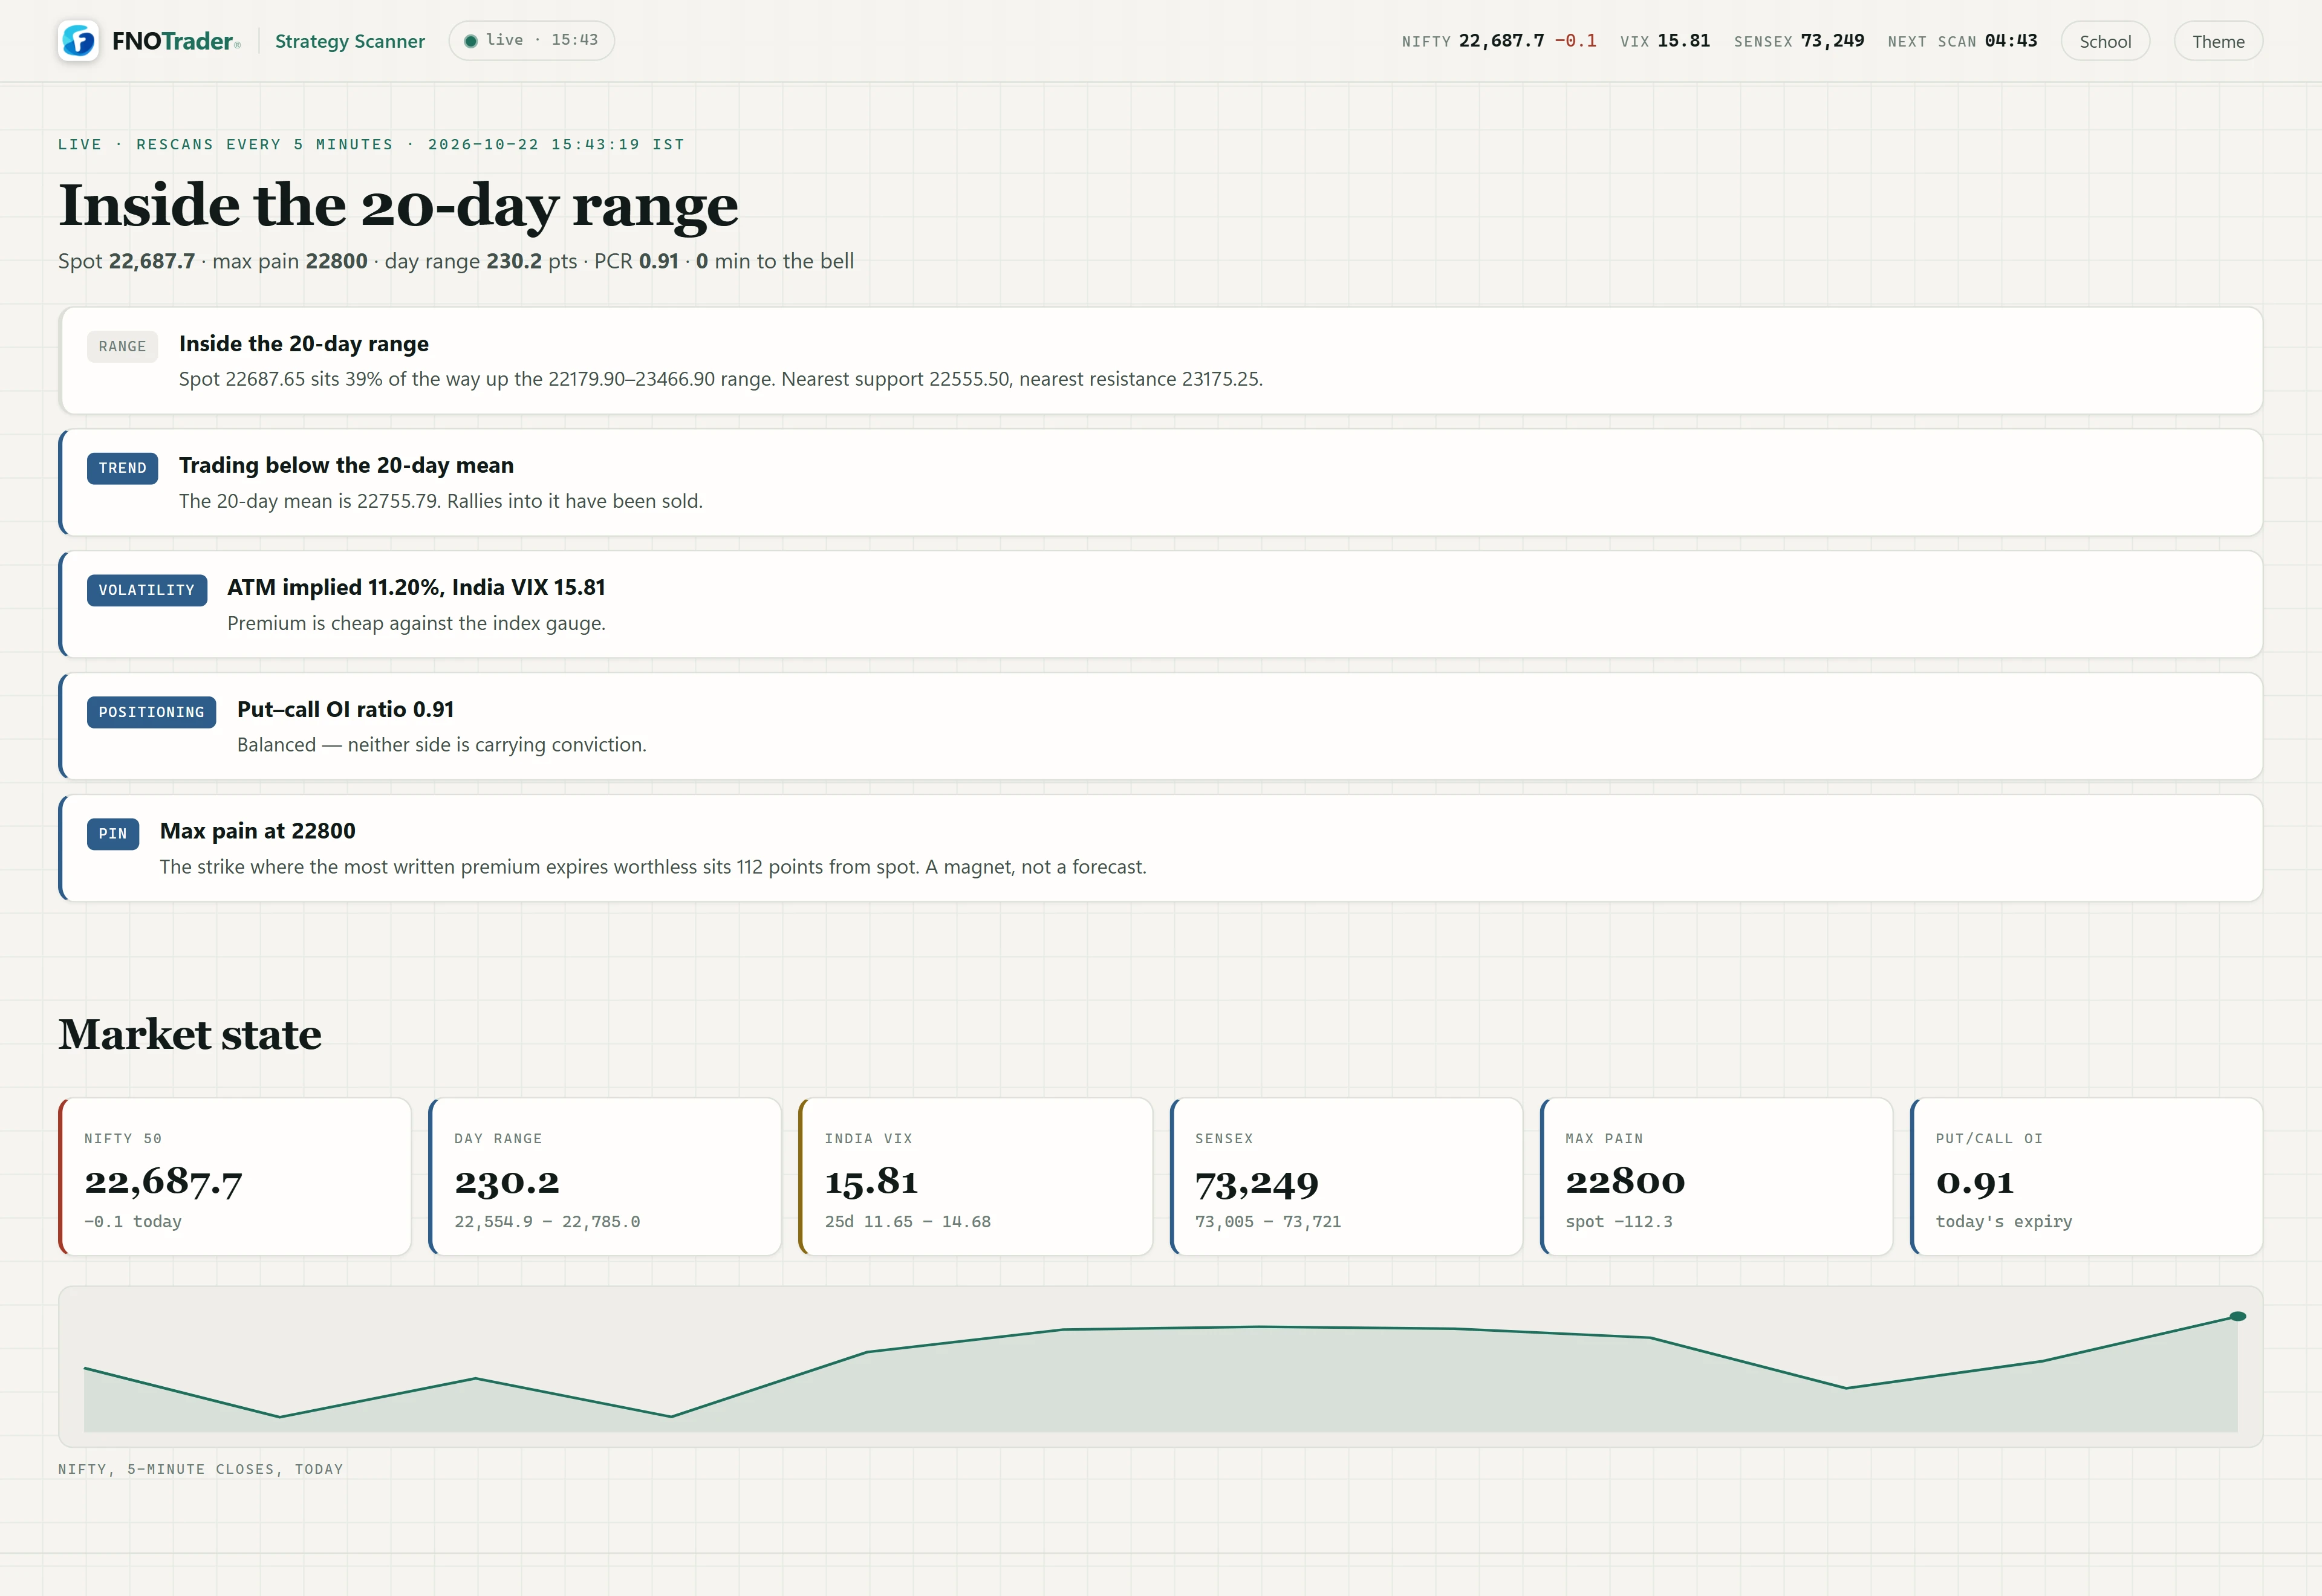
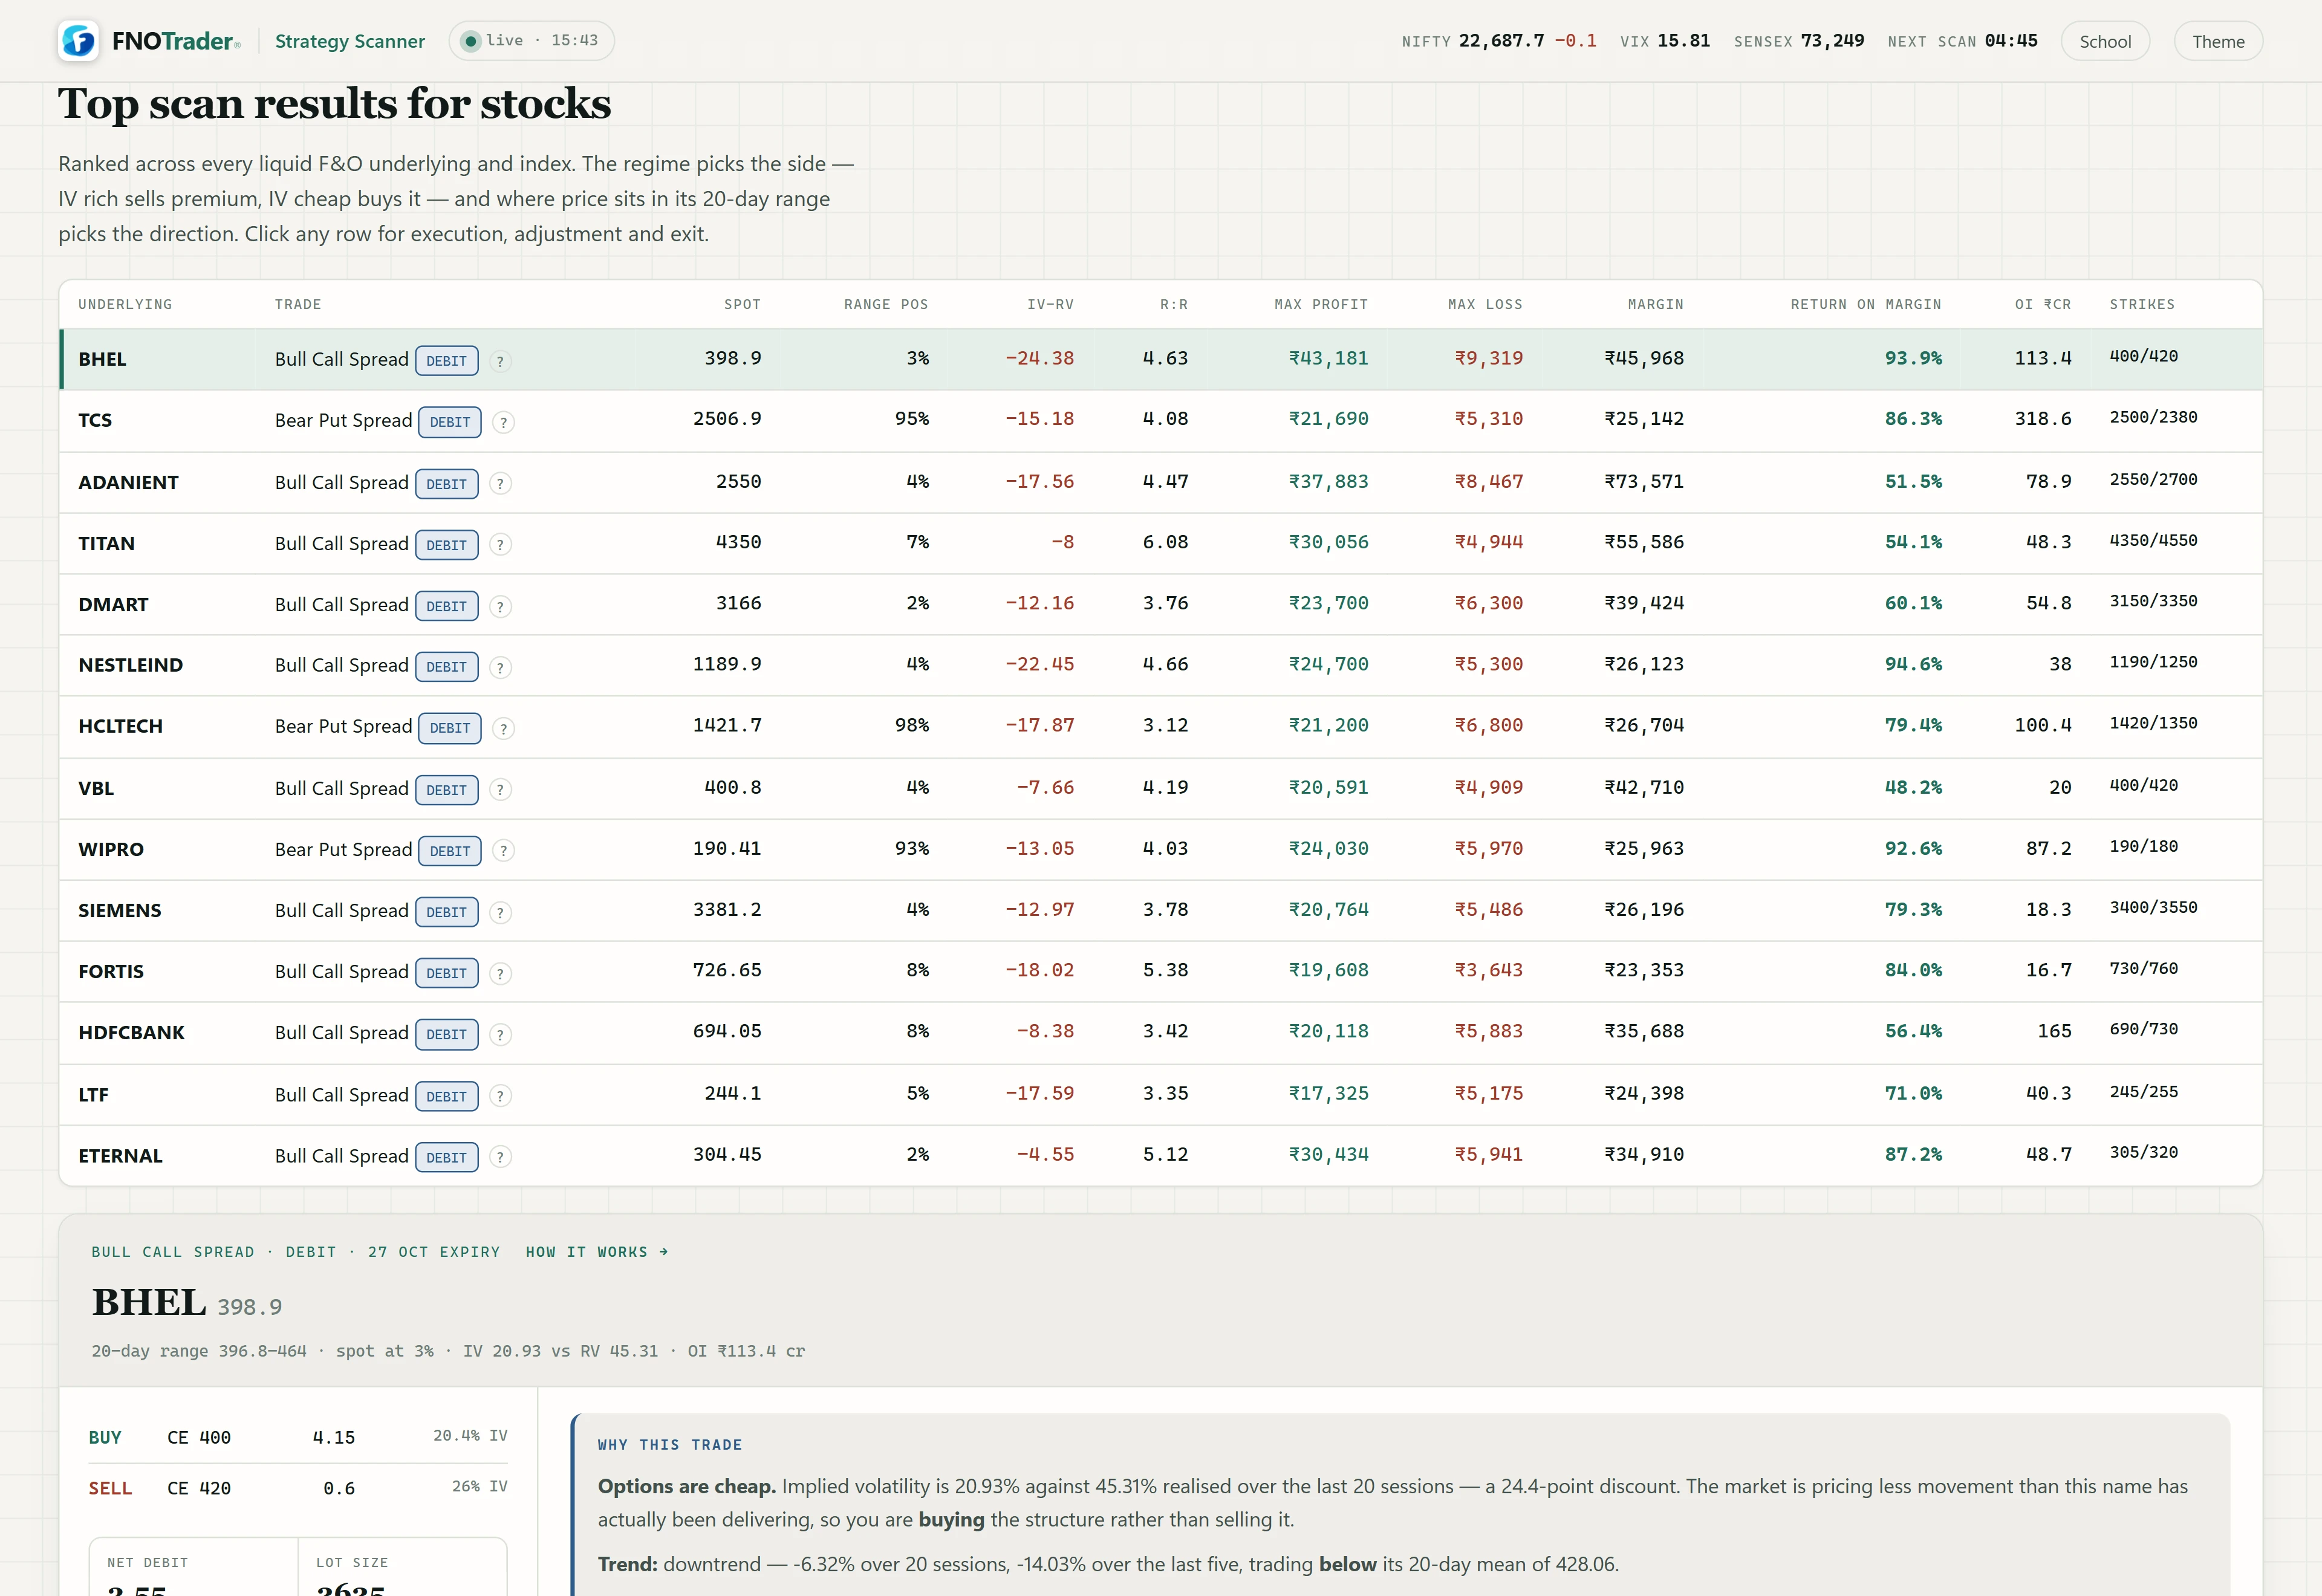
The page has two halves. The top is an index view for NIFTY or SENSEX: the market state, a headline of what matters now, the best structures for that index, the open interest ladder, key levels and three findings. The bottom is a stock table ranked across every liquid F&O underlying. The page re-reads the index state every five minutes, with a countdown in the top bar.
It is read-only. It does not know your positions and is not a recommendation.
How to read the index view
| Panel | How it is worked out |
|---|---|
| Range | The last 20 daily bars give major support and resistance (20-day low and high); the last 5 give nearer ones. If spot is outside the 20-day range, range structures are flagged as wrong. |
| Trend | Above or below the 20-day average close. |
| Volatility | At-the-money IV on the front expiry. On NIFTY it is called rich or cheap if it is more than a point above or below India VIX. |
| Positioning | Put-call OI ratio across strikes near spot; above 1.1 reads as heavier written support, below 0.9 as sellers leaning on the upside. |
| Pin | Max pain: the strike at which the most written premium expires worthless. A magnet, not a forecast. |
The Where the market is trapped ladder shows call OI on the left and put OI on the right for strikes near spot on the front expiry. The front expiry is read from the instrument list each time, so it never goes stale after an expiry passes.
How structures are found and ranked
Universe. Every F&O stock and index with enough option open interest: the value of open OI on its monthly expiry must exceed ₹12 crore. Legs are at-the-money or out-of-the-money, at most one strike in the money, because deep ITM strikes quote wide and do not fill.
Regime. Two numbers drive the choice. IV−RV is at-the-money implied volatility minus the last 20 sessions' realised volatility: positive means options are rich and premium-selling structures score higher; negative means they are cheap and buying structures score higher. Range position is where spot sits in its 20-day high–low: near the floor favours bullish structures, near the ceiling bearish, mid-range neutral.
Confidence is an explicit blend: 45% statistical (probability of profit at expiry, from a lognormal distribution at the structure's own IV, plus a bonus if expected value is positive), 35% regime fit and 20% liquidity. Penalties come off for uncapped risk, for an IV−RV gap so large it suggests bad data such as a corporate action, and for a very large maximum loss per lot. The index cards show it as a score out of 100.
Reading the stock table
| Column | Meaning |
|---|---|
| Trade | The structure, marked CREDIT or DEBIT, with a link to its Options School page |
| Range pos | Where spot sits in its 20-day range, 0% at the low, 100% at the high |
| IV−RV | Positive: options rich. Negative: options cheap |
| R:R | Maximum profit ÷ maximum loss |
| Margin | The basket's SPAN plus exposure margin where available; otherwise an estimate at the maximum loss |
| Return on margin | Maximum profit per lot ÷ margin |
| OI ₹cr | Value of open interest, the liquidity measure |
Rows are ranked by a score built from regime fit, R:R (capped, so a far-out lottery ticket cannot top the table), liquidity, and a deduction for uncapped risk. Rows with an IV−RV gap beyond 25 points, or an R:R of 8 or more, are left out.
Click a row for the full case: the legs with last-traded price and IV, net credit or debit, break-even, a Why this trade paragraph written from that stock's own numbers, and the same Execute, Stop, Adjustment and Profit-exit rules as the strategy pages. Each index card also has a Builder link that opens the structure in the Options strategy builder.
Stock options are physically settled: an assigned short leg means delivery of the full lot. The page says so on every stock trade, and prefers debit or defined-risk spreads there.
A worked example
Hypothetical: a stock at ₹1,000 with a 20-day range of ₹960–₹1,100. Range position is (1,000 − 960) ÷ (1,100 − 960) = 29%, near the floor. At-the-money IV is 24% and 20-day realised volatility 19%, so IV−RV is +5: options are rich.
Rich premium near support is the textbook case for a bull put spread below the 20-day low. Suppose the scan offers 960/940 for a 6-point credit. Maximum loss is 20 − 6 = 14, so R:R is 6 ÷ 14 = 0.43, and break-even is 960 − 6 = 954. If margin is about the maximum loss, return on margin is 6 ÷ 14 ≈ 43%.
That 43% is the best case, earned only if the stock stays above 960 to expiry. Whether that is likely is a different question, which is why the probability of profit carries the largest weight in the confidence score and why the row's Why this trade spells out the range, trend and volatility behind it.
Limits and common mistakes
- Marks are last-traded. Re-price every leg before acting; a scan can be minutes old.
- Probability of profit is a model. It assumes a lognormal move at today's IV. Real markets gap, and fat tails are exactly what short premium loses on.
- A high R:R is not a better trade. Far-out debit structures have big R:R and low probability. Read the R:R together with the range position and IV−RV, not on its own.
- The scanner does not know you. Your existing positions, capital and margin are not in it.
For the volatility side in more depth, see the Vol Lab strategy finder in Volatility Analytics.
Where to find it
- Open learn.fnotrader.com and choose Scanner in the top bar.
- Pick NIFTY or SENSEX for the index view, and read the headline and key levels first.
- Scroll to the stock table, click a row, and read Why this trade and the four rules.
- Open the structure's Options School page with the “how it works” link if it is new to you, and see the strategy finder for the rest of the set.
Educational and analytical only; not investment advice.
Common questions
What does IV−RV mean on the scanner?
At-the-money implied volatility minus the last 20 sessions' realised volatility. Positive means options are pricing more movement than the stock has delivered (rich); negative means less (cheap).
How is the confidence score calculated?
45% statistical edge (probability of profit and the sign of expected value), 35% fit to the current regime and 20% liquidity, minus penalties for uncapped risk, suspect volatility data and very large tickets.
Which stocks does the scanner cover?
Every F&O stock and index whose open option interest on the monthly expiry is worth more than ₹12 crore, plus NIFTY and SENSEX in the index view.
How often does the scanner update?
The page re-reads the NIFTY and SENSEX state every five minutes and shows a countdown. Check the scan time before using any number.
Is the scanner a trade recommendation?
No. It applies published rules to market data and does not know your positions or circumstances. Re-price every leg and decide for yourself.
More on Options School
More in Options School · App: Options School · Definitions: glossary · All: every article