Nine screeners
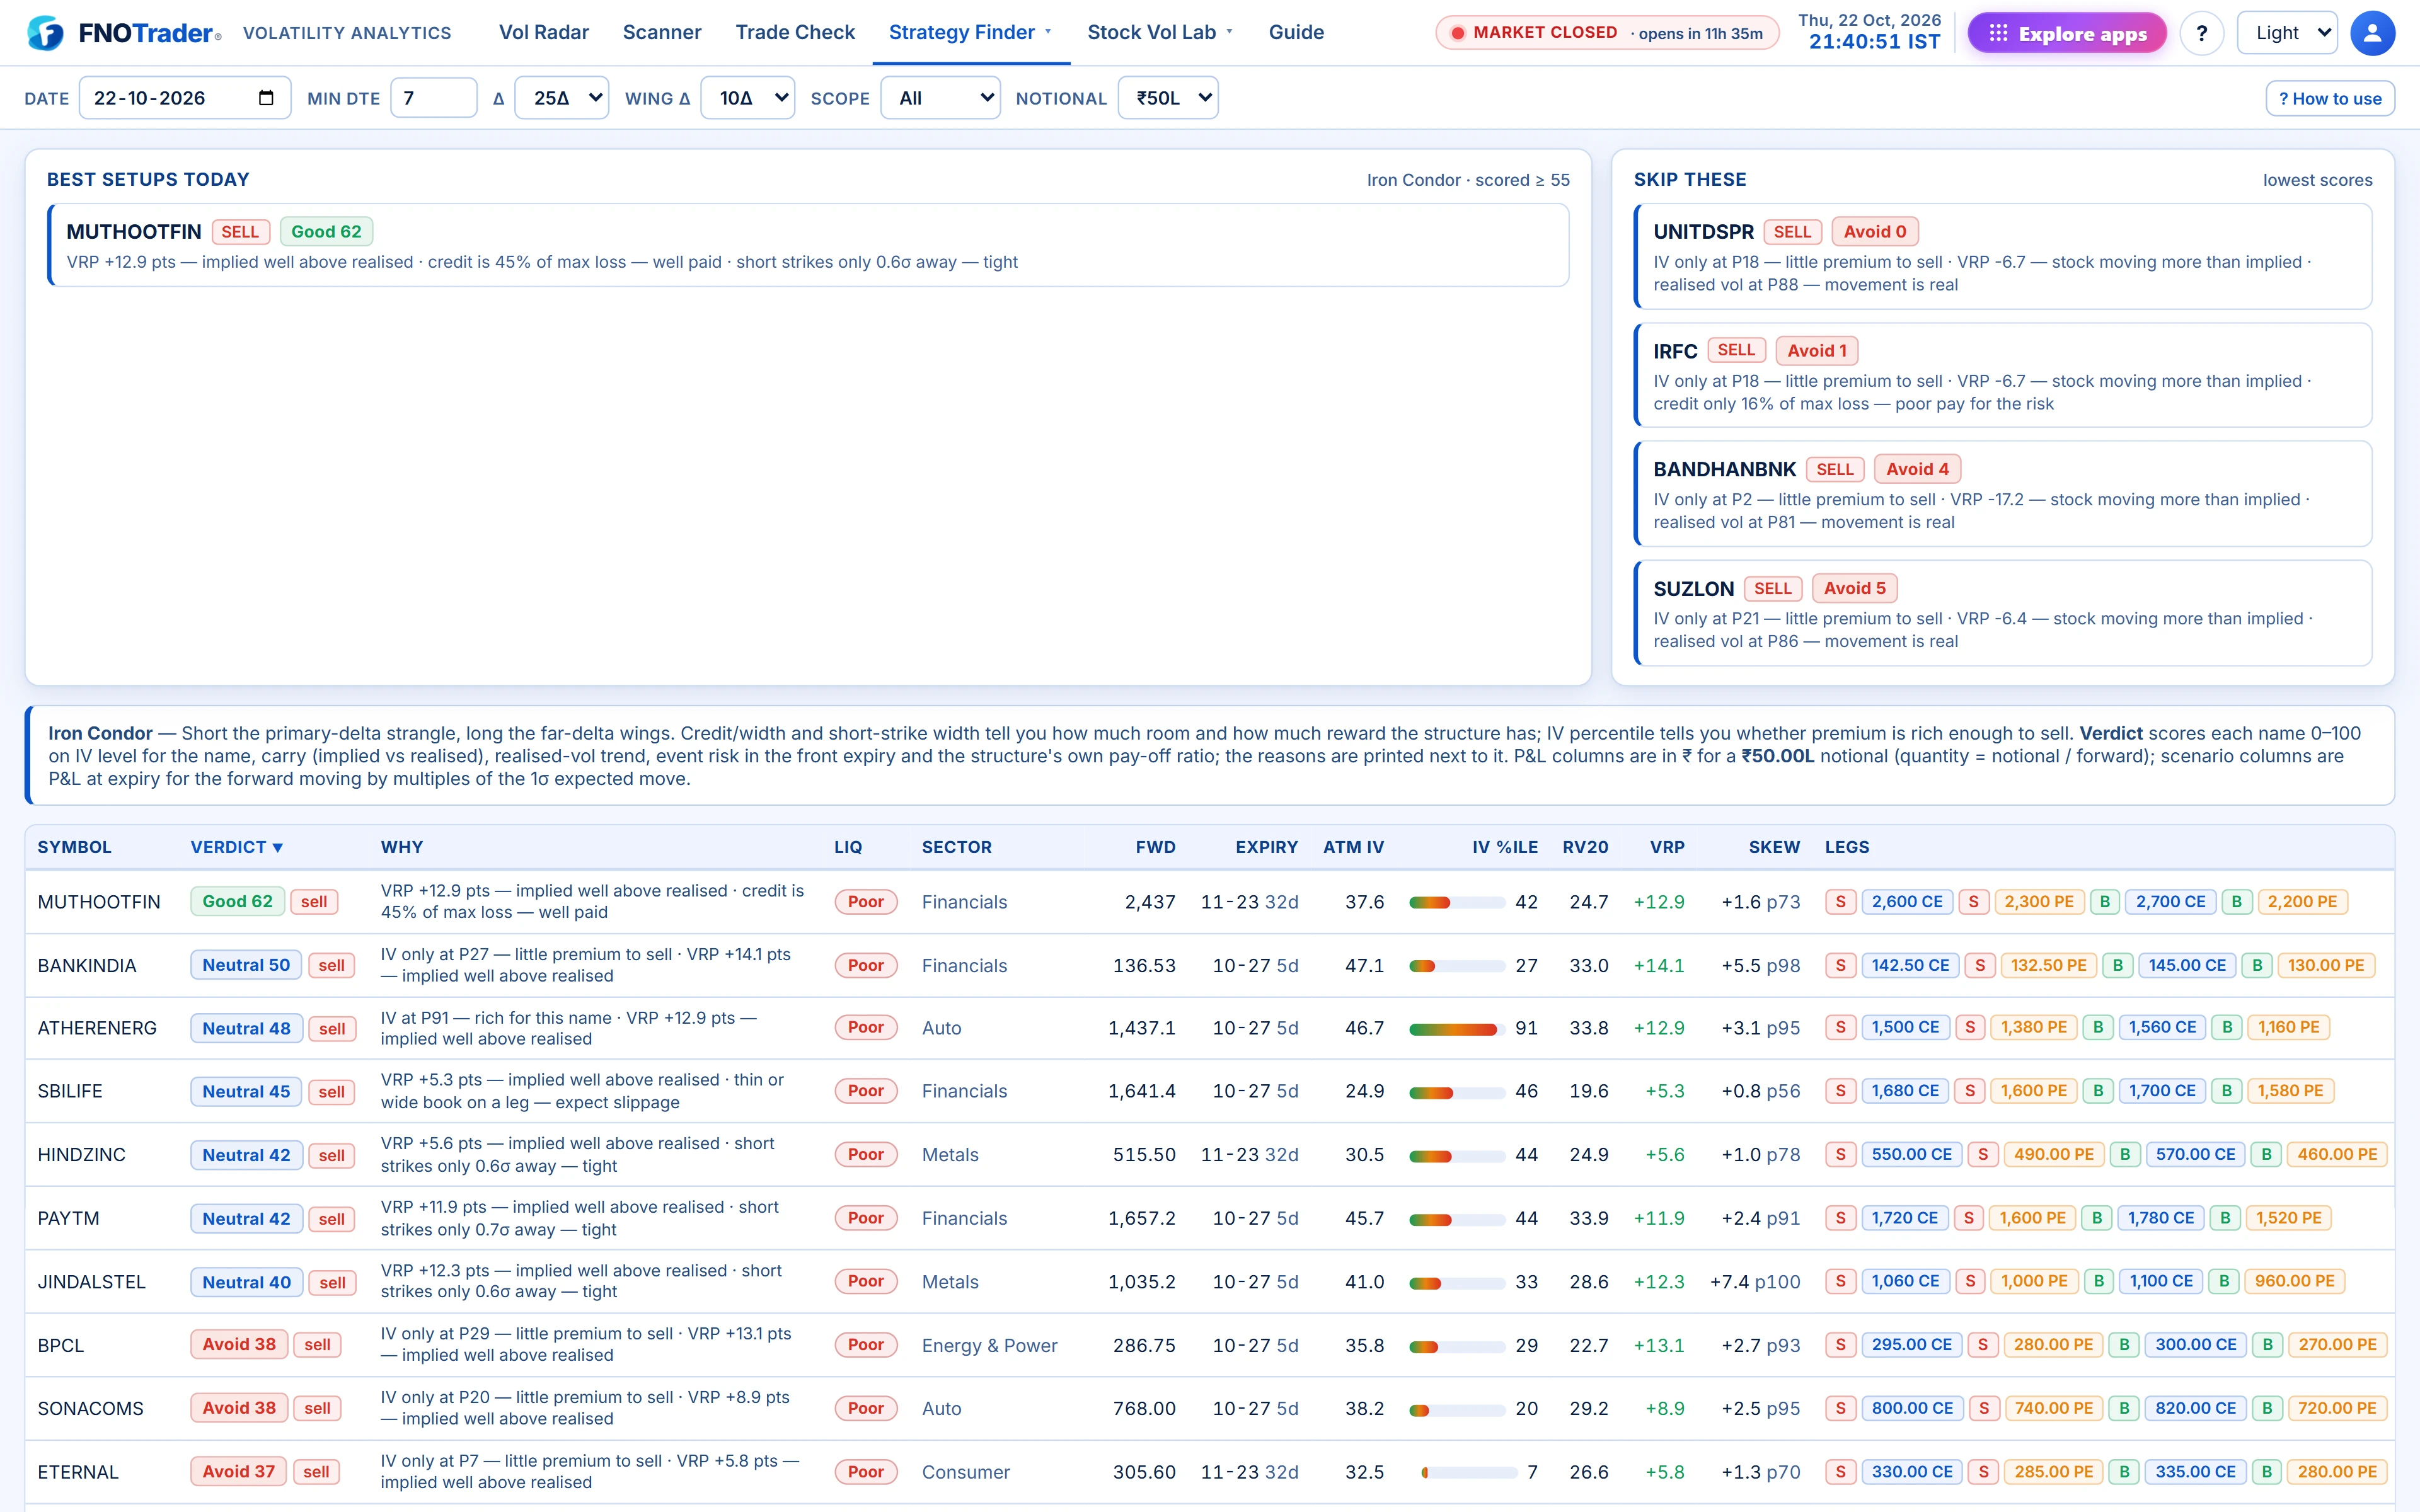
Each screener builds one structure on every name: ATM Straddle, Strangle, Long Call, Long Put, Vertical Spreads, Call Backspread, Put Backspread, Iron Butterfly and Iron Condor.
Vertical Spreads yields up to four rows per name: Bull Call and Bear Put debit spreads (buy ATM, sell the Δ strike) and Bull Put and Bear Call credit spreads (sell the Δ strike, buy the wing Δ strike). Backspreads sell one ATM option and buy two at the Δ strike. The straddle and strangle screens show the long structure; their verdict says whether premium looks rich (sell) or cheap (buy).
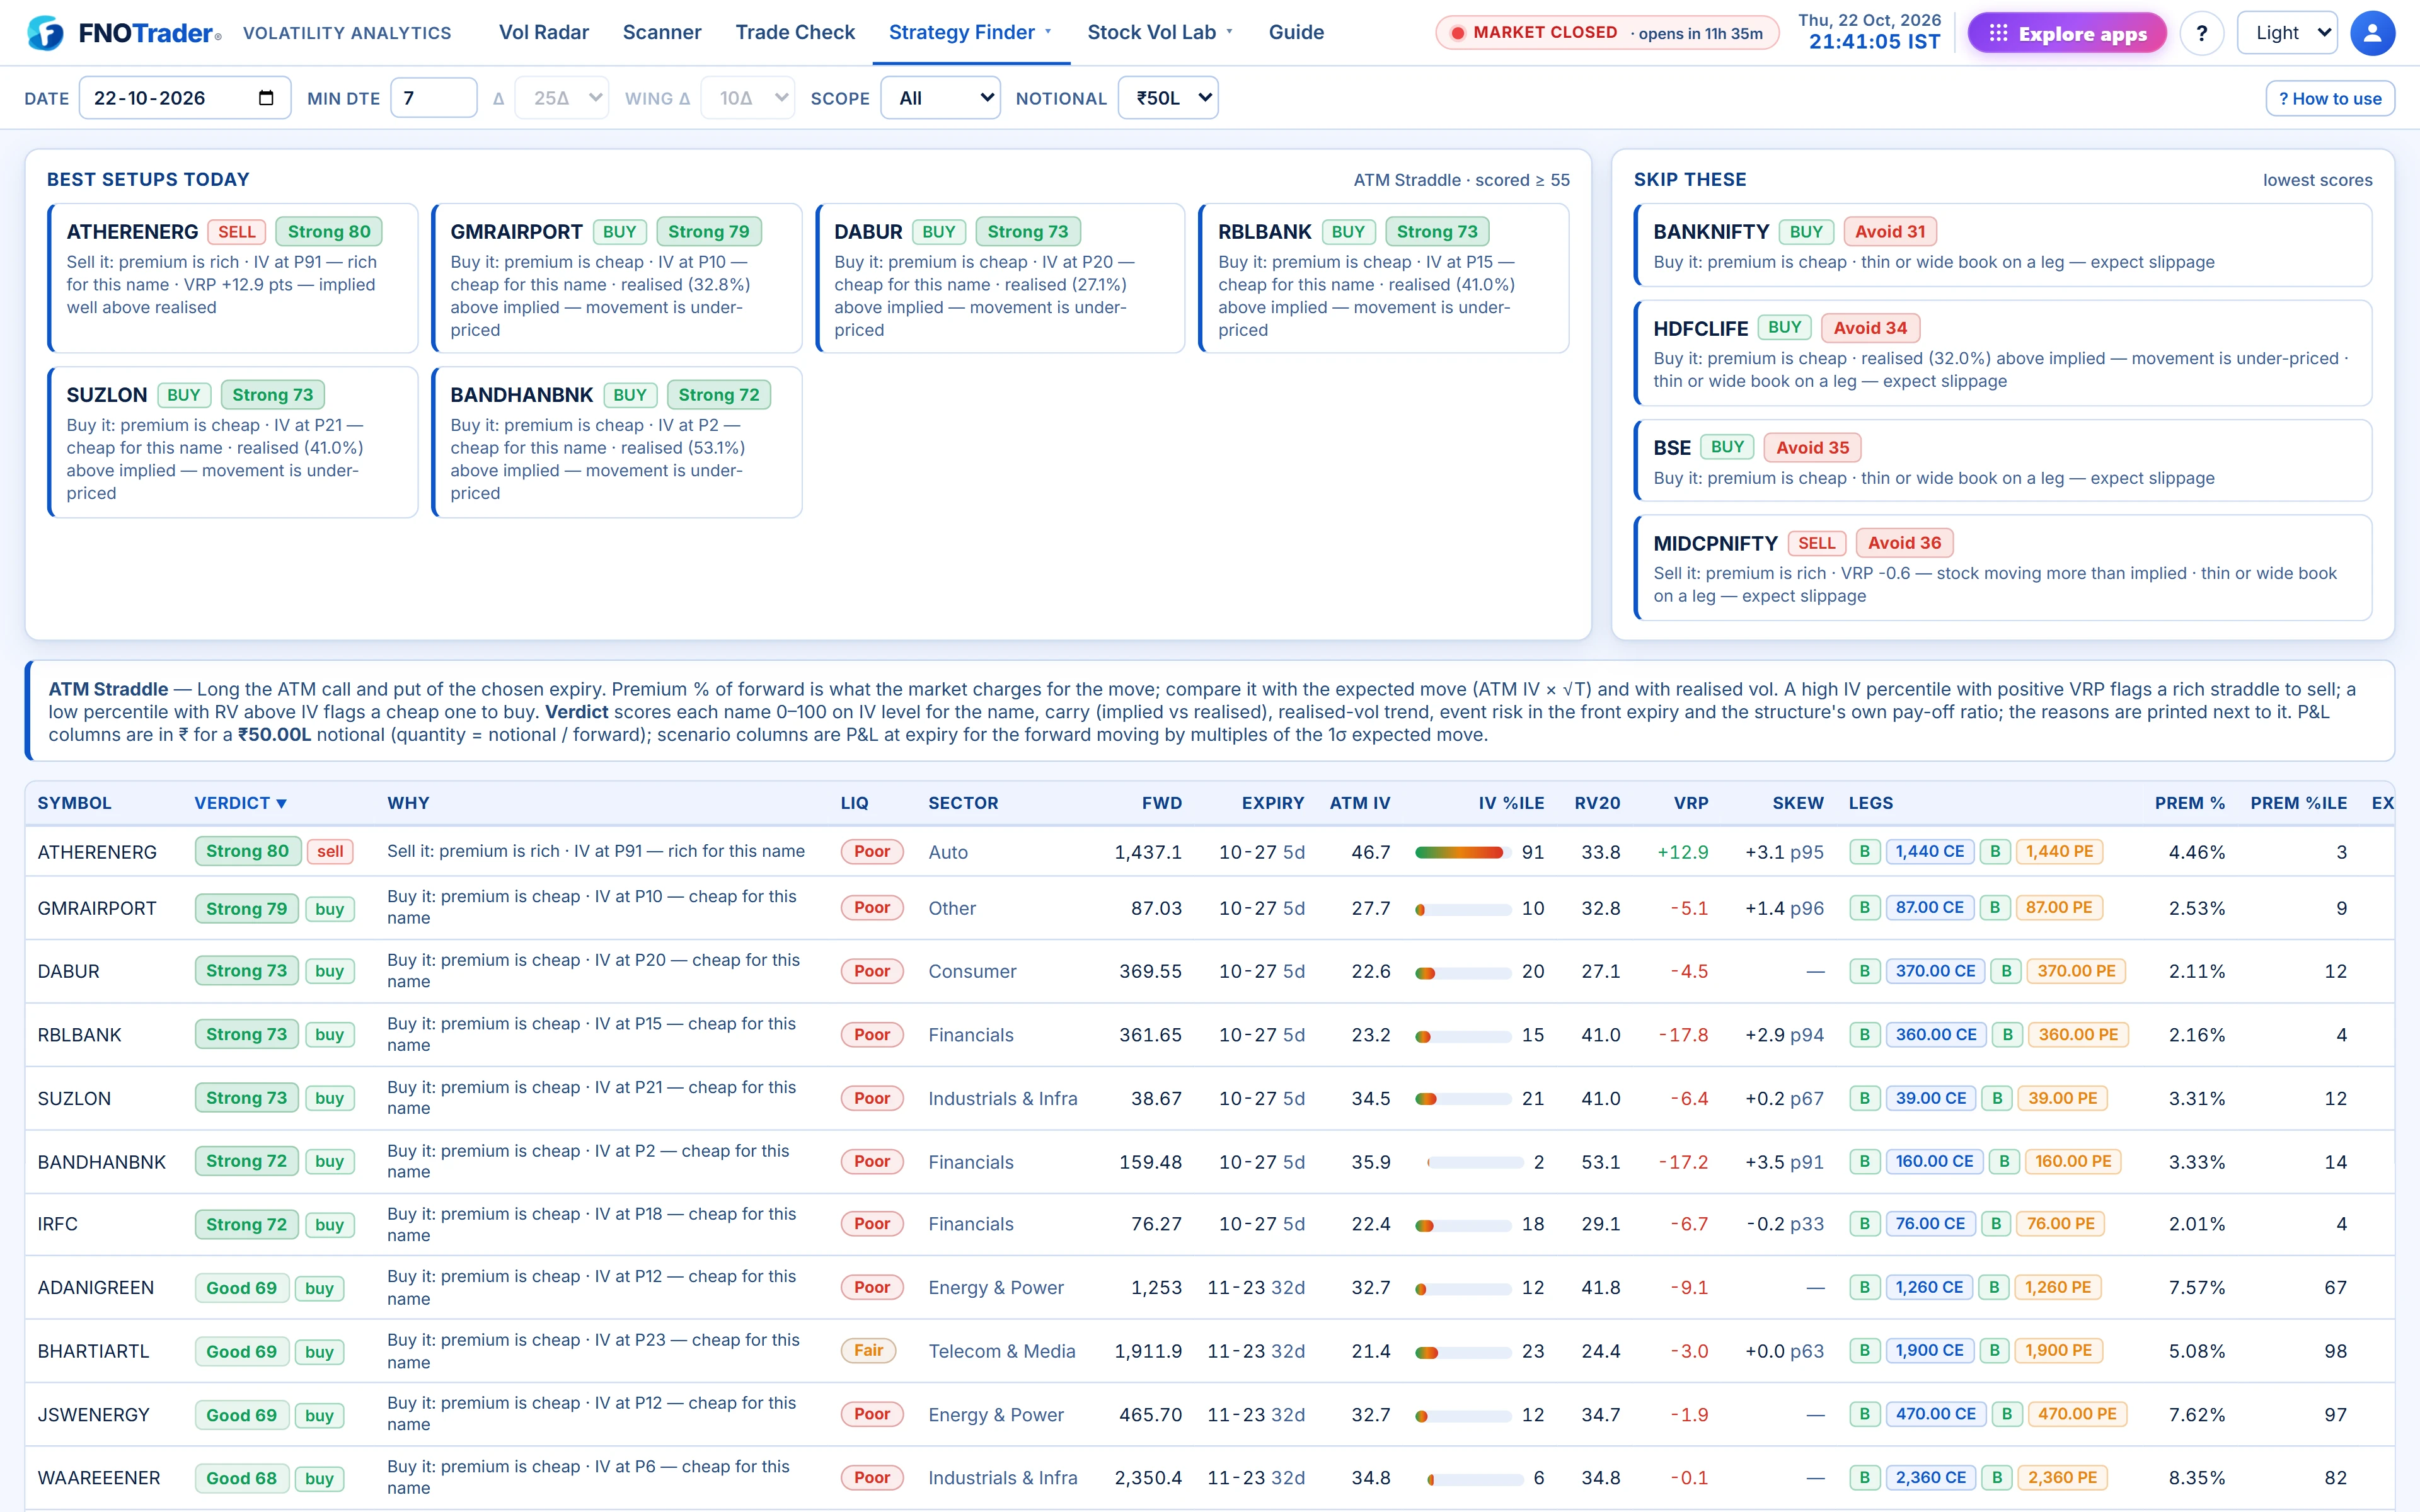
The controls
| Control | What it changes |
|---|---|
| Min DTE (default 7) | Uses the nearest expiry with at least this many days left. 7 skips the expiring week; 20–30 lands in the monthly. |
| Δ (40Δ to 10Δ, default 25Δ) | Strike of the main OTM leg: strangle and condor shorts, the long call or put, the sold leg of a debit vertical, backspread and butterfly wings. |
| Wing Δ (20Δ to 5Δ, default 10Δ) | The far protective leg of credit verticals and condors. Must sit further out than Δ. Greyed out where unused. |
| Scope | All, indices only, stocks only. |
| Notional (₹10L to ₹5Cr, default ₹50L) | Quantity = notional ÷ forward, so every rupee column is comparable across names. |
How the score works
Each row gets a 0–100 score and a verdict: Strong (70+), Good (55–69), Neutral (40–54), Avoid (under 40), with two to four plain-language reasons.
Selling structures start from a seller score: IV percentile (40% weight), carry from VRP (30%), realised vol not elevated (15%) and no event in the front (15%). Buying structures use the mirror: low IV percentile, low or negative VRP, short-term realised vol accelerating, and compressed realised vol. Each structure then blends in its own ratio — credit ÷ width for condors and butterflies, debit ÷ width for debit verticals, wing IV vs ATM for backspreads and long options.
Two guards: a selling row cannot score above 60 when IV percentile is 30 or less, and a buying row cannot when IV percentile is 75 or more. And when any leg’s live book grades Poor on liquidity, the score drops 10 points with the reason “thin or wide book on a leg — expect slippage”.
The σ columns
The −2σ … +2σ columns are P&L at expiry if the forward moves that many expected moves, with 1σ = forward × ATM IV × √T. Example: forward 24,000, ATM IV 13%, 9 days. √(9/365) ≈ 0.157, so 1σ ≈ 24,000 × 0.13 × 0.157 ≈ 490 points.
A structure that only makes money inside ±0.5σ is a vol-selling trade; one that only makes money outside ±1σ is a vol-buying trade. Other columns: legs, net premium, max profit and loss, breakevens, and delta, vega and theta in rupees at the chosen notional.
A worked example
A hypothetical iron condor row: IV %ile 70, VRP +4, RV20 percentile 40, slope −0.5.
- Seller score: 40 × 0.70 = 28; carry 30 × (4 + 2) ÷ 10 = 18; realised 15 × 0.60 = 9; term about 12.5. Total ≈ 67.5.
- Condor blend: 67.5 × 0.7 ≈ 47.3, plus credit ÷ width 0.30 → 30 × 0.5 = 15. Now ≈ 62.3.
- Short strikes 1.2σ away: +5 → 67, Good.
- If a leg’s book is Poor: 57, still Good but flagged.
Quantity at ₹50L on a 2,500 forward is 2,000 units; with a hypothetical lot of 500 that is four lots. Click the row for the read in lots, then “Open in Trade Check”.
Limits
- Scenario columns assume trading at the sampled price; the liquidity chip tells you how far that is from reality.
- A name drops out when the chosen delta has no usable strike, so thin chains appear less often at far deltas.
- The score ranks; it does not forecast. A Strong row can lose.
Where to find it
- Open Volatility Analytics › Strategy Finder and pick a structure.
- Set Min DTE, Δ, Wing Δ, Scope and Notional in the top bar.
- Sort by score or any column; click a row to read it and open it in Trade Check.
Common questions
What does Min DTE do in Strategy Finder?
It picks the nearest expiry with at least that many days left. The default of 7 skips the expiring week.
How is the expected move (1 sigma) calculated?
Forward times ATM IV times the square root of time to expiry in years. The scenario columns show P&L at expiry for moves of -2 to +2 of these.
What do Strong, Good, Neutral and Avoid mean?
Score bands of 70 and above, 55 to 69, 40 to 54 and under 40, from IV level, carry, realised vol, term structure and the structure's own payout ratio.
Why did a row lose 10 points?
At least one leg's live order book graded Poor on depth, spread or activity, so the score is cut and the row says to expect slippage.
Why compare by notional instead of lots?
Lot sizes differ, so rupee P&L per lot is not comparable. A fixed notional gives every name the same exposure.
More on Volatility Analytics
More in Volatility Analytics · App: Volatility Analytics · Definitions: glossary · All: every article