What the tools page is for
Every tool on the page answers one of three questions: how much to risk on a trade, whether the system is worth trading at all, and what the bad stretches will look like.
The page has three tabs: the Game Plan Tool, North Star Guidance, and Tools & Calculators, which holds seventeen single-purpose calculators. Inputs are in points and lots, with a NIFTY lot size of 65 as the default, so the results come out in rupees per lot. Everything runs in your browser; nothing you type is uploaded.
Position sizing: fixed fractional and Kelly
Fixed fractional sizing is the rule most professionals use: risk a fixed slice of capital on every trade.
Risk amount = capital × risk % and
lots = risk amount ÷ (stop-loss points × lot size), rounded down to whole
lots.
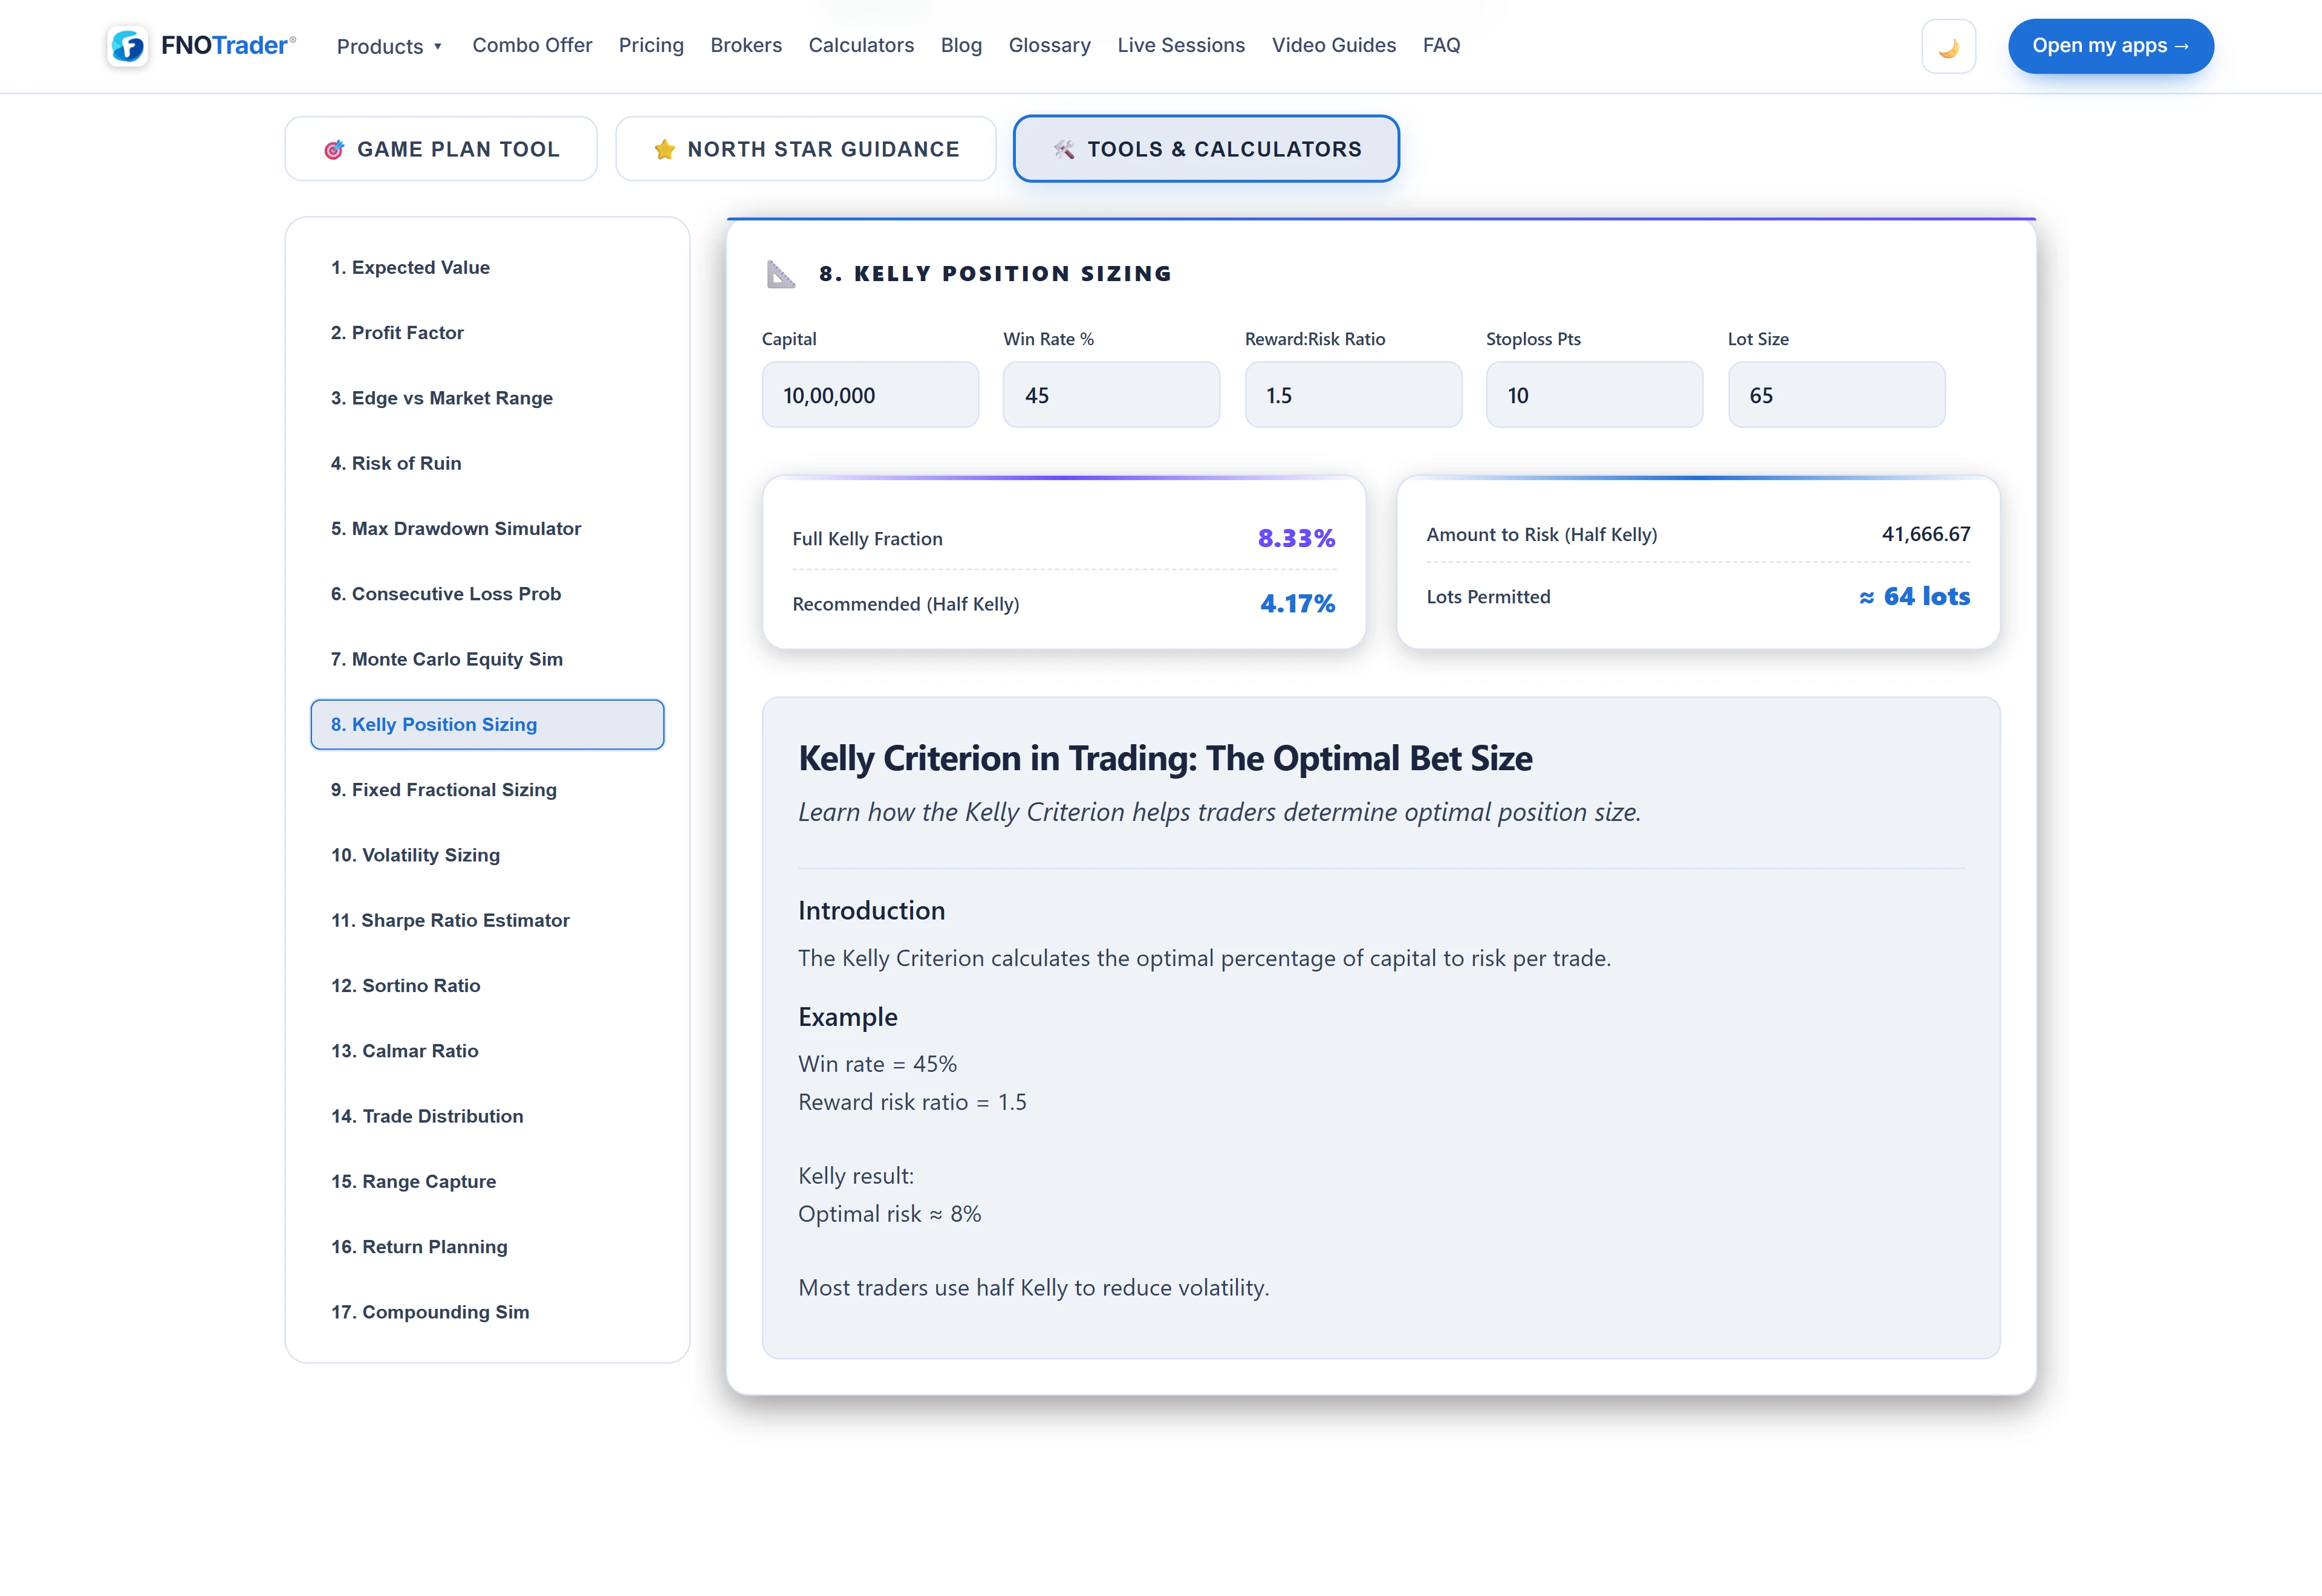
Kelly gives the fraction of capital that maximises long-run growth for a
known edge: f = (b × p − q) ÷ b, where p is the win rate,
q = 1 − p, and b is the reward-to-risk ratio. The calculator
shows full Kelly and half Kelly, and sizes lots from the half. A negative result means there is
no edge and the correct size is zero.
The volatility sizing tool scales a base size by reference volatility ÷ current volatility, so you trade smaller when the market is moving more.
Expected value and the losing streak
Expected value is what one trade is worth on average:
EV = (win rate × average win) − (loss rate × average loss), in points,
then multiplied by lot size and lots for rupees. A high win rate with a negative EV still loses
money.
The consecutive loss tool estimates the longest losing streak to expect over
a year: ln(trades per year) ÷ ln(1 ÷ (1 − win rate)). Knowing that
number in advance is what stops a normal streak from looking like a broken system.
Profit factor (gross profit ÷ gross loss), Sharpe, Sortino and Calmar ratios, a trade distribution analyser for a list of results, range capture and compounding complete the set.
Risk of ruin, drawdown and Monte Carlo
These three are simulations: they draw random wins and losses at your win rate and watch what happens to the account.
| Tool | What it simulates |
|---|---|
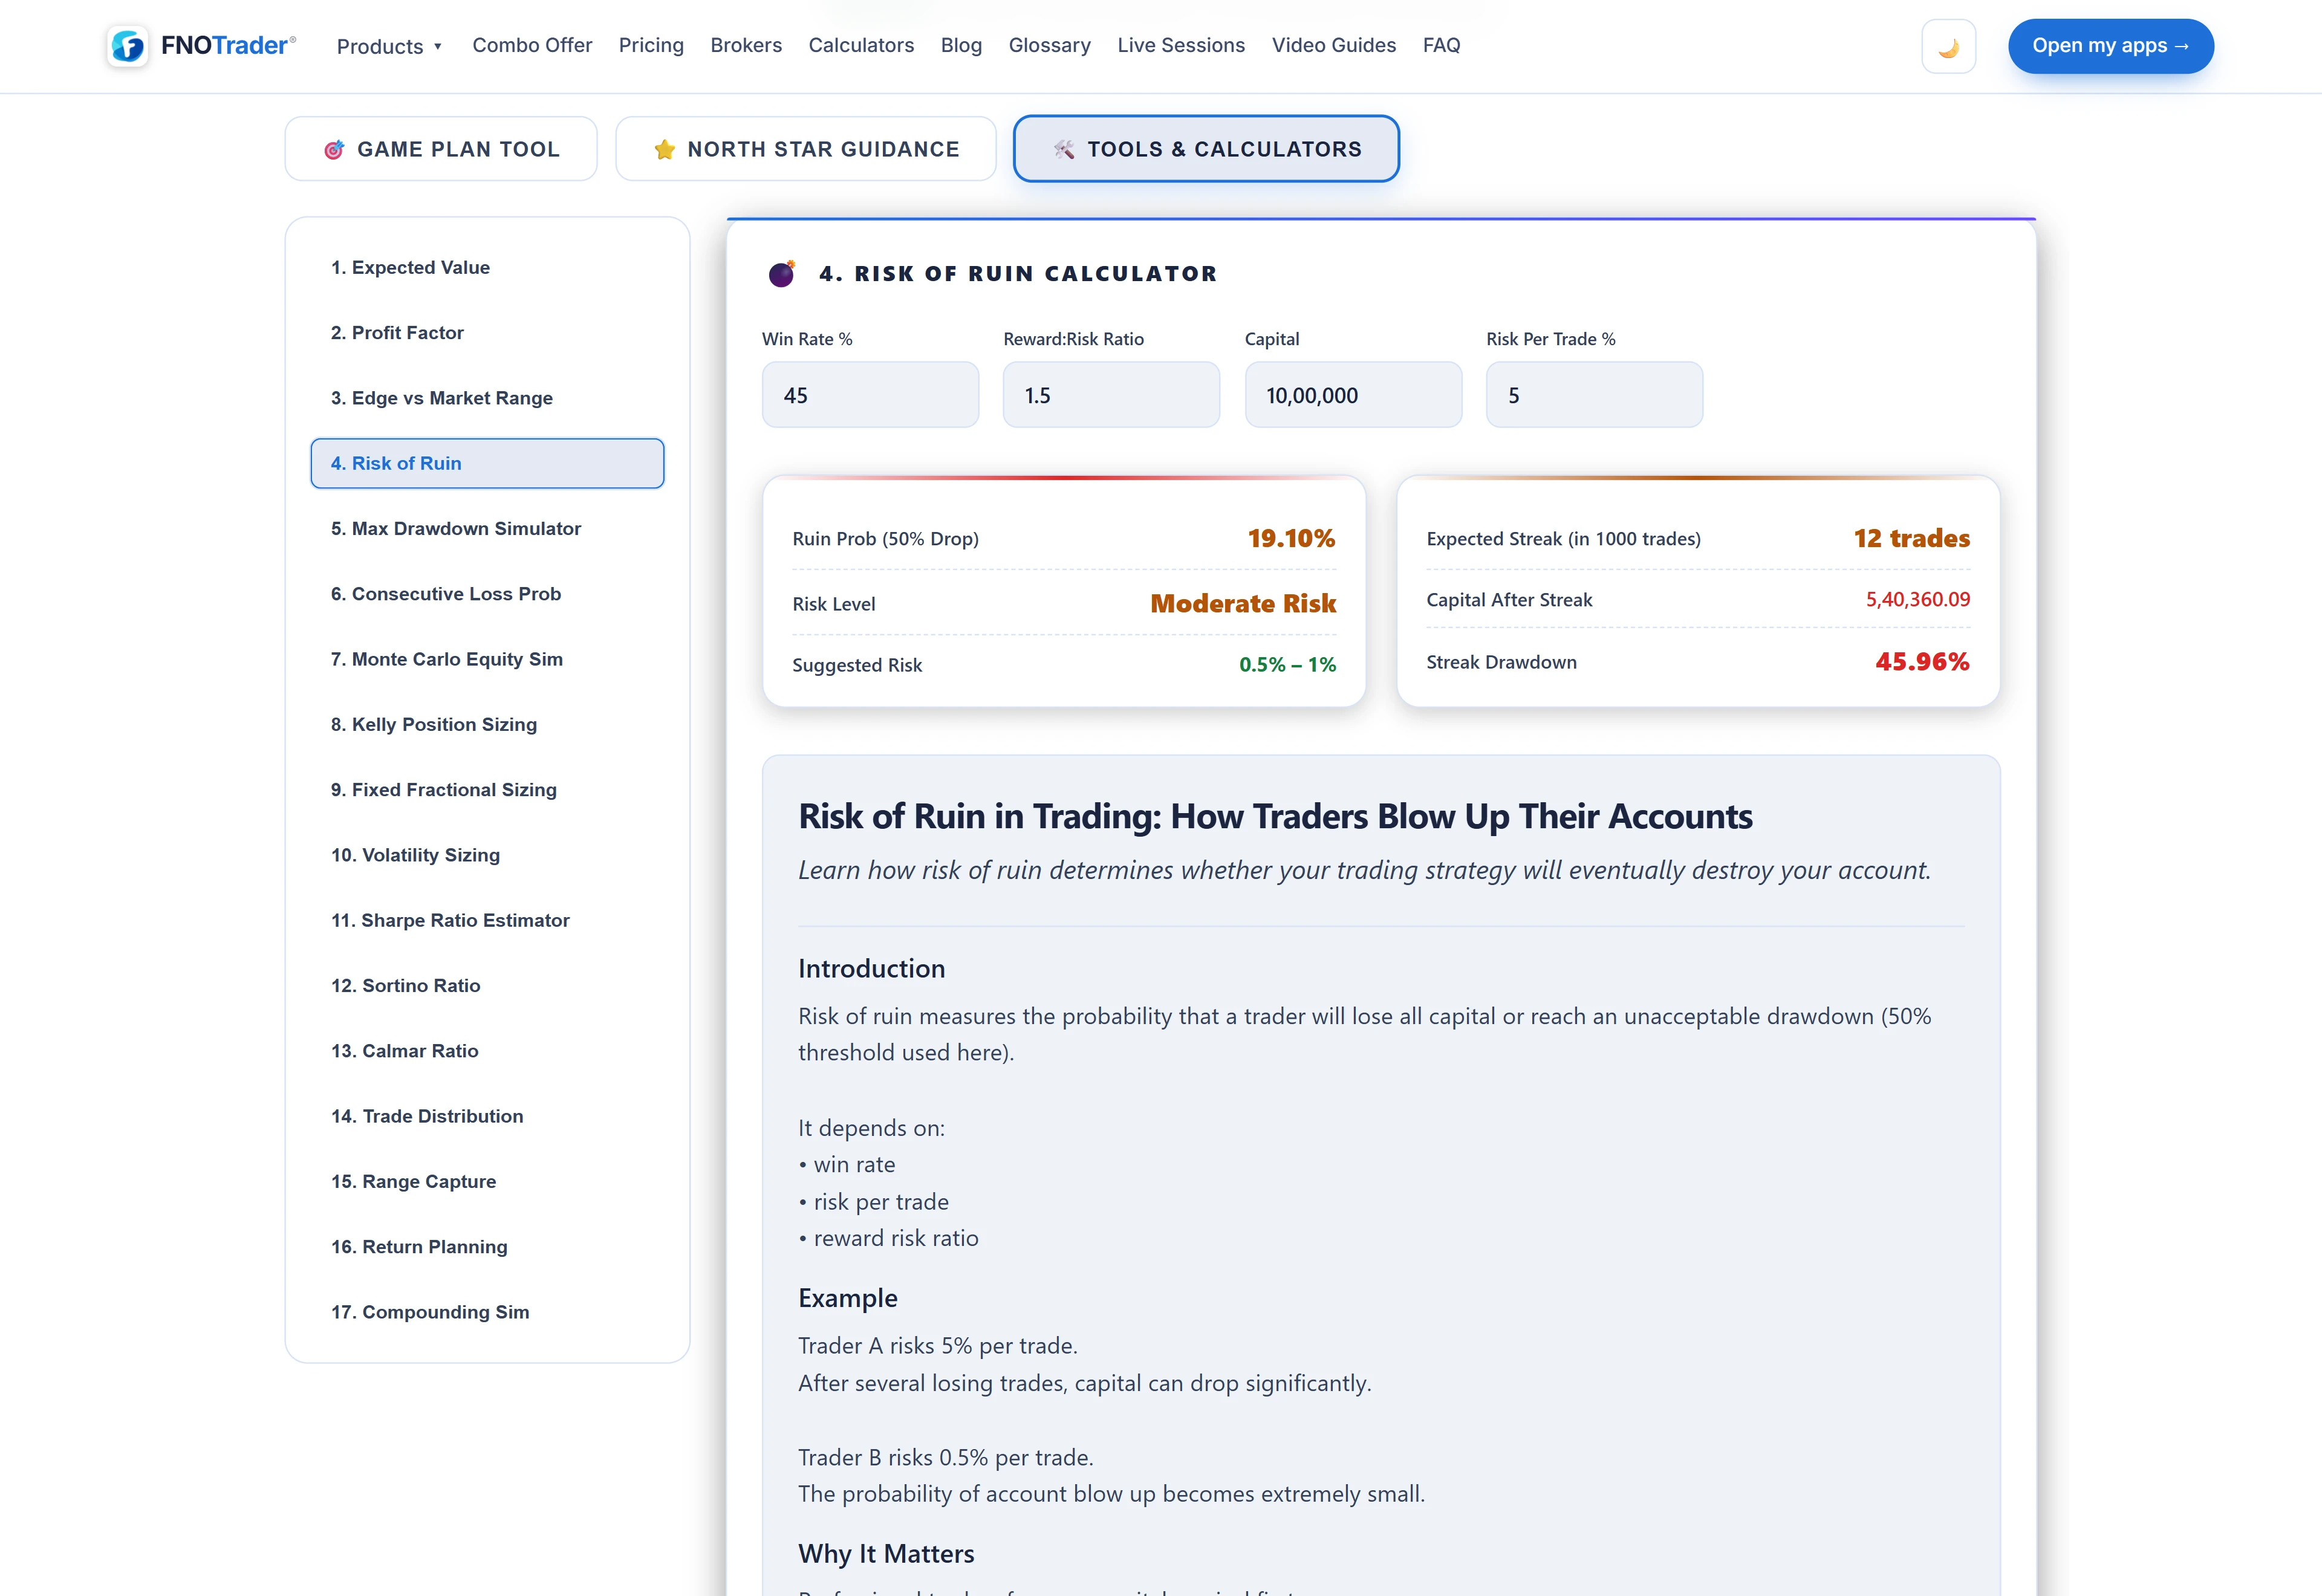
| Risk of ruin | 5,000 paths of up to 1,000 trades, each risking your percentage of current equity. A path is “ruined” if equity falls below half the starting capital. The share of ruined paths is the result, with a risk level label. |
| Max drawdown simulator | One path of 1,000 trades at a fixed rupee win and loss, tracking the deepest fall from a peak. It also shows a rough average drawdown and recovery time as rules of thumb, not simulated figures. |
| Monte Carlo equity | 100 paths of one year's trades, reporting the average ending equity and the best and worst paths. |
Because they are random, results move a little each time an input changes. Read the size of the number, not its second decimal.
A worked example
Hypothetical: ₹10 lakh capital, NIFTY lot 65, a 10-point stop, 45% win rate, average win 15 points, average loss 10 points.
- Fixed fractional at 0.5%: risk ₹5,000. One lot loses 10 × 65 = ₹650 at the stop, so 5,000 ÷ 650 = 7.7, rounded down to 7 lots.
- Expected value: 0.45 × 15 − 0.55 × 10 = 1.25 points a trade, or ₹81 per lot.
- Kelly with a reward-to-risk of 1.5: (1.5 × 0.45 − 0.55) ÷ 1.5 = 8.3%. Half Kelly is 4.2%, about ₹41,700 at risk, which the tool turns into 64 lots.
- Losing streak at 3 trades a day for 250 days: ln(750) ÷ ln(1 ÷ 0.55) ≈ 11 losses in a row.
The lesson is in the gap between 7 lots and 64. Kelly is only as good as its inputs, and a win rate measured over a few dozen trades is an estimate. An 11-trade streak at 64 lots is a very different afternoon from the same streak at 7.
The Game Plan and North Star tabs
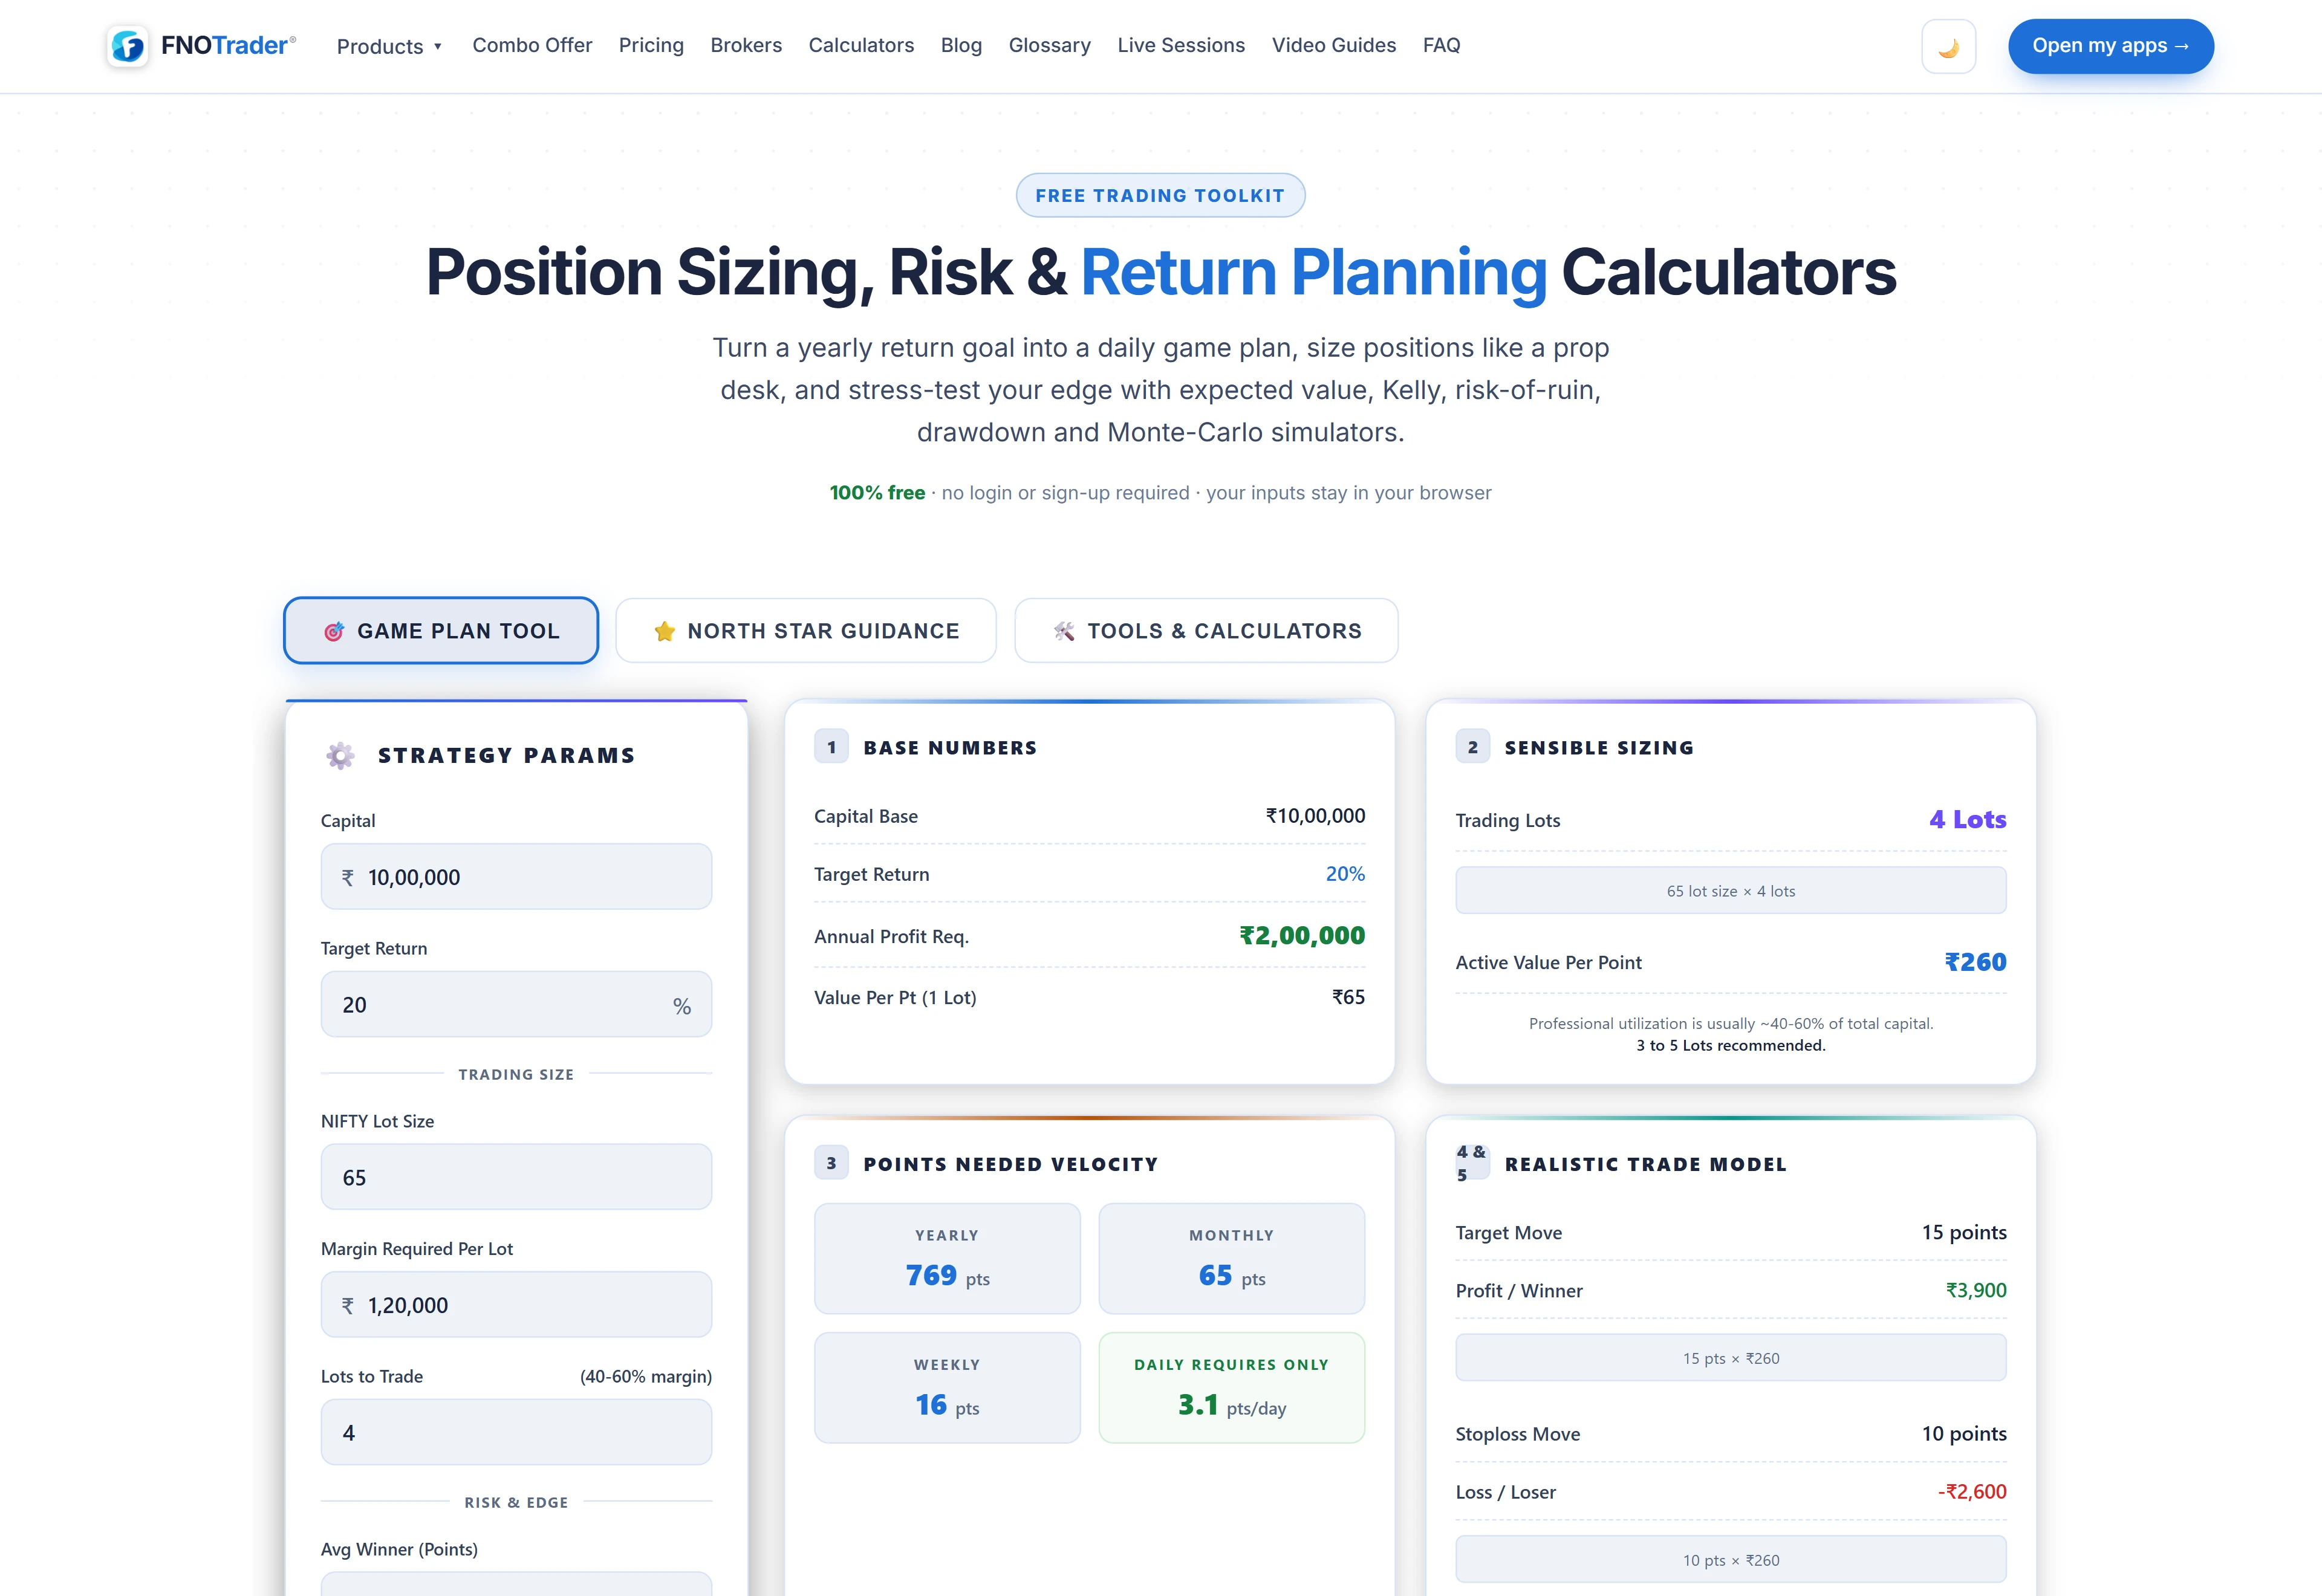
Game Plan works backwards from a yearly goal. Annual profit = capital × target return; divide by (lot size × lots) for the points needed in a year, then per month, week (÷ 50) and day (÷ 250). It adds the EV of your win rate and stop, the largest stop your risk percentage allows, the share of an assumed 150-point daily range you would need to capture, and a lot range that uses 40–60% of capital at your margin per lot.
North Star tracks that goal through the year. Enter the trading days elapsed and your P&L so far; it shows where you should be, whether you are ahead or behind in trading days, and the revised daily figure for the rest of the year. Your entries are kept in the browser.
Where to find it
- Open /tools. No login is needed.
- Pick a tab, or a calculator from the list in Tools & Calculators.
- Change the defaults to your own capital, lot size and stop; results update as you type.
For money questions outside trading, see the personal-finance calculators. To get a win rate and average win from real history rather than a guess, run a backtest in Algo & Backtest.
Common questions
How do I calculate position size for an F&O trade?
Risk amount = capital × risk %. Divide it by stop-loss points × lot size and round down. ₹10 lakh at 0.5% risk with a 10-point NIFTY stop (lot 65) is ₹5,000 ÷ ₹650 = 7 lots.
What is the Kelly criterion formula?
f = (b × p − q) ÷ b, where p is the win rate, q = 1 − p and b is reward-to-risk. At 45% and 1.5 it gives 8.3%. Most traders use half Kelly or less because p and b are estimates.
How is risk of ruin calculated here?
By simulation: 5,000 paths of up to 1,000 trades at your win rate, reward-to-risk and risk per trade. A path counts as ruined if equity falls below half the starting capital.
How long a losing streak should I expect?
Roughly ln(number of trades) ÷ ln(1 ÷ (1 − win rate)). At a 45% win rate over 750 trades that is about 11 losses in a row.
Are the trading calculators free?
Yes. They need no login and run in the browser; the values you enter are not uploaded.
More on Platform & setup
More in Platform & setup · App: Trading tools · Definitions: glossary · All: every article