What the FT Rating is, and the question it answers
The FT Rating answers one narrow question: compared with the other funds in its own category, how well has this fund rewarded investors over three and five years, allowing for how bumpy the ride was?
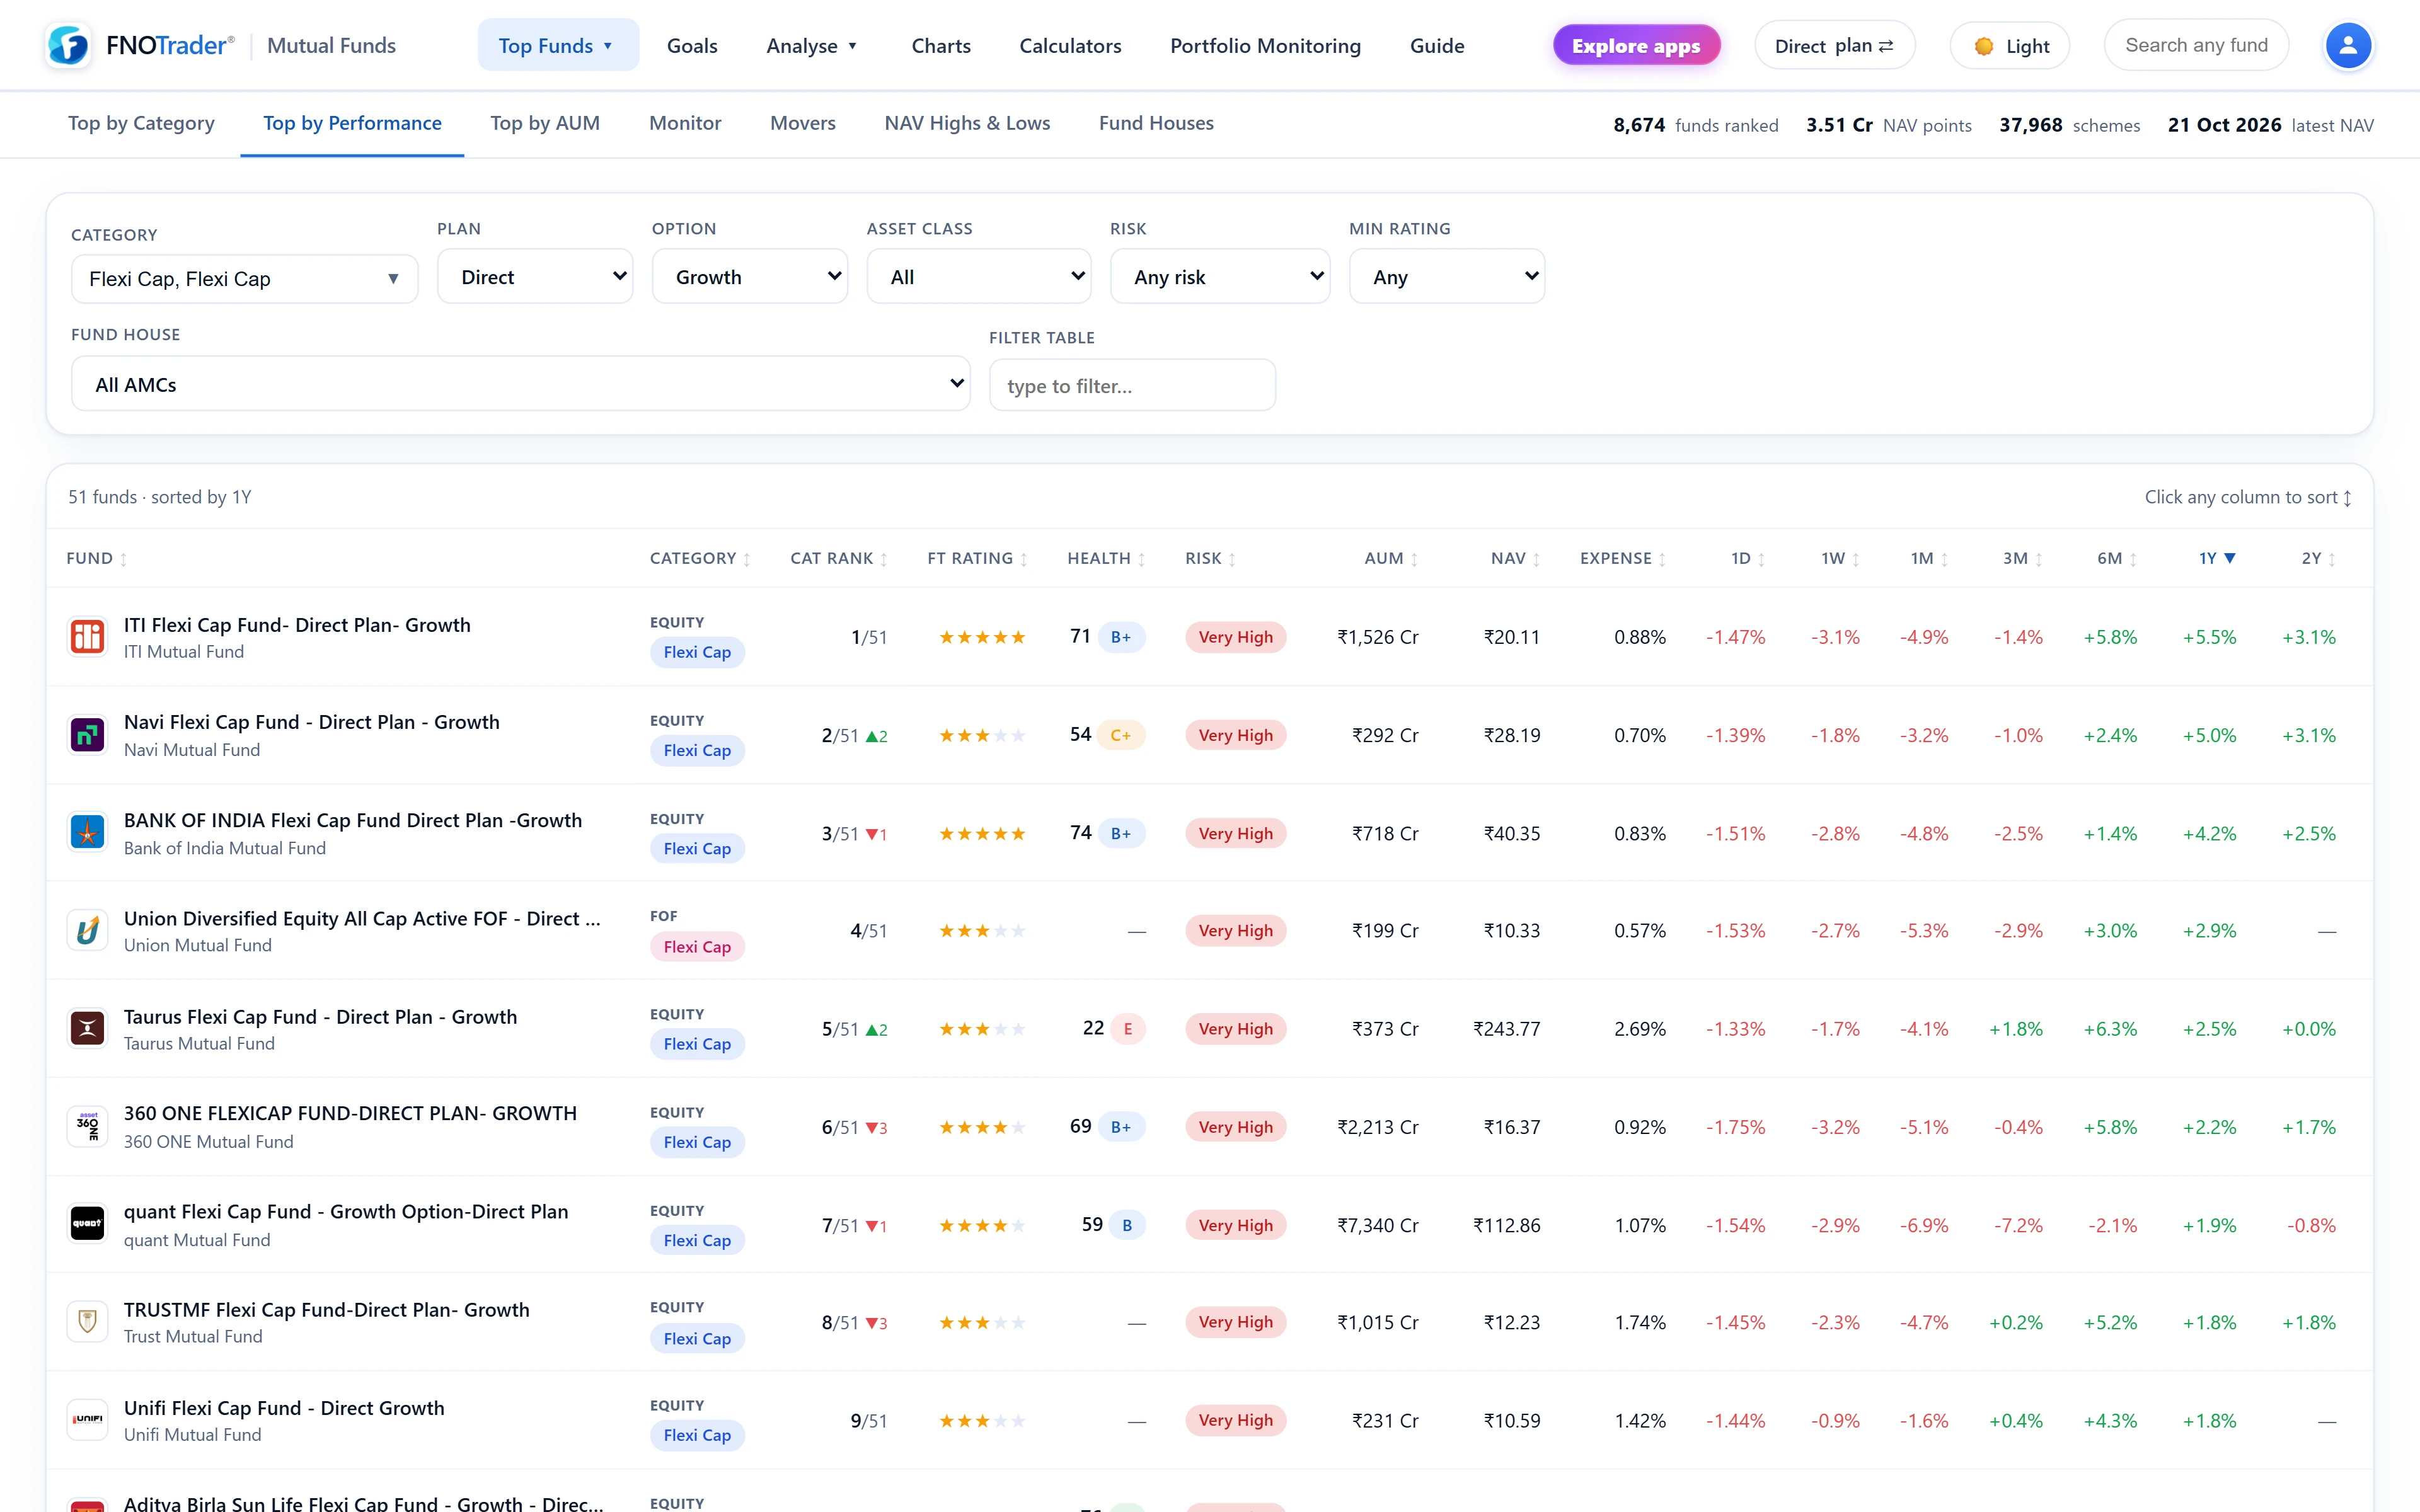
It is not a third-party rating and it is not a forecast. It is a percentile blend computed every night from the fund's own NAV history, and it is shown as 1 to 5 stars in every fund table in the app — Top Funds, Goals, Movers, Fund Houses, the screener and the peer table on each fund page.
The most common mistake with any star rating is comparing stars across categories. A 5-star liquid fund and a 5-star small-cap fund are each at the top of a very different peer group. The stars say nothing about which of the two is "better", because they were never on the same scale.
How the score is calculated
Each fund gets three percentile ranks inside its peer group, where the peer group is the SEBI sub-category and the plan. Direct funds are ranked against Direct funds and Regular against Regular, so switching the plan toggle gives a like-for-like rating rather than Direct plans winning simply because they cost less. Only the Growth option is rated, because an IDCW plan's NAV drops on every payout and its raw return understates what the portfolio earned.
| Input | Weight | Notes |
|---|---|---|
| 3-year CAGR, percentile in peer group | 40% | Uses the 1-year return if the fund is younger than three years |
| 5-year CAGR, percentile in peer group | 30% | Uses the 3-year CAGR if the fund is younger than five years |
| Sharpe ratio, percentile in peer group | 30% | A fund with no Sharpe ratio ranks last on this leg |
Sharpe here is the trailing annualised return (3Y, else 2Y, else 1Y) minus a 6% risk-free rate, divided by the annualised standard deviation of daily NAV returns over up to three years. The volatility figure needs more than 200 daily observations, so a fund with under roughly ten months of history has no Sharpe ratio. If you want the background on Sharpe and its cousins, read mutual fund risk measures.
The three percentiles run from 0 to 1, so the blended score also runs from 0 (bottom on every leg) to 1 (top on every leg).
From score to stars
| Blended score | Stars |
|---|---|
| 0.90 and above | 5 |
| 0.675 to below 0.90 | 4 |
| 0.325 to below 0.675 | 3 |
| 0.10 to below 0.325 | 2 |
| Below 0.10 | 1 |
The cut-offs are applied to the blended score, not to a fixed quota of funds, so the share of funds holding each star count varies from category to category. A category with fewer than five funds in that plan gets no rating at all: a percentile among three funds is noise, and showing it would look more precise than it is.
A worked example
Take a hypothetical flexi-cap Direct fund. Among Direct flexi-cap funds its 3Y CAGR sits at the 95th percentile, its 5Y CAGR at the 80th, and its Sharpe ratio at the 70th.
- 3Y leg: 0.4 × 0.95 = 0.38
- 5Y leg: 0.3 × 0.80 = 0.24
- Sharpe leg: 0.3 × 0.70 = 0.21
The score is 0.38 + 0.24 + 0.21 = 0.83, which falls between 0.675 and 0.90, so the fund shows 4 stars. To reach 5 it would need a blend of 0.90 — for example, top-decile on all three legs. Notice what drives it: a fund that shot up over three years but is mediocre over five, with a volatile path, cannot buy its way to 5 stars on one strong number.
Category rank and the month-ago arrow
Next to the stars, the Cat Rank column shows the fund's position inside its
category as rank / category size — for example 12/78. Ranks are
computed for the 1M, 6M, 1Y and 2Y return windows, among Growth-option funds of the plan you have
selected, and follow whichever window the table is showing.
On the 1Y view a small arrow follows the rank. It compares today's 1-year rank with the fund's 1-year rank as of about a month ago. ▲5 means it has climbed five places; ▼3 means it has slipped three. It answers "is this fund drifting up or down among its peers" without you having to remember last month's table.
The fund page shows all four windows side by side, plus the fund's rank across the whole universe. A fund that is 3rd over two years and 61st over one month is telling you something a single number would hide.
Limits worth knowing
- It is backward-looking. Ratings move as returns roll forward. A rating is a summary of what happened, not a prediction of what will.
- Young funds lean on shorter windows. A two-year-old fund is rated on its 1Y return in place of 3Y, and on 3Y in place of 5Y where it has one. Check the fund's age before reading its stars as a long track record.
- Same category, same plan only. Do not compare stars across categories, and do not compare a Direct fund's stars with a Regular fund's. See Direct vs Regular plans for why the plans differ.
- Stars are one column, not a verdict. For a fuller picture, the Fund Health score adds consistency, downside, cost and track record.
Where to find it
- Open Mutual Funds and choose Top Funds from the menu.
- Pick a return window; the FT and Cat Rank columns update with it. Switch to 1Y to see the month-ago arrow.
- Use the plan button in the top bar to switch between Direct and Regular rankings.
- To filter by stars, open Analyse → Fund Screener and set "FT rating ≥".
Common questions
What is the FT Rating for mutual funds?
It is FNOTrader's own 1 to 5 star rating: 40% the 3-year CAGR percentile, 30% the 5-year CAGR percentile and 30% the Sharpe ratio percentile, all ranked within the fund's category and plan.
Why does a fund have no FT Rating?
Either its category has fewer than five funds in that plan, it is an IDCW plan (only Growth is rated), or it does not yet have a 1-year return.
Why do Direct and Regular plans of the same fund show different stars?
Each plan is ranked only against other funds of the same plan. The Direct plan competes with Direct funds and the Regular plan with Regular funds, so their positions can differ.
What does the arrow next to the category rank mean?
On the 1-year view, it shows how many places the fund's 1-year category rank has moved compared with about a month ago. Up means it climbed.
Is a 5-star fund a recommendation to buy?
No. The rating summarises past return and risk against peers. It does not consider your goals, tax situation or time horizon.
More on Mutual Funds
More in Mutual Funds · App: Mutual Funds · Definitions: glossary · All: every article