What the page is for
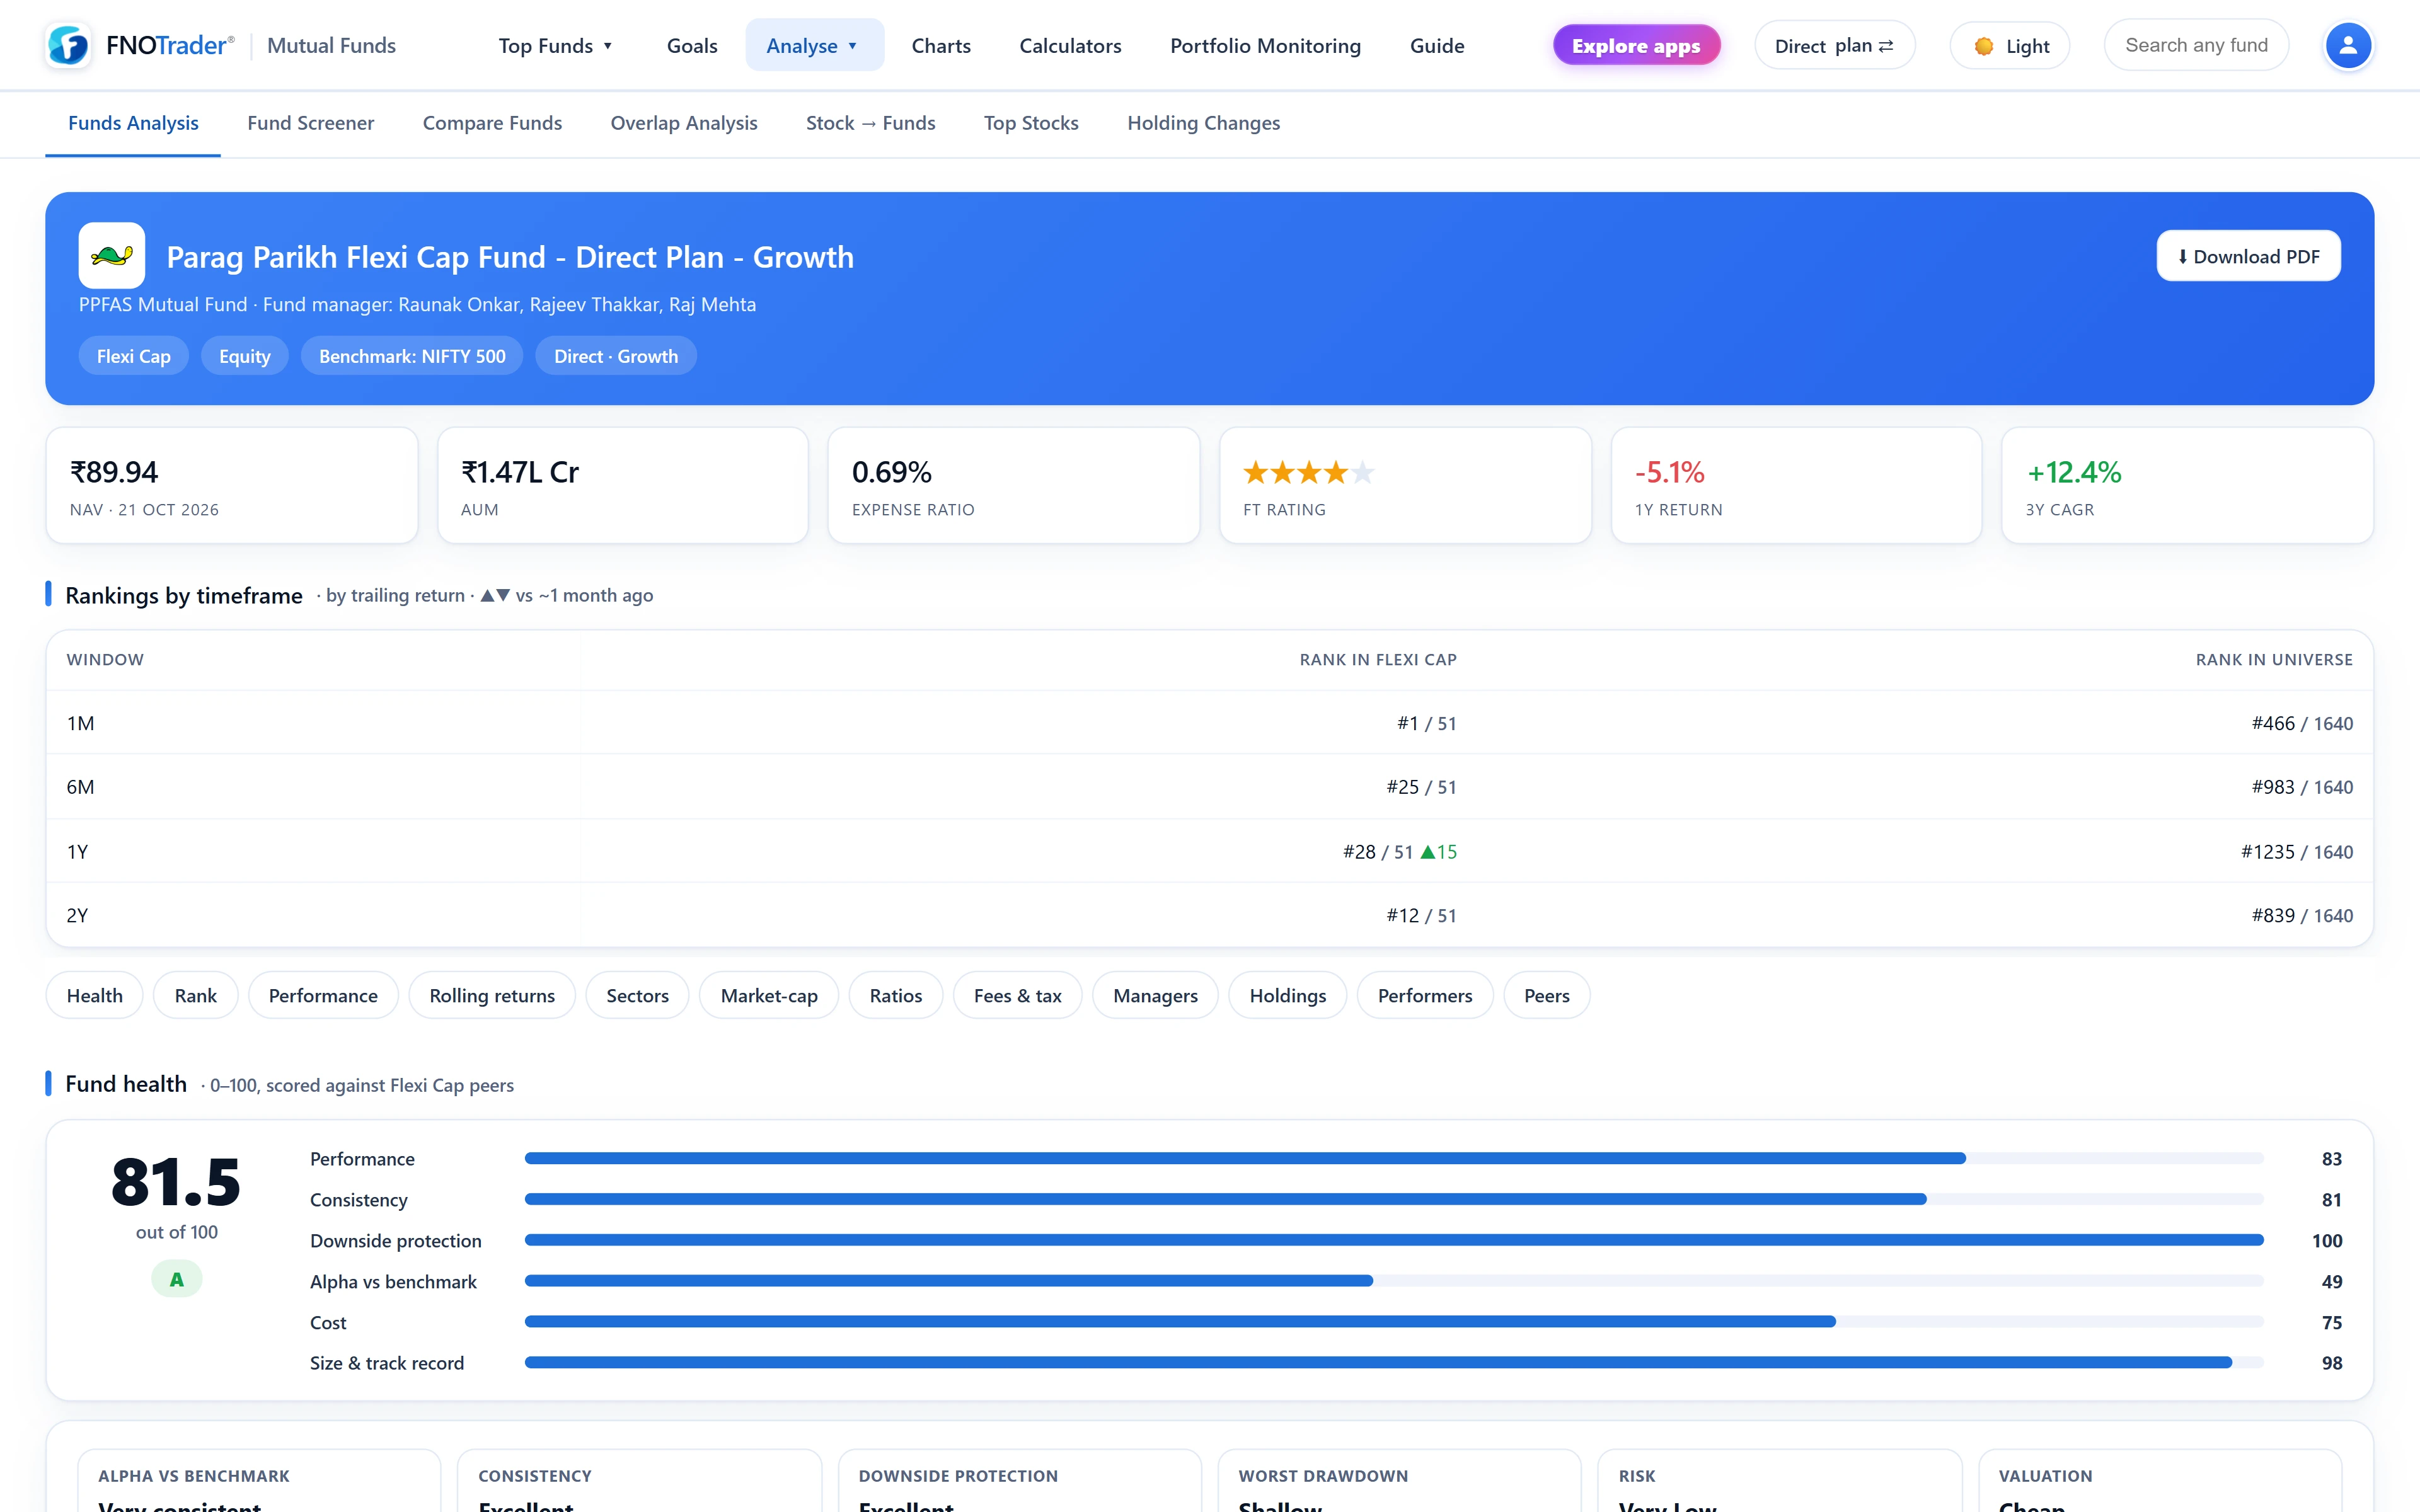
The fund page puts everything known about one scheme on a single screen, with a sticky jump bar: Health, Rank, Performance, Rolling returns, Sectors, Market-cap, Ratios, Fees & tax, Managers, Holdings, Performers and Peers.
Sections that cannot apply are dropped rather than shown as a row of dashes. A gold fund or a liquid fund maps to no equity benchmark, so it legitimately has no alpha, capture ratio or tracking error. If you want the generic version of this exercise, see how to read a factsheet; this post is about what the app computes for you.
Rolling returns: the most useful table on the page
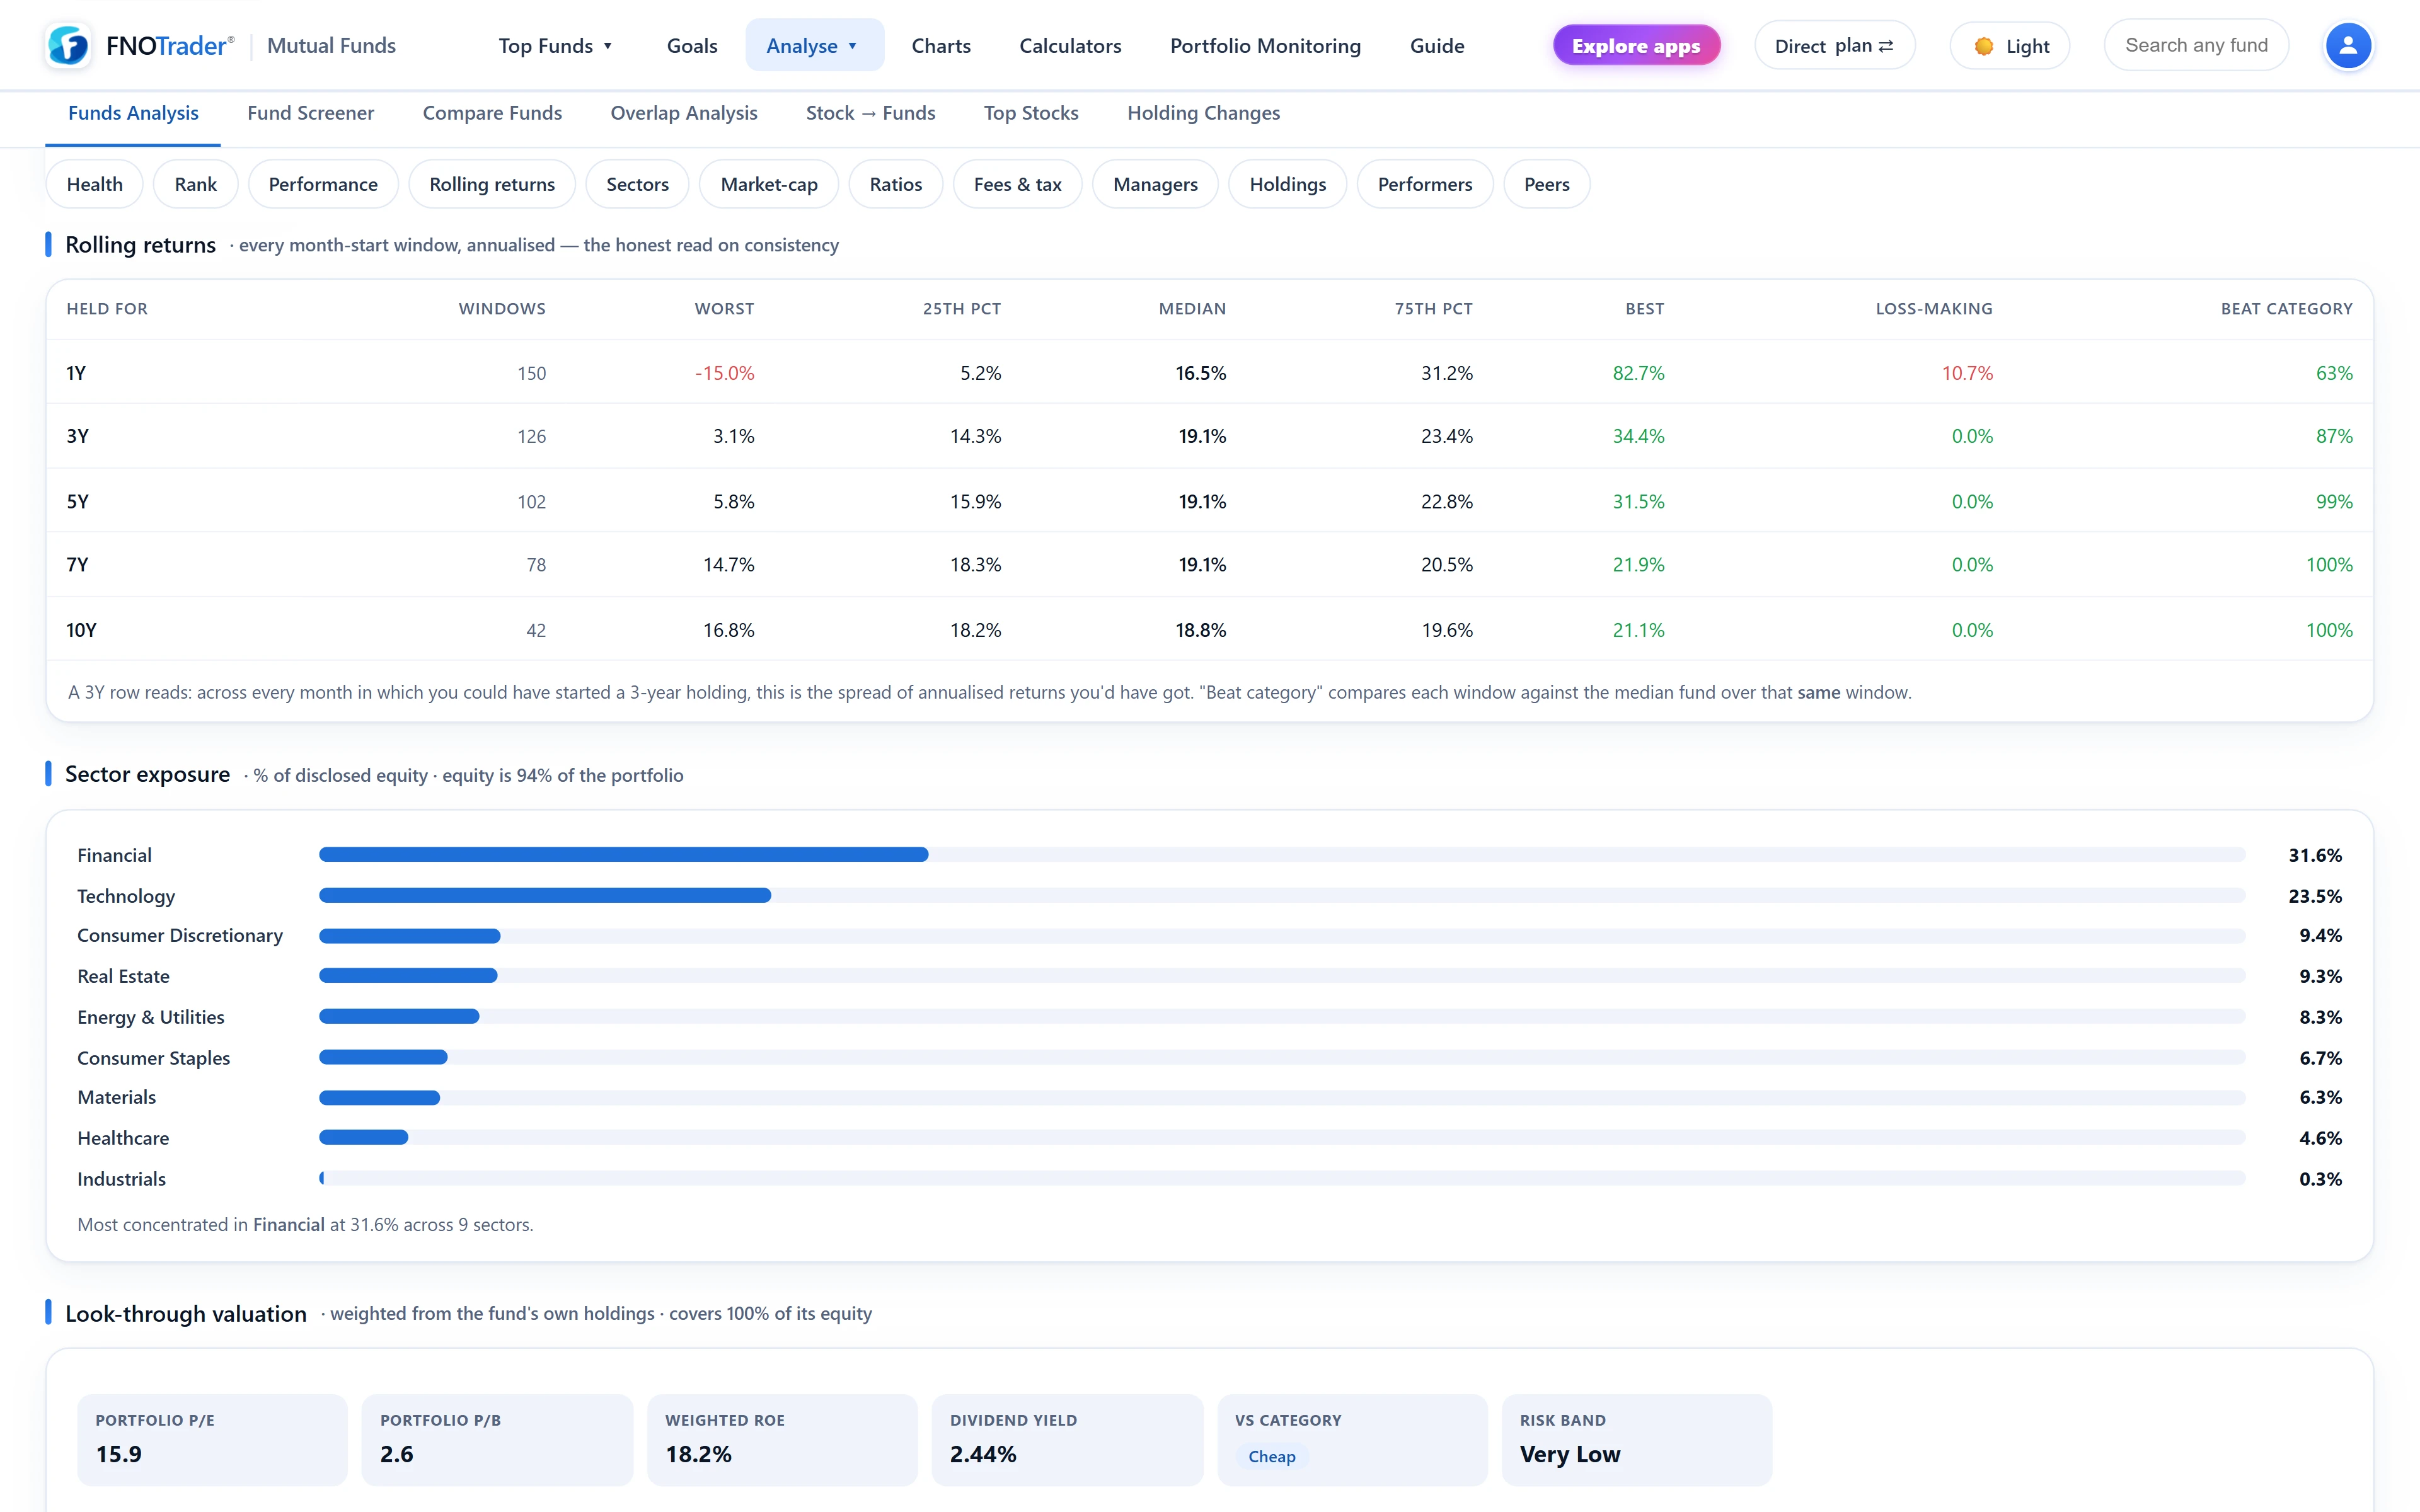
For each holding period — 1, 3, 5, 7 and 10 years — the app takes the month-end NAV of every month in the fund's life where a complete window exists, computes the annualised return to the NAV that many months later, and describes the resulting spread.
| Column | Meaning |
|---|---|
| Windows | How many complete windows exist. A 10Y row with 14 windows is a far thinner sample than a 3Y row with 140 |
| Worst / Best | The least and most any holder got, annualised |
| 25th pct / Median / 75th pct | The middle of the distribution. A tight band means the start date barely mattered |
| Loss-making | Share of windows that ended below their start. For a 3Y row, 0% means no three-year holder finished down |
| Beat category | Share of windows in which the fund beat the median Direct-Growth fund of its category over that same window |
The last column is window-matched on purpose. Comparing every window against today's category median would reward or punish the fund for things that happened in a different period. Read a 3Y row as: across every month you could have started a three-year holding, this is the range you would have got. The concept is covered in rolling returns explained.
The consistency score
The consistency score (0–100) is built from the 3-year rolling windows and needs at least 12 of them:
- 60% × the share of windows that beat the category median
- 25% × the share of windows that were not loss-making
- 15% × tightness: 100 minus five times the gap between the 75th and 25th percentile, floored at zero
Worked example. A hypothetical fund beat its category in 70% of 3-year windows, lost money in 5% of them, and its 25th and 75th percentiles are 10% and 16%. Tightness is 100 − 5 × 6 = 70. The score is 0.6 × 70 + 0.25 × 95 + 0.15 × 70 = 42 + 23.75 + 10.5 = 76.3, which the page labels "Good" (80+ is Excellent, 65+ Good, 50+ Average, 35+ Patchy, below that Weak).
Capture ratios, alpha and drawdown
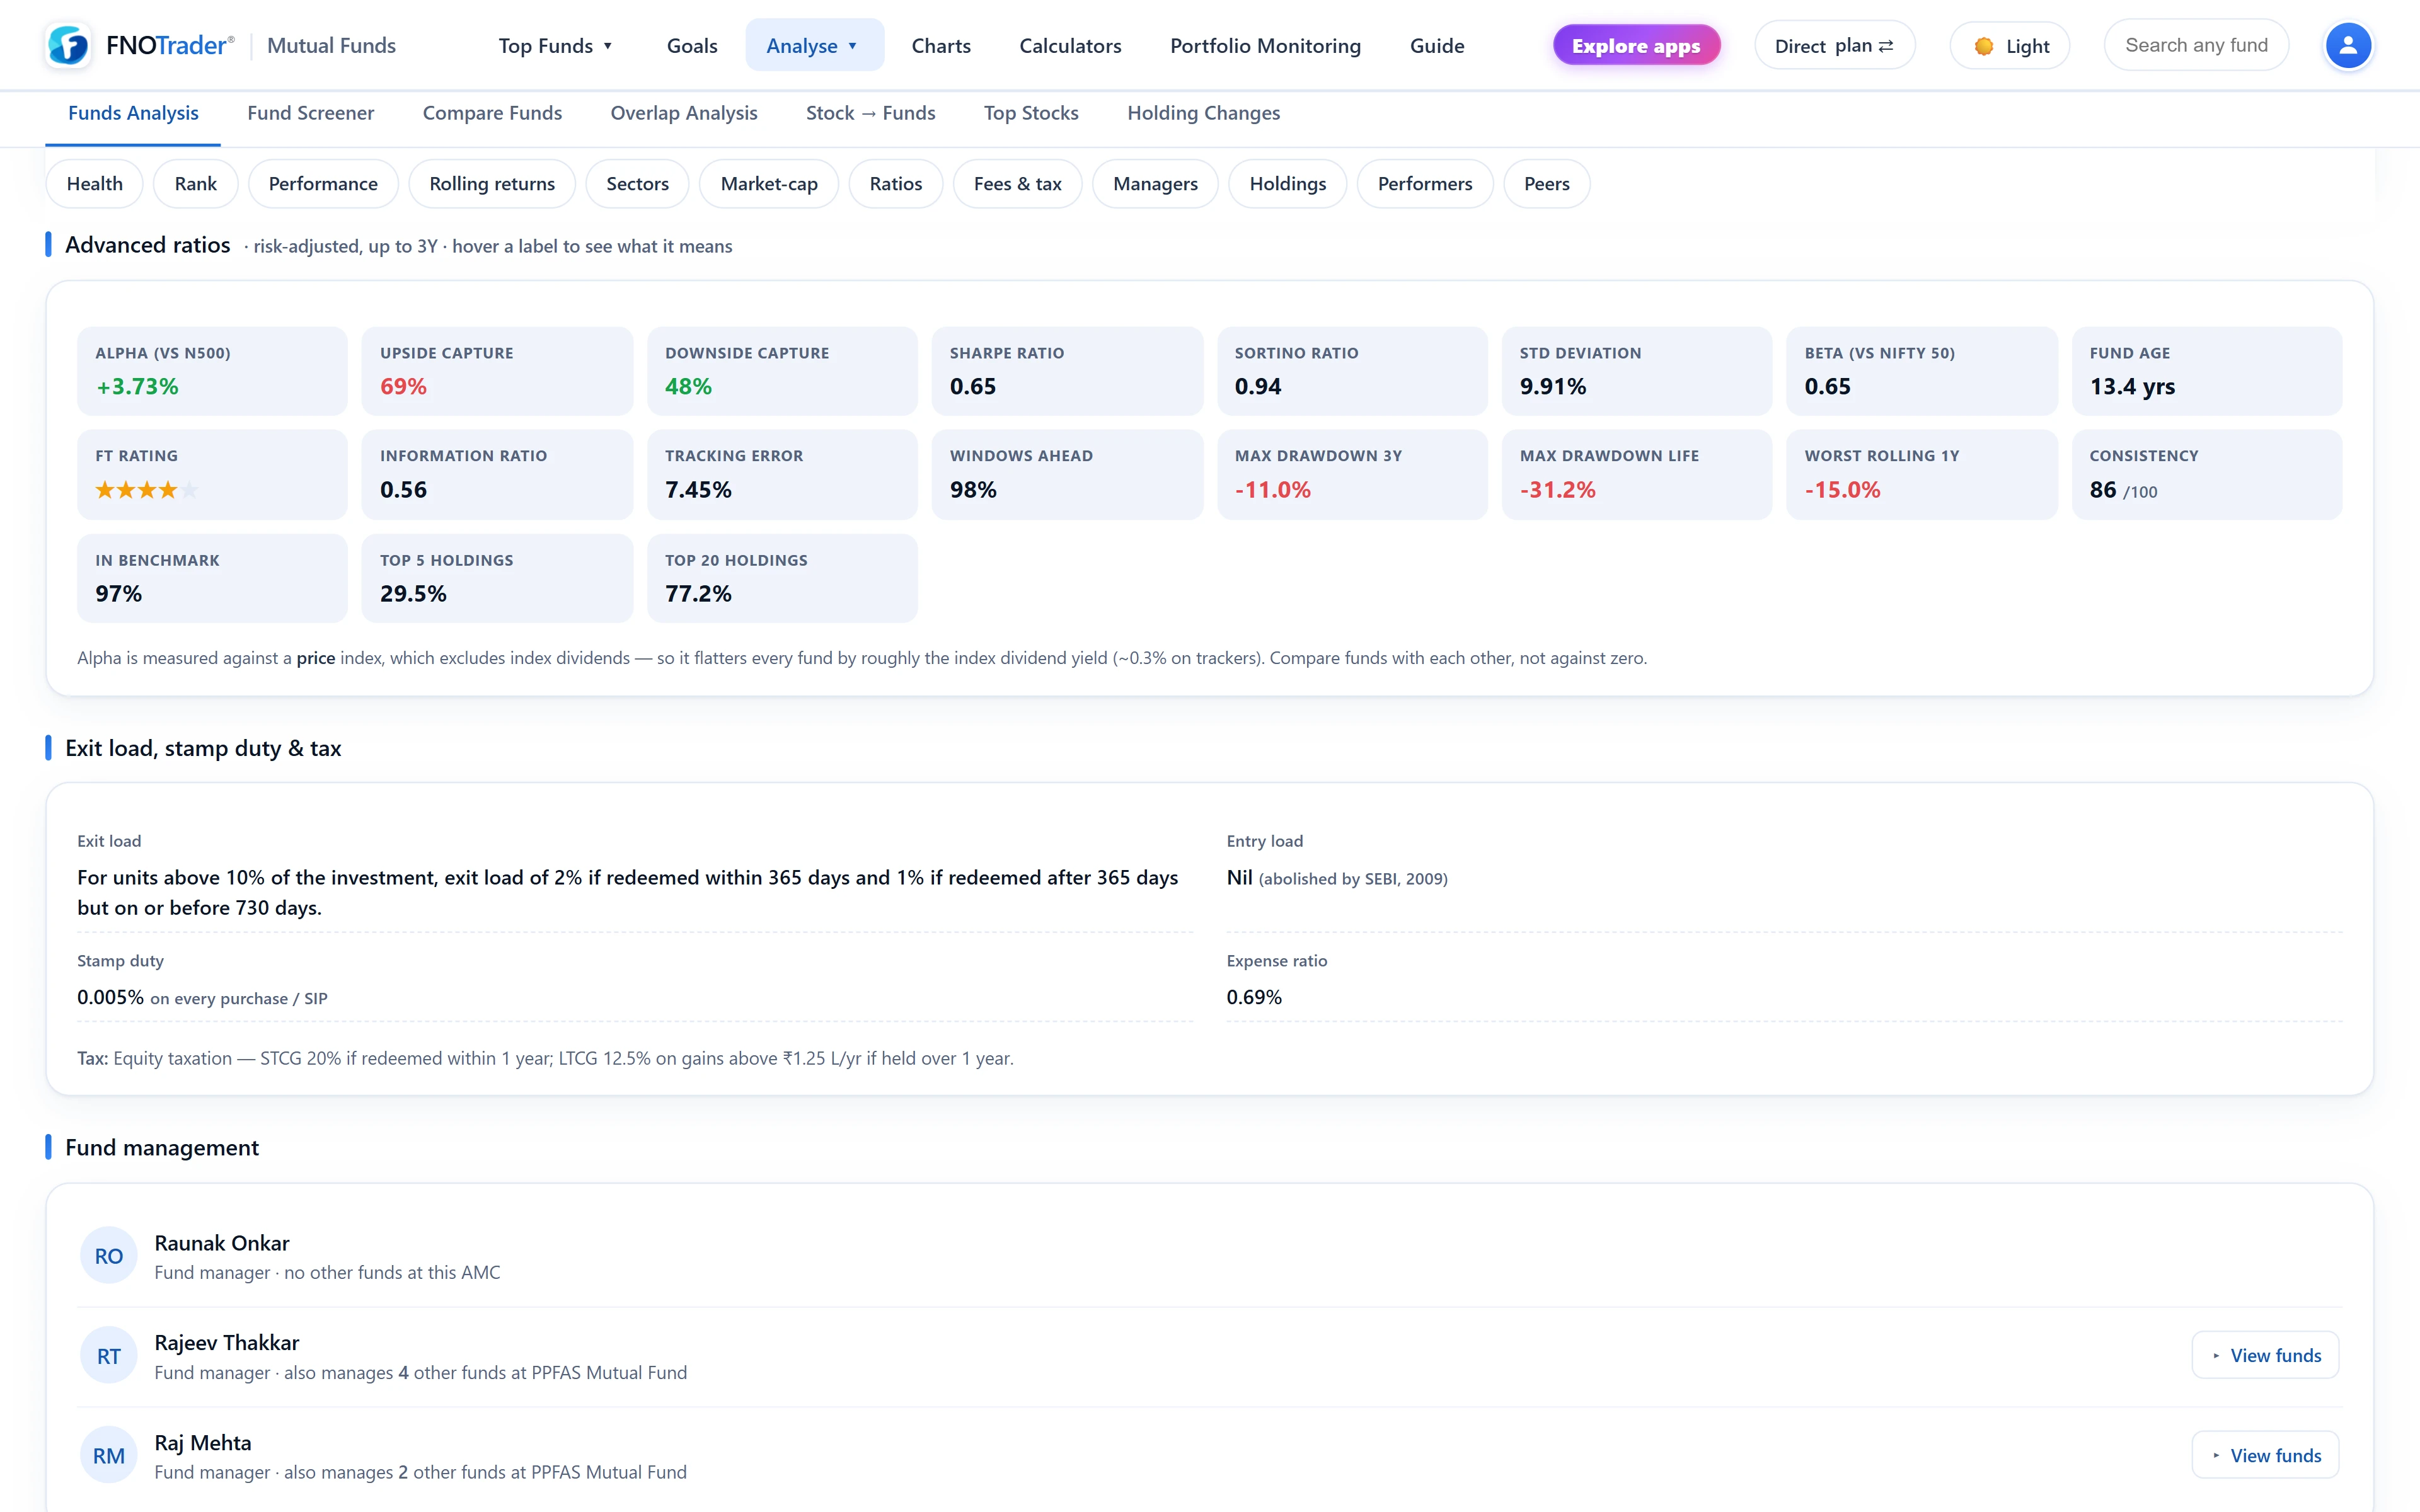
Upside and downside capture use monthly returns over three years against the fund's own benchmark: compound the fund's returns over the months the benchmark rose, divide by the benchmark's compounded return over those months, times 100; then the same for the falling months. An upside capture above 100 means the fund gained more than the index in up months. A downside capture below 100 means it fell less, which is the good direction. The fund needs at least six up months and three down months for a figure.
The Ratios section also carries alpha for 1, 3 and 5 years, the share of rolling 3-year windows the fund finished ahead of its benchmark, tracking error, information ratio, Sharpe, Sortino, beta against Nifty 50, maximum drawdown over three years and over the fund's life, and the worst rolling 1-year return. Anything that cannot be computed is listed at the bottom with the reason.
One caveat is stated on the page: benchmarks are price indices, which exclude dividends, so every active fund's alpha is somewhat flattered. Compare funds' alphas with each other rather than reading a small positive alpha as proof of skill.
Sectors, market cap and look-through P/E
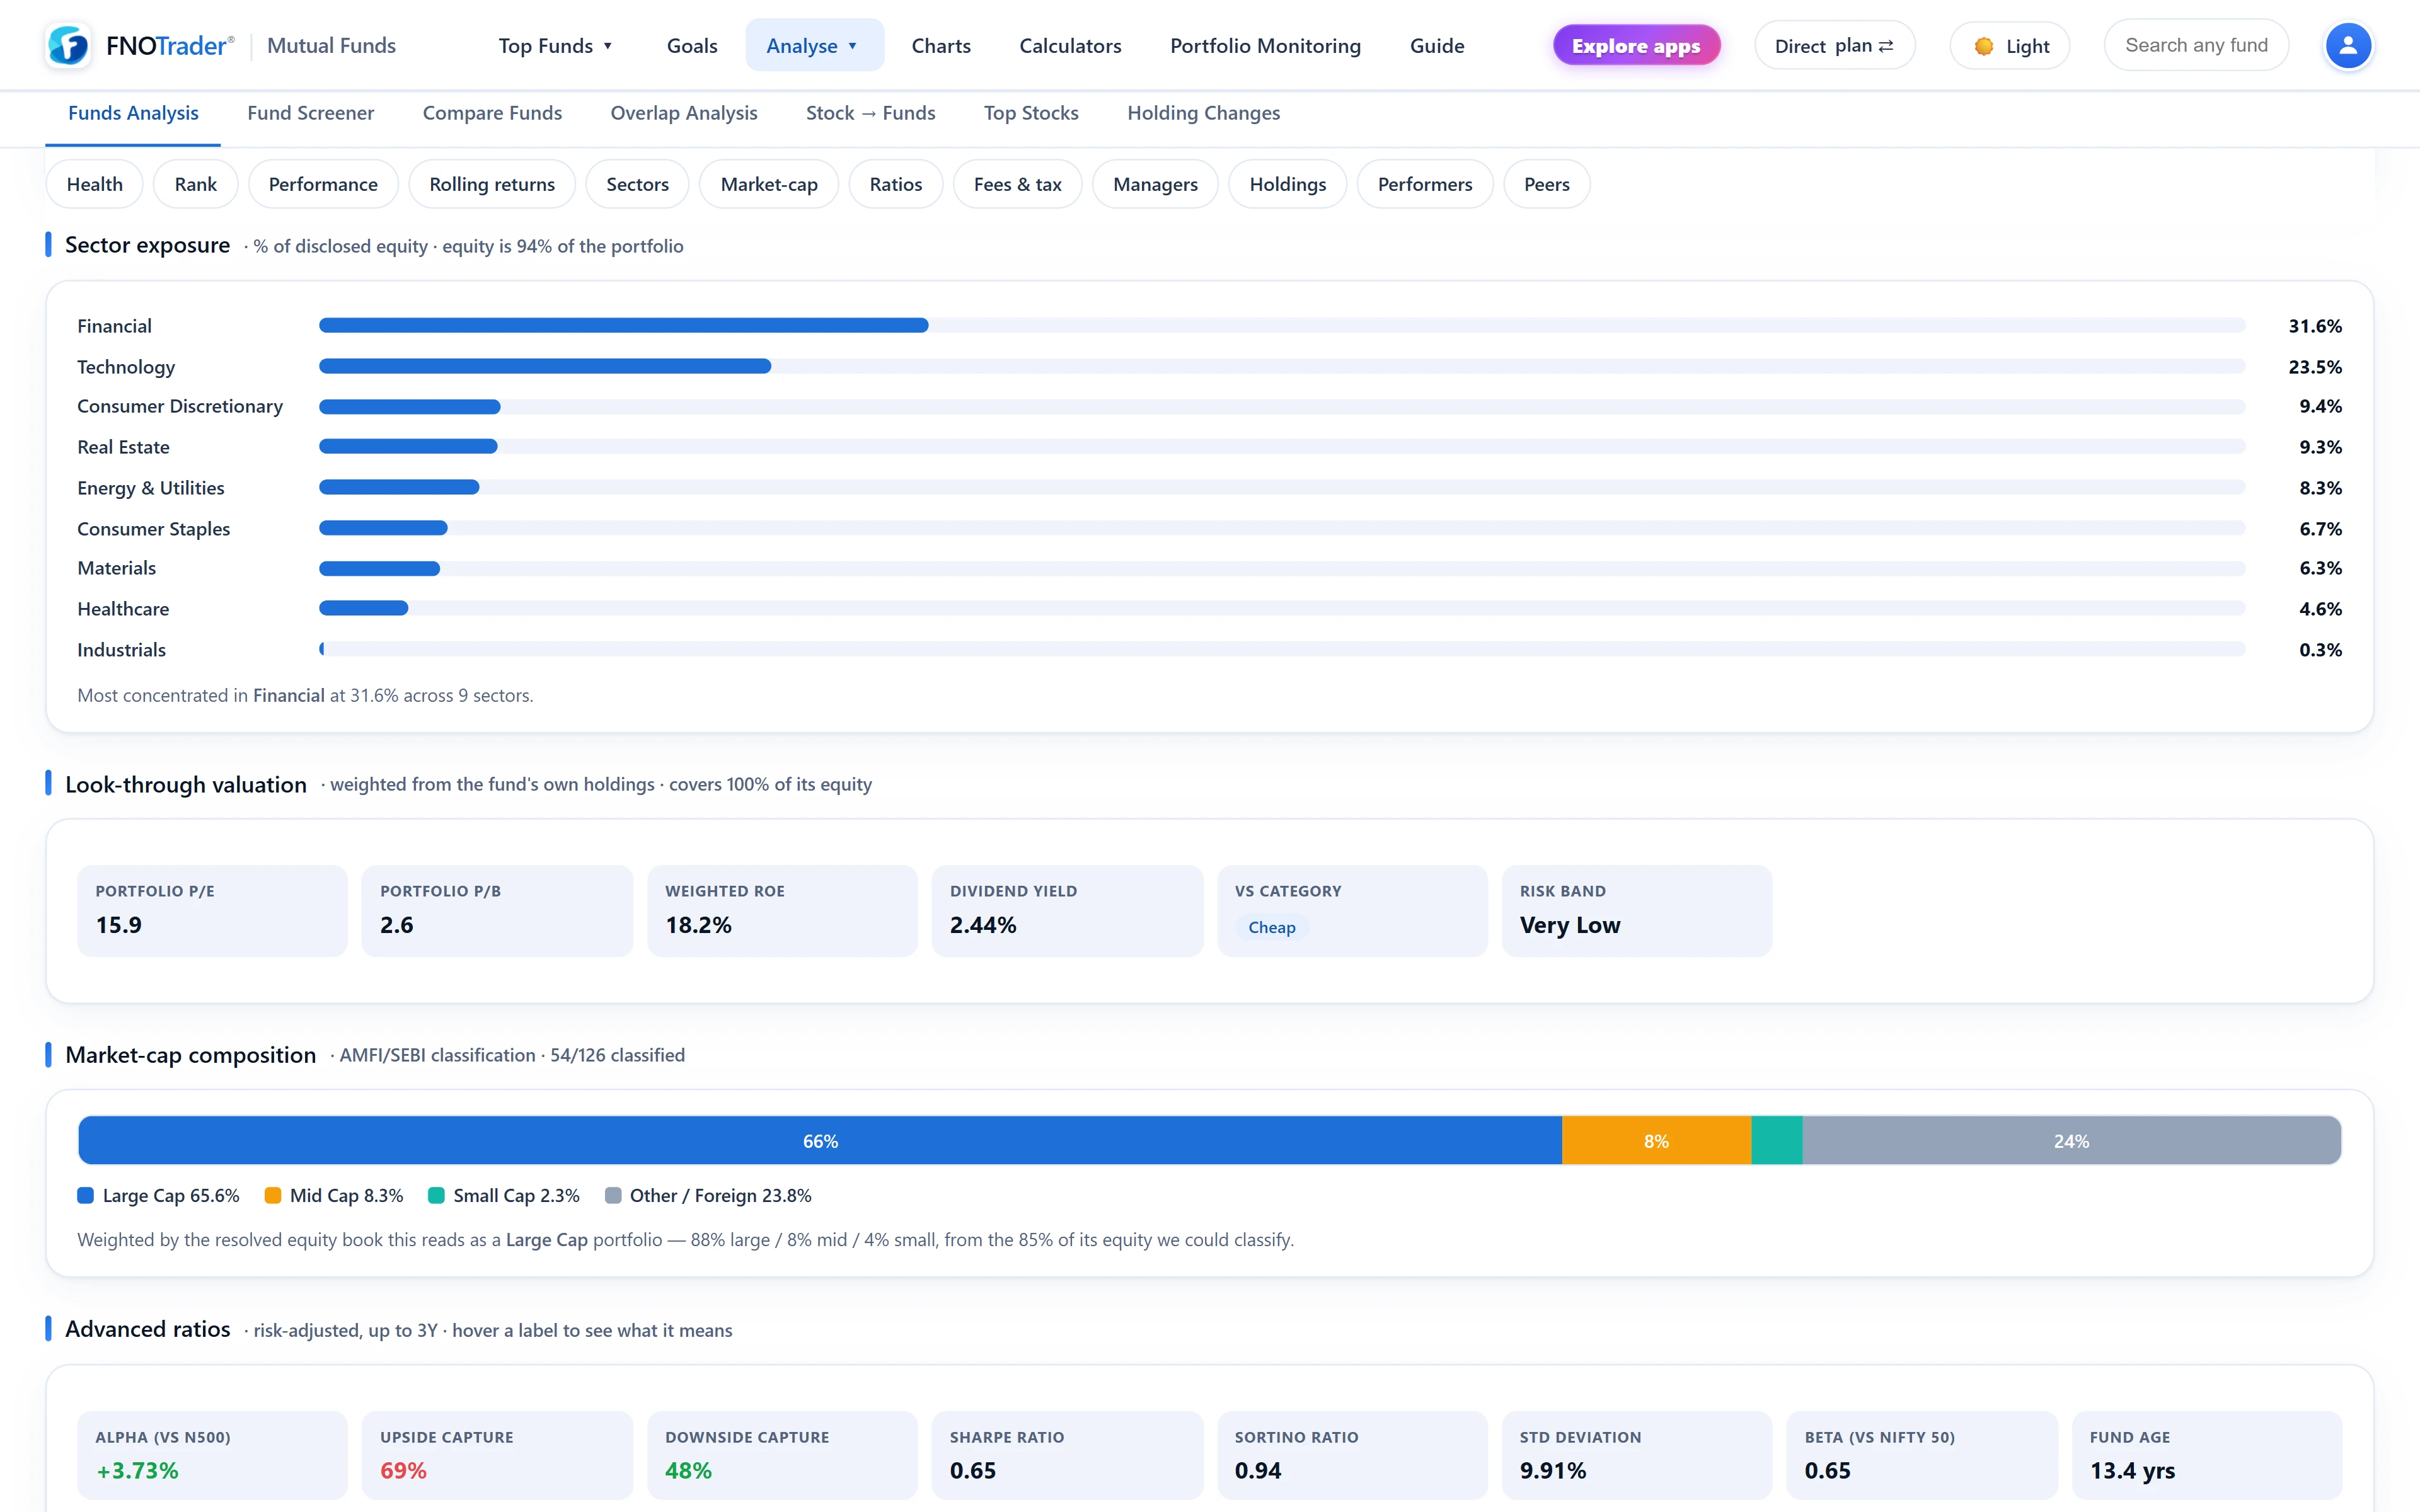
Sector weights are shown as a share of the disclosed equity, with a caption stating what share of the whole portfolio that equity is — so a hybrid fund with 30% equity never looks like a pure sector bet. Market-cap composition comes from AMFI's classification of each holding (top 100 companies large, 101–250 mid, the rest small), weighted by the fund's own weights, not from the fund's name.
Look-through valuation computes the portfolio's P/E from what it holds, using a weighted harmonic mean. Suppose half the equity is in a stock at 10× earnings and half in one at 40×. The arithmetic average says 25×. The harmonic mean is 1 ÷ (0.5/10 + 0.5/40) = 1 ÷ 0.0625 = 16×, which is the true price of the combined earnings. A Cheap / Fair / Expensive chip then ranks that P/E within the category (bottom third, middle third, top third; at least five peers). The caption tells you what share of the equity could be matched to fundamentals.
Fees, managers, holdings and exports
- Fees & tax — exit load in the scheme's own words, the expense ratio, the 0.005% stamp duty on purchases and SIP instalments, and a general tax summary for the fund type. Tax rules change; confirm before acting.
- Managers — each named manager and the other schemes they run at the same fund house, with 1-year returns.
- Holdings — the full disclosed portfolio with its date. Two exports: a
TradingView watchlist (
NSE:SYMBOLlist for Watchlist → Import) and a CSV with symbol, company, weight, sector and ISIN. - Performers — each listed holding's own returns from 1D to 5Y and its contribution (weight × return) for the chosen period.
- Peers — the category's funds in the standard table, sortable on any column.
Where to find it
- In Mutual Funds, search a fund from the top bar or click any row in any table.
- Use the jump bar to move between sections; hover any metric label for its definition.
- For the composite grade at the top, read the Fund Health score post; for the stars, the FT Rating post.
Common questions
How are rolling returns calculated in FNOTrader Mutual Funds?
For each holding period, every month-end NAV with a complete window after it produces one annualised return. The table reports the worst, 25th percentile, median, 75th percentile and best of those, plus the share that lost money.
What is a good downside capture ratio?
Below 100 means the fund fell less than its benchmark in down months. The page labels 70 or below Excellent and up to 85 Good; above 100 means it fell more than the index.
Why is the portfolio P/E a harmonic mean?
A portfolio's P/E is total price over total earnings. Averaging P/E ratios arithmetically lets one very expensive holding overstate how expensive the whole portfolio is.
Can I export a fund's holdings to TradingView?
Yes. The Holdings section offers a TradingView watchlist file of NSE symbols and a CSV with weights, sectors and ISINs.
Why does a debt or gold fund show no alpha or capture ratio?
Those figures need an equity benchmark. Funds that do not map to one simply do not show them, rather than showing misleading numbers.
More on Mutual Funds
More in Mutual Funds · App: Mutual Funds · Definitions: glossary · All: every article