Two pages for one job
Both pages zoom into a single strike of the expiry you have selected.
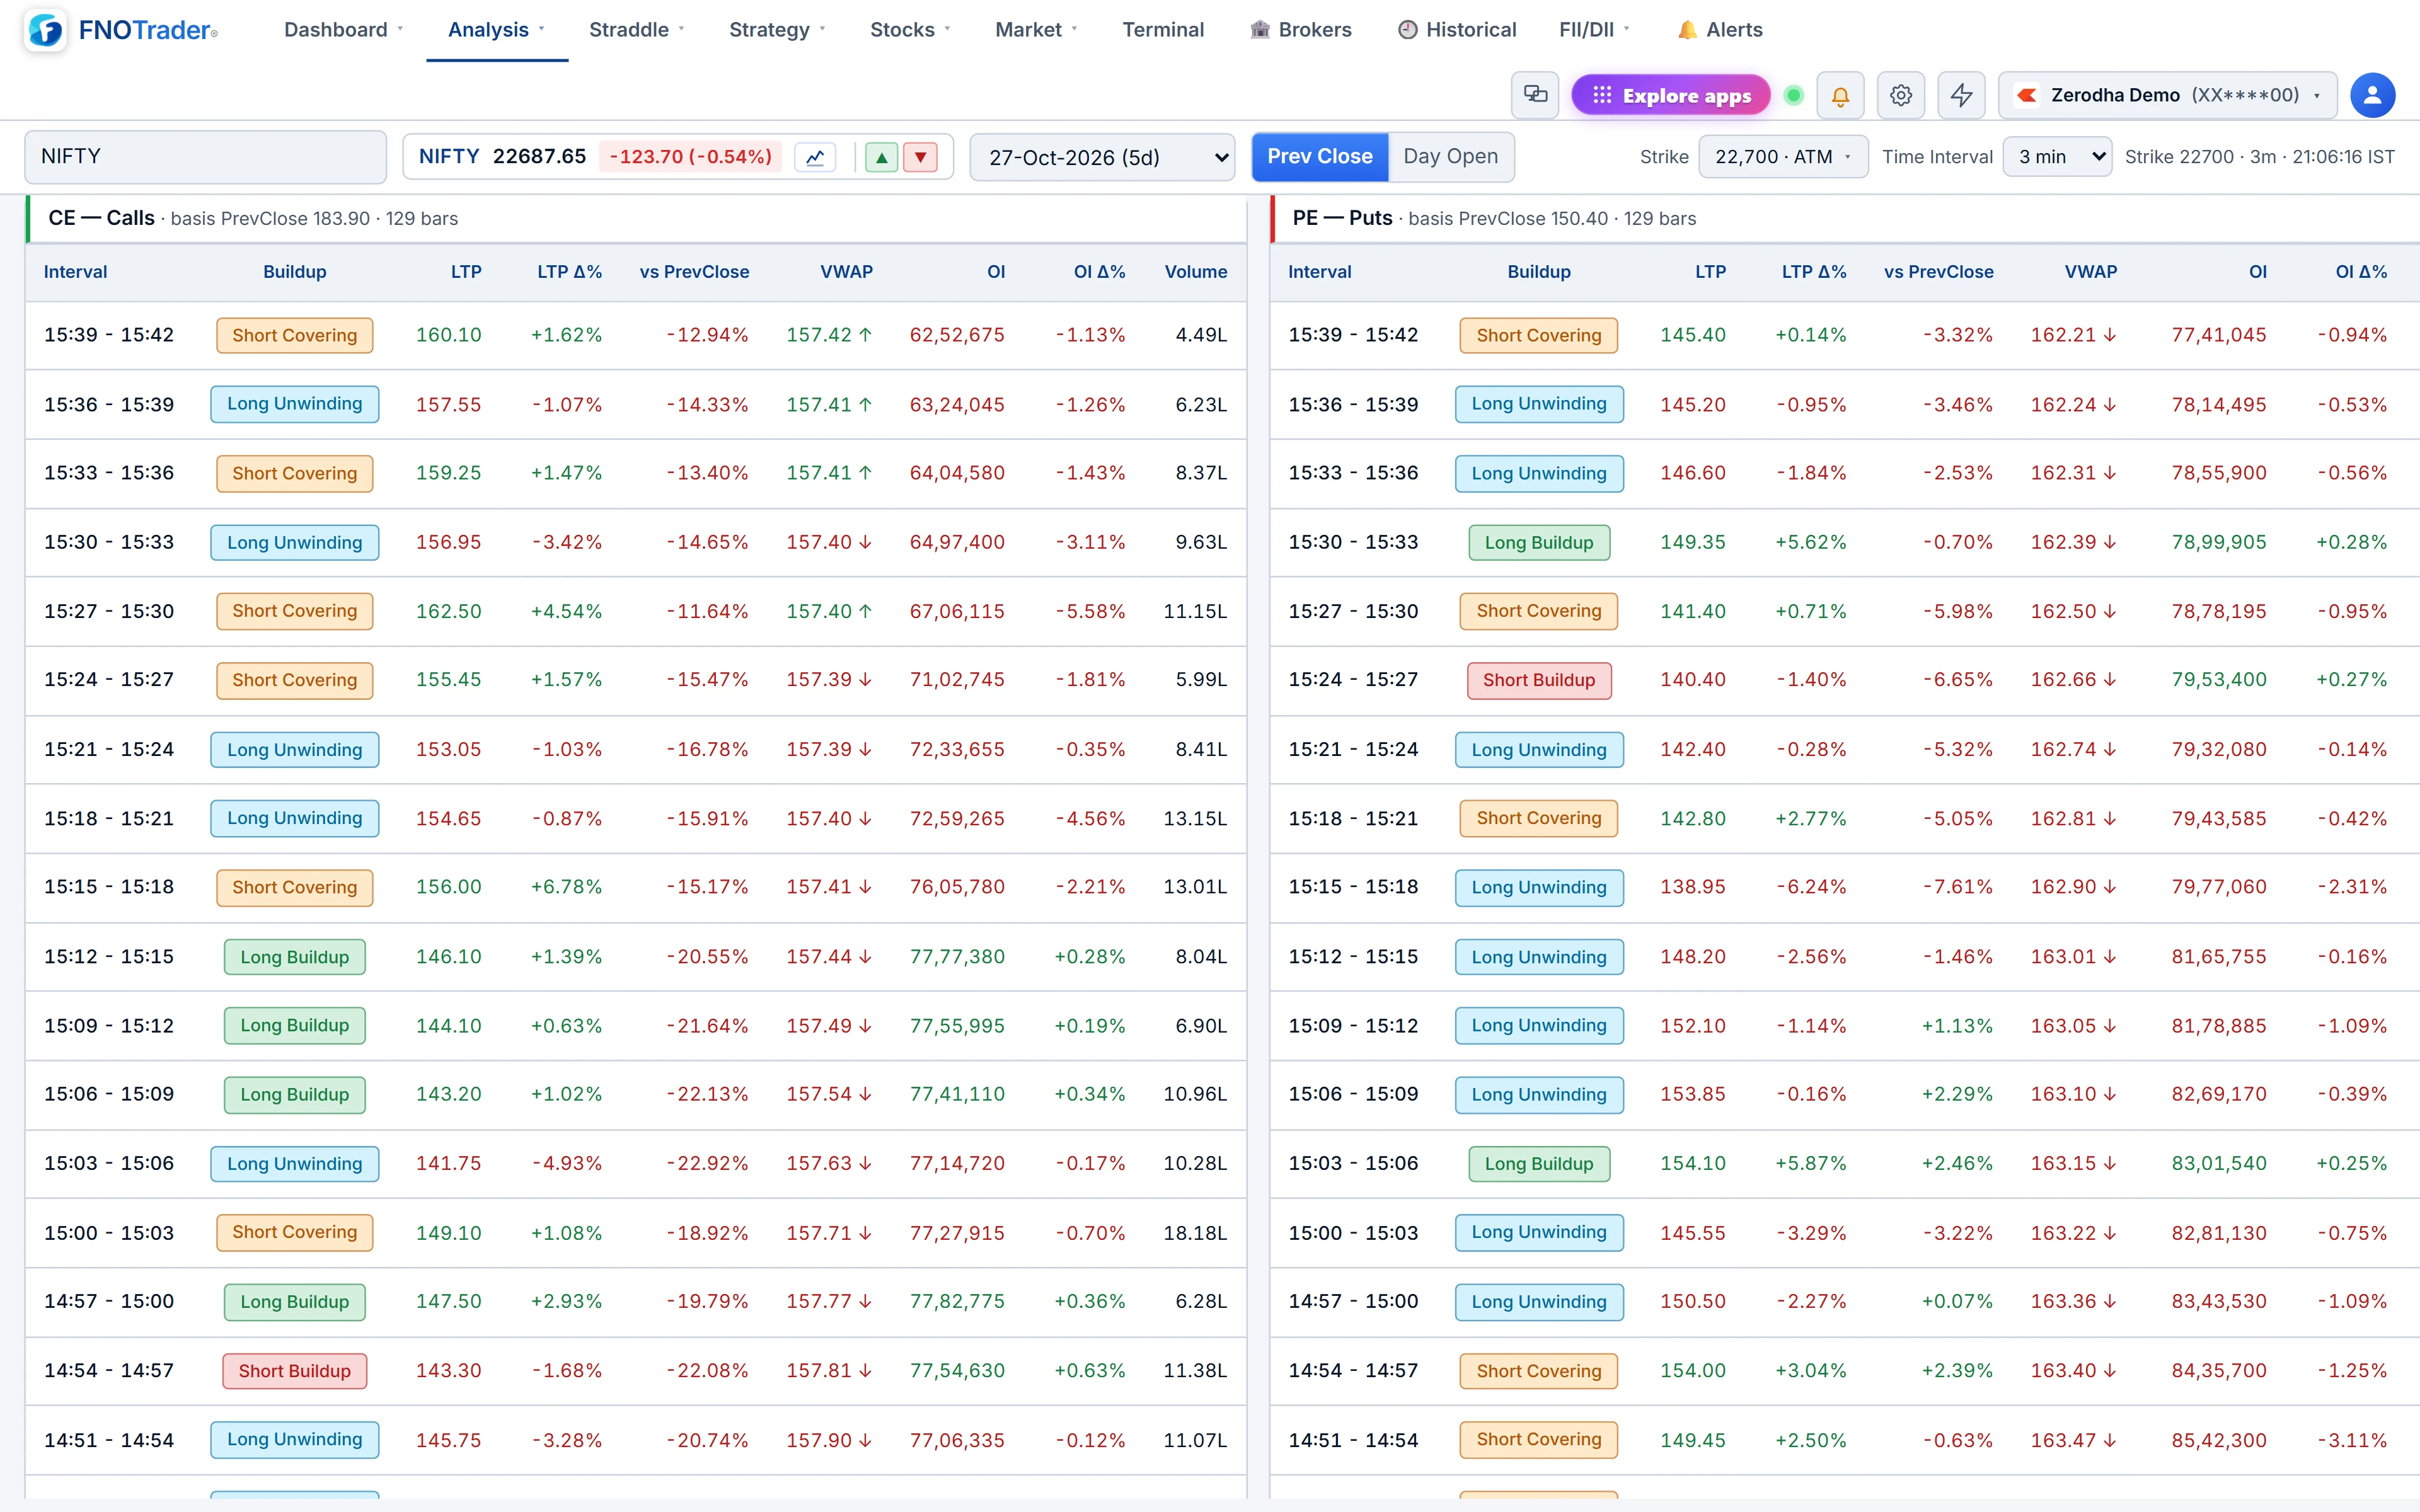
Strike Charts is the visual view: the call and the put as two candle charts side by side, each with volume and an OI pane underneath. Options Buildup is the same information as a table, one row per interval, newest on top, with a tag on every row.
You typically arrive here from the option chain or the screener, after a strike flashed unusual volume or OI.
The four buildup tags
Every tag combines two signs: did price rise, and did open interest rise?
| Price | OI | Tag and usual reading |
|---|---|---|
| Up | Up | LB — long buildup: fresh buyers opening. |
| Down | Up | SB — short buildup: fresh writers opening. |
| Down | Down | LU — long unwinding: buyers closing. |
| Up | Down | SC — short covering: writers buying back. |
On the Options Buildup page each interval is compared with the previous interval of the same day: price change is this bar's close minus the last bar's close, OI change is this bar's OI minus the last bar's. The first bar of the day has nothing to compare against and shows a dash. If both price and OI are exactly unchanged the row reads No Activity.
Edge cases follow the code's sign tests: a flat price with rising OI is tagged SB, a flat price with falling OI LU, a rising price with flat OI SC, a falling price with flat OI LU. Read those rows as weak evidence.
The Options Buildup table
Columns: the interval (for example 10:15 – 10:20), buildup tag, LTP, LTP change %, change against previous close or day open (following the top-bar basis), session VWAP with an arrow when price is above it, OI, OI change % and volume. The CE and PE tables sit side by side.
Intervals are 1, 2, 3 (default), 5, 10, 15 and 30 minutes. A strike picker tags each strike ATM, ITM or OTM. The table refreshes every minute, or every 15 minutes without a plan.
Strike Charts: what is on each pane
- Timeframes: 1, 2, 3, 5 (default), 10, 15, 20 and 30 minutes, over 1, 2 or 5 days.
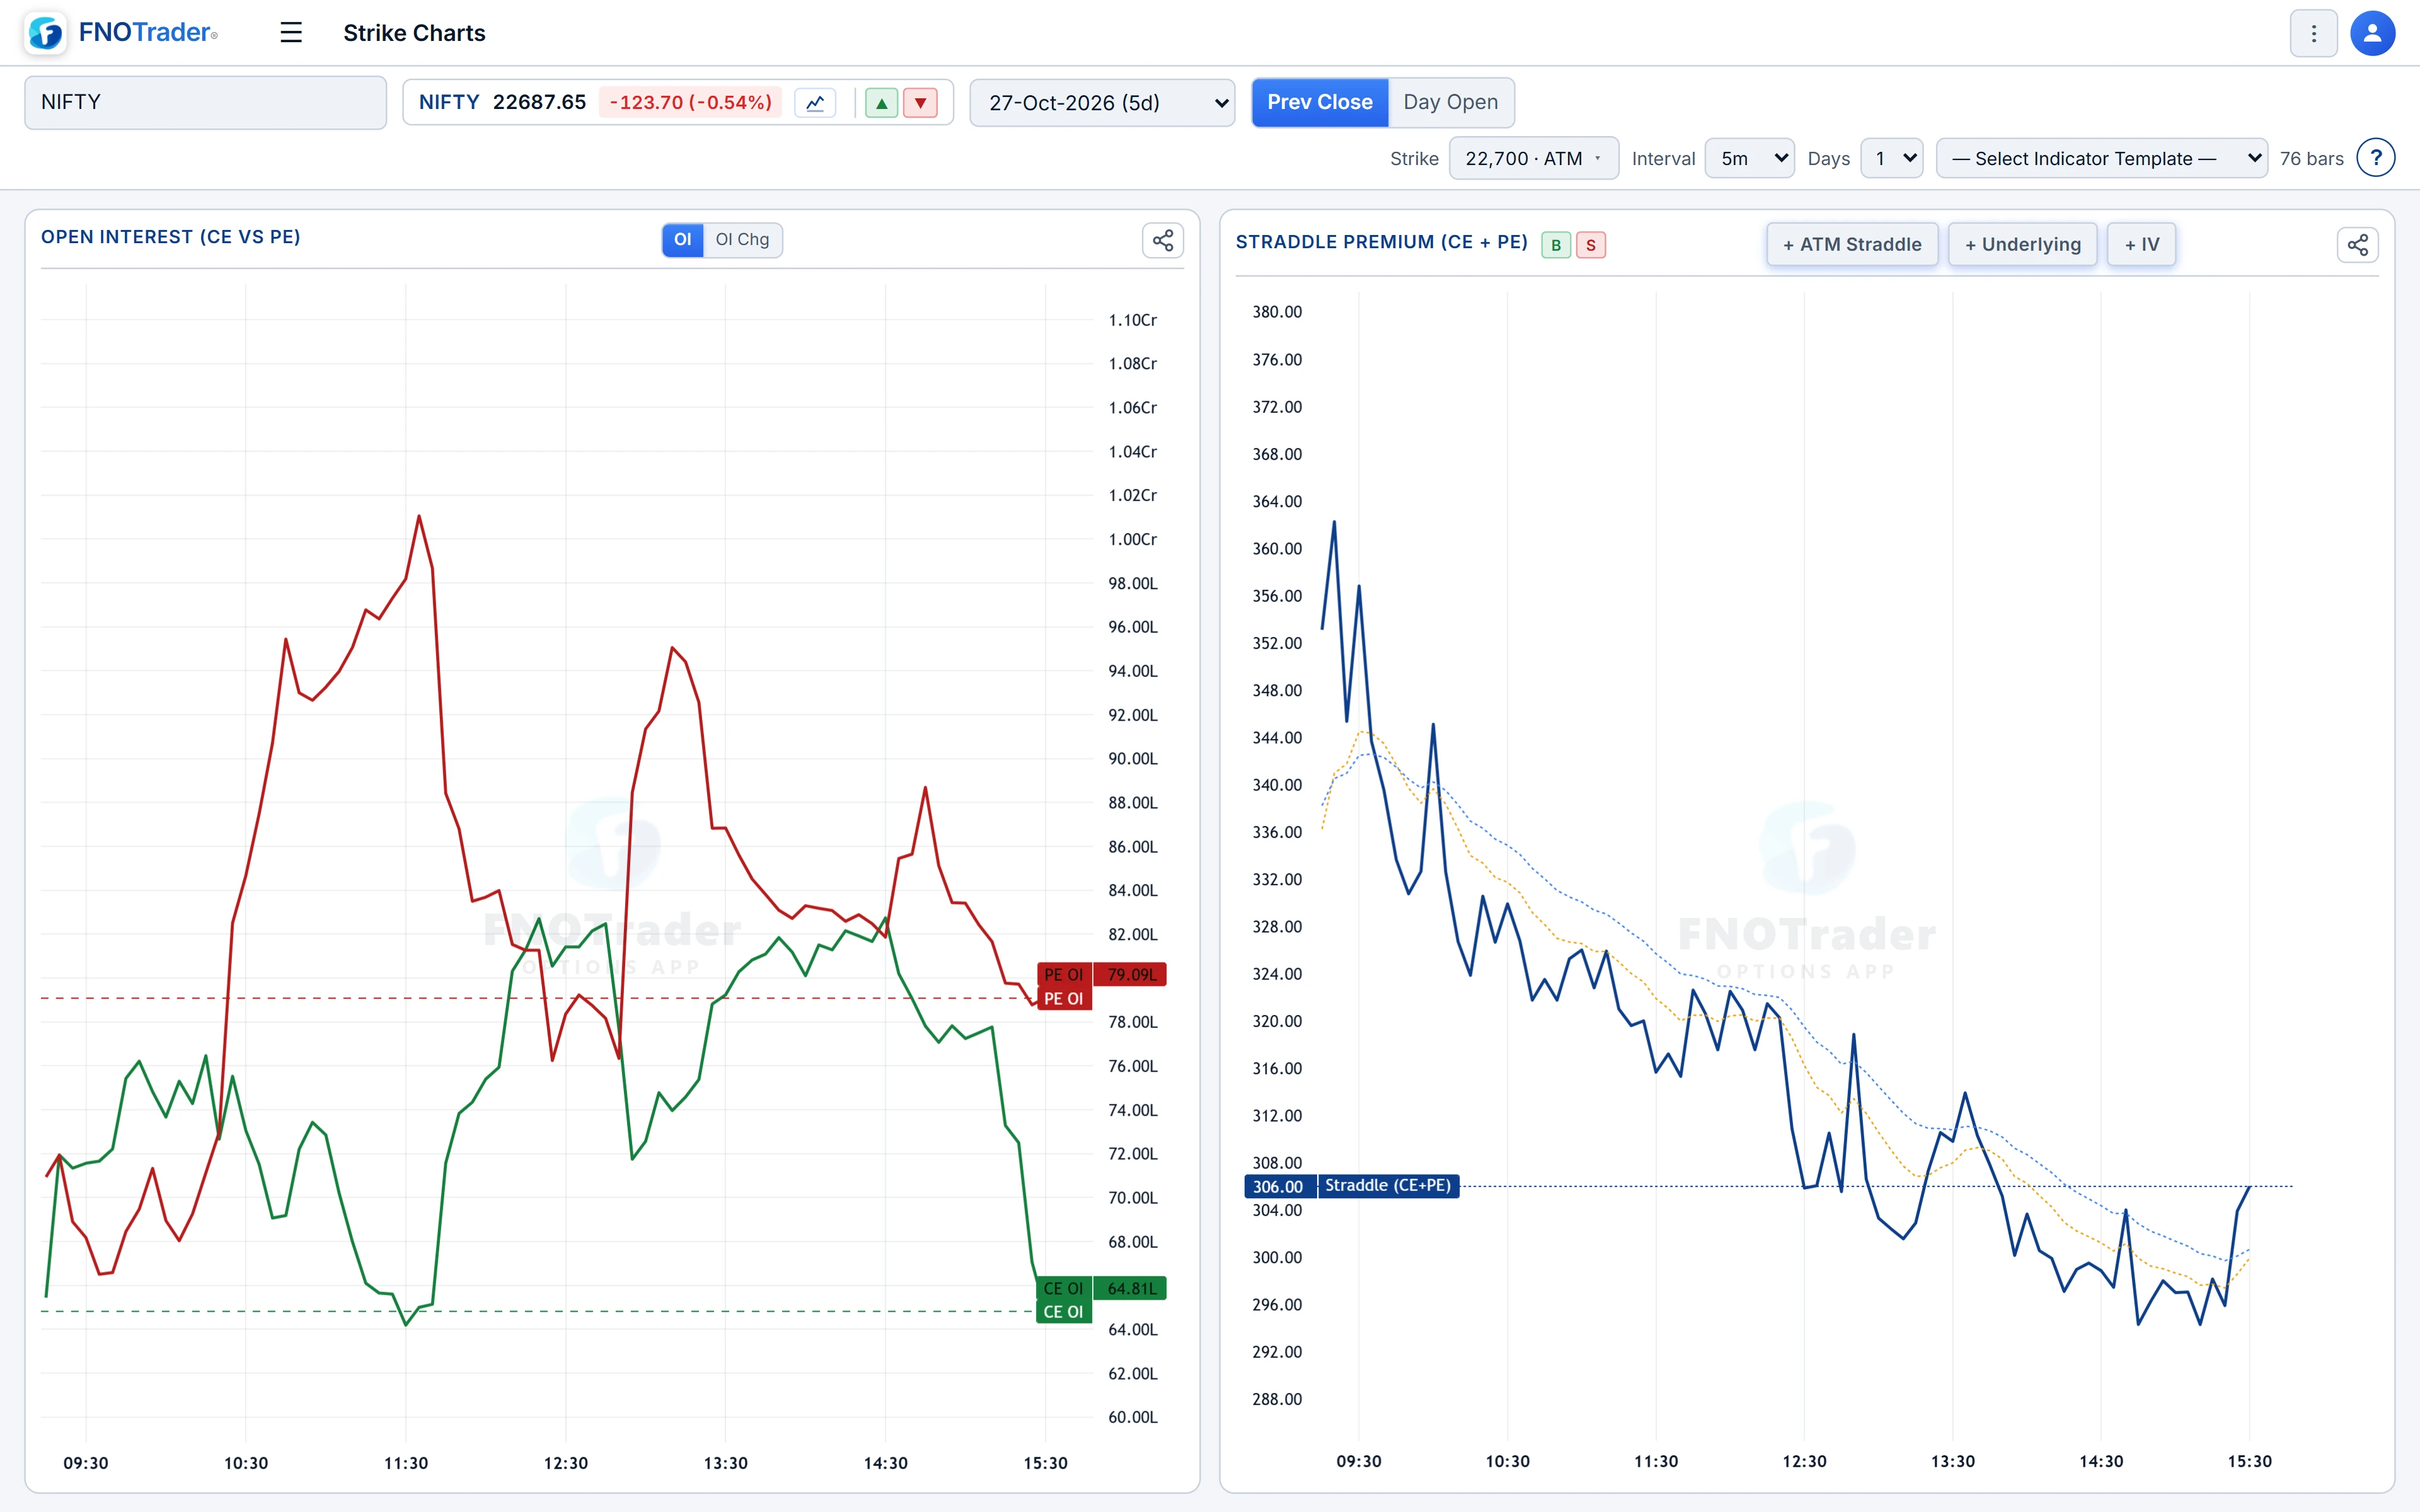
- Price: candles with volume and a dashed day-high line. EMA 10 and EMA 20 are on by default; VWAP and SuperTrend can be added.
- OI pane: the contract's OI as a line, with optional 10 and 20-period averages.
- Pocket-pivot volume: up bars whose volume beats the largest down-bar volume of the last ten bars are coloured blue.
- IV: implied volatility per bar, computed from the option price.
Below the two charts, a CE vs PE OI card plots both sides' OI (or OI change) together, and a straddle card plots CE + PE premium, with optional ATM straddle, underlying and average IV overlays.
A worked example on 5-minute bars
Hypothetical 24,200 CE. At 11:00 it closed ₹82 with OI 61.0 lakh. At 11:05: ₹76, OI 63.4 lakh. Price −₹6 (−7.3%), OI +2.4 lakh (+3.9%) → SB, short buildup.
At 11:10: ₹79, OI 62.1 lakh. Price +₹3, OI −1.3 lakh → SC, short covering.
One SC bar after a run of SB is not a reversal. Three or four SC rows in a row, with price back above VWAP and the PE side showing SB, is a stronger picture — the writers above are leaving while writers below are arriving.
Where the tags mislead
The tag cannot see who traded. Price up with OI up on a call could be new buyers, or new writers selling into strength at higher prices; the tag assumes the first. On thin strikes, one or two orders decide the tag, so check volume before reading it. And the chain's own buildup column compares with the previous day, not the previous bar, so the two can disagree on the same strike — they answer different questions.
Where to find them
- In Options Analytics, open Analysis → Strike Charts or Analysis → Options Buildup.
- Pick the strike; the expiry follows the top bar.
- Choose the timeframe or interval, and the Prev Close / Day Open basis in the top bar.
Common questions
What is long buildup in options?
Price rising together with open interest rising over the same interval, usually read as new buyers opening positions.
What is the difference between short covering and long unwinding?
Both have falling open interest. In short covering price rises, as writers buy back; in long unwinding price falls, as buyers sell out.
What does Options Buildup compare each row against?
The previous interval of the same day, for both price and OI. The first bar of the day is left untagged.
Which timeframes does Strike Charts support?
1, 2, 3, 5, 10, 15, 20 and 30-minute bars, over 1, 2 or 5 days.
More on Options App
More in Options App · App: Options Analytics · Definitions: glossary · All: every article