What the page is for
The chain is the page most traders open first: calls on the left, strikes in the middle, puts on the right, NSE-style.
If you want the concepts behind reading any chain — why OI walls matter, what PCR can and cannot tell you — start with option chain analysis. This post is about the specific page in Options Analytics: the cards along the top, the sentiment score, the strategy grid, and the controls on the board itself.
It covers index options, stock options and MCX options. Focus the symbol box and a shortlist appears (NIFTY, SENSEX, BANKNIFTY and the main MCX contracts); typing searches the full list of stocks and indices. The expiry dropdown lists every available expiry, nearest first, with days to expiry next to each.
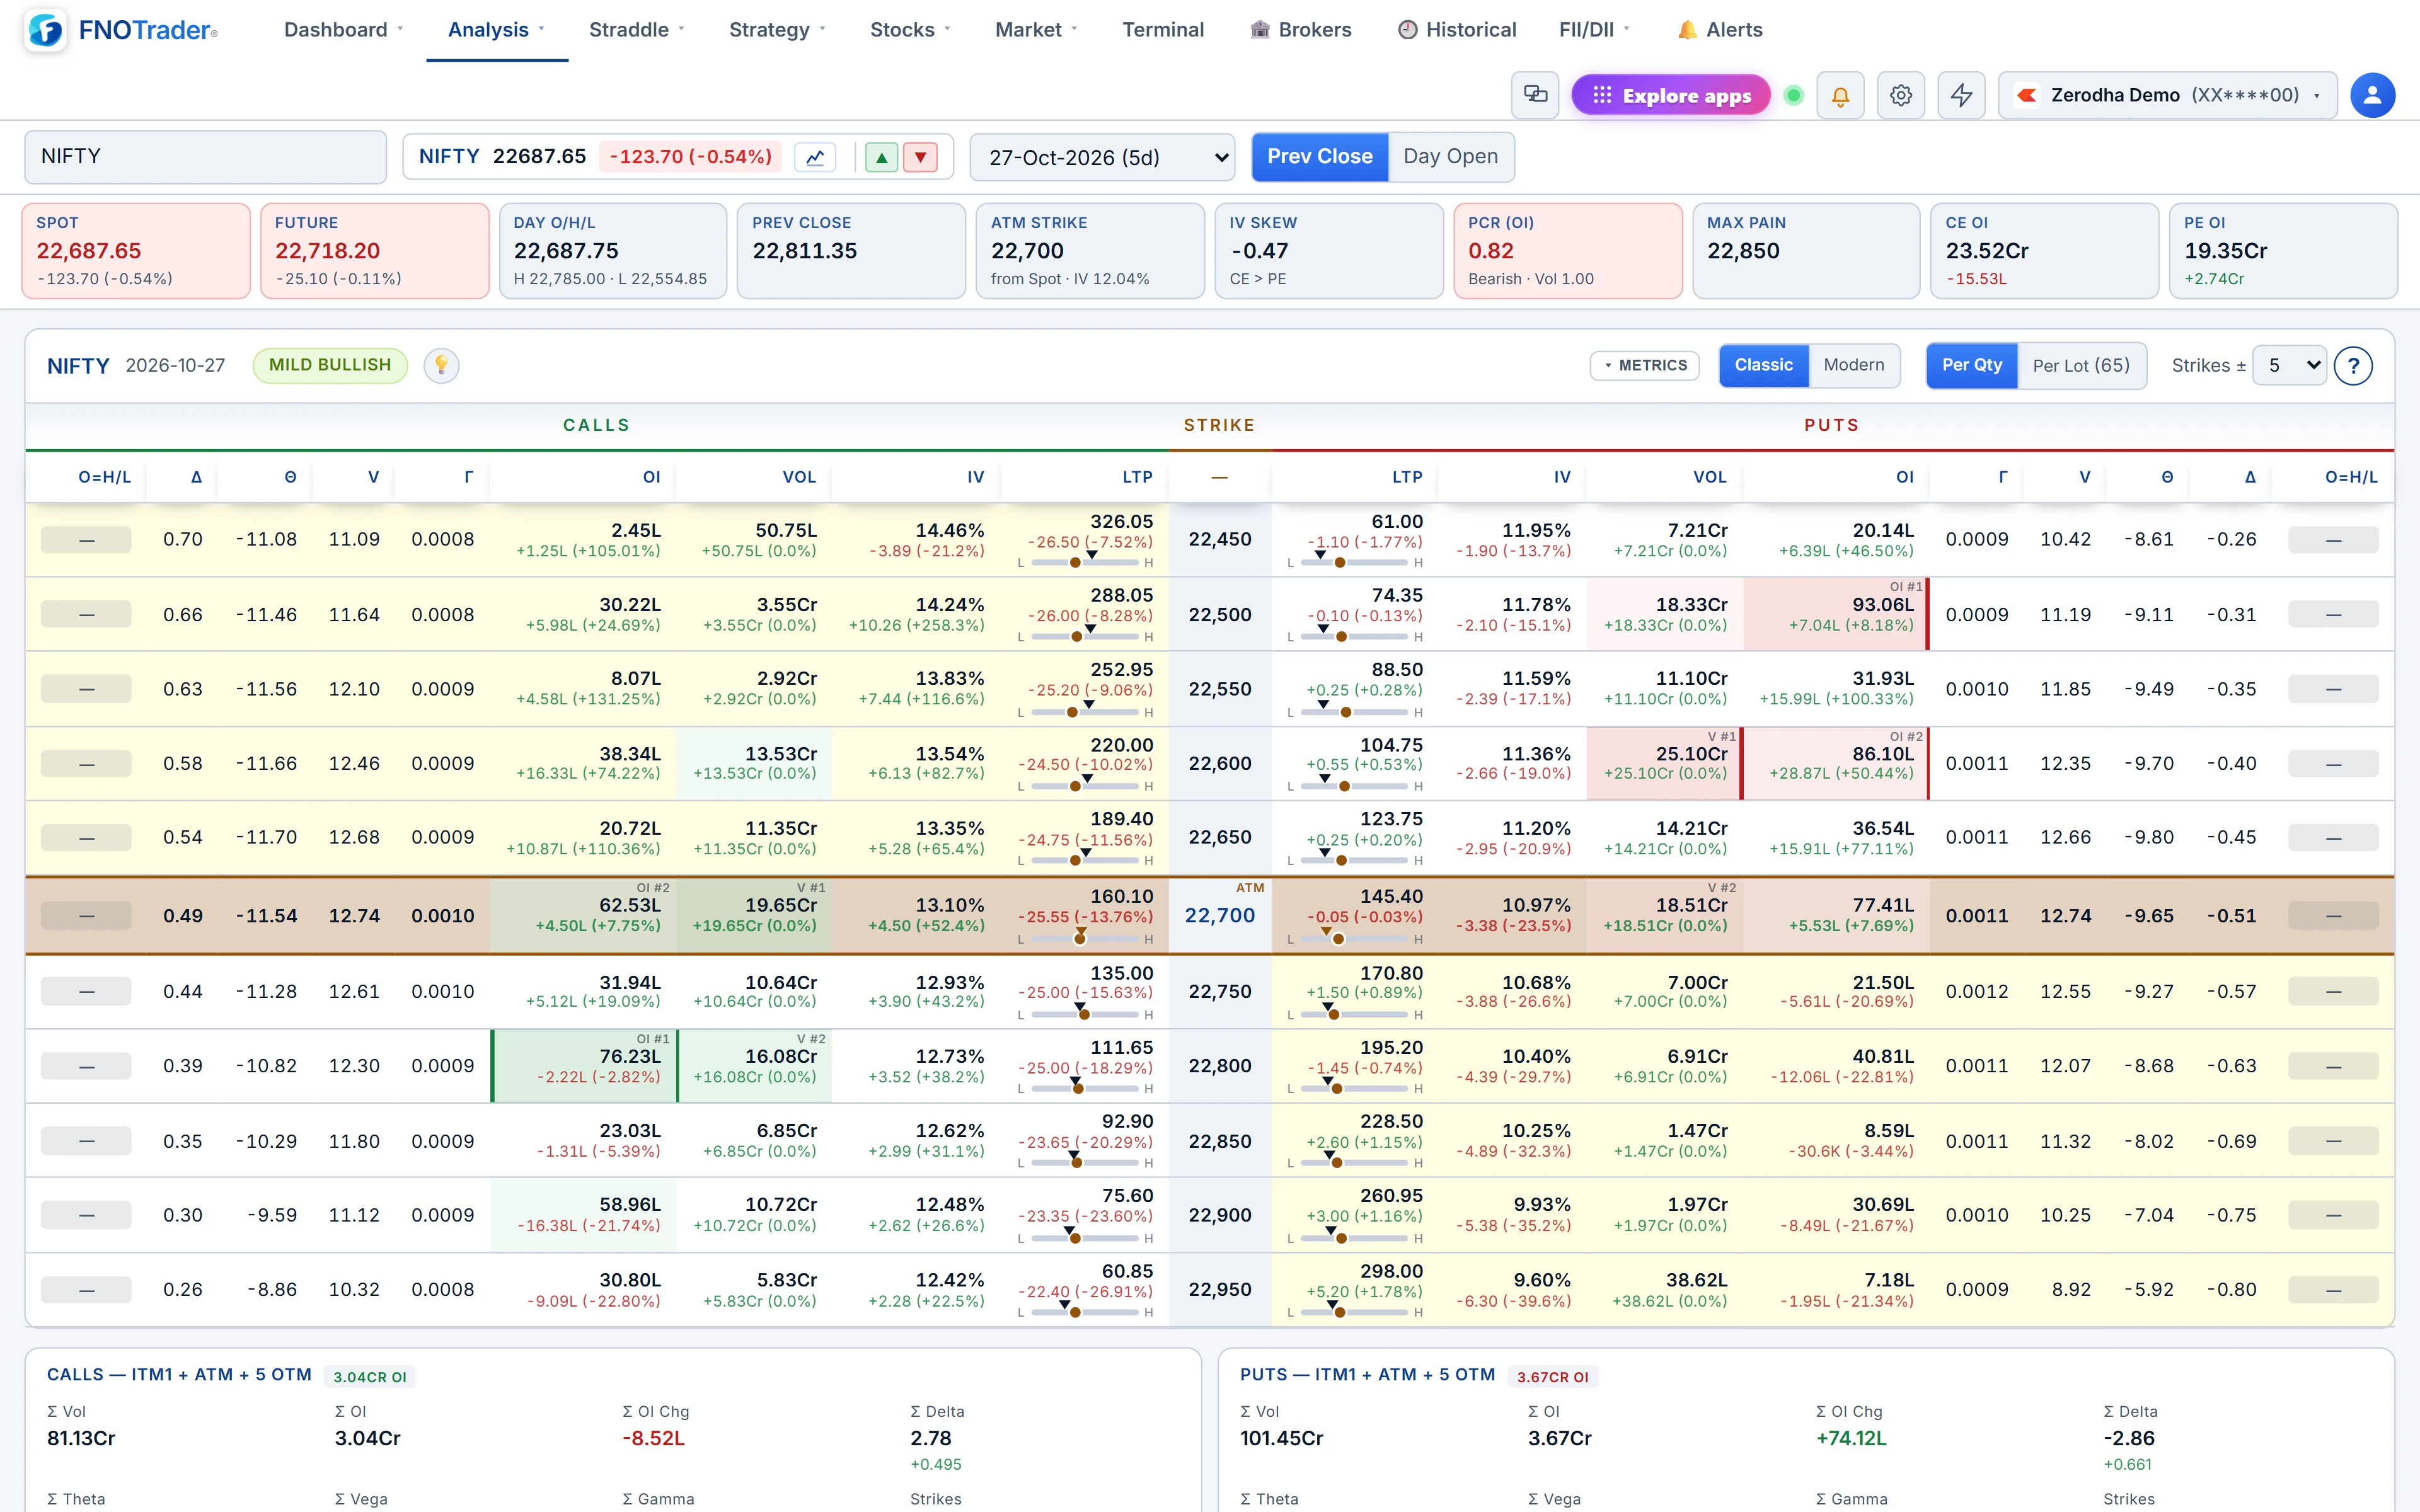
The stat cards, and exactly what each computes
| Card | What it shows |
|---|---|
| Spot | Underlying price and change, tinted green or red. For MCX, where there is no spot, the front-month future stands in. |
| Future / Synth.Fut | The futures price, and for NIFTY and SENSEX weeklies a synthetic future: ATM strike + CE LTP − PE LTP. |
| ATM Strike | The strike nearest spot — or nearest the synthetic future on NIFTY and SENSEX weeklies — with ATM IV, the average of the CE and PE IV at that strike. |
| IV Skew | PE IV five strikes below ATM minus CE IV five strikes above ATM. Positive means puts are priced richer. |
| PCR (OI) | Total PE OI ÷ total CE OI across the whole chain, labelled Bullish above 1.15 and Bearish below 0.85, with volume PCR underneath. |
| Max Pain | The strike at which option buyers' total intrinsic value at expiry would be smallest, using the full chain. |
| CE OI / PE OI | Full-chain total OI with the net change since the previous session. |
Day open/high/low and previous close sit alongside. IV Skew, PCR, Max Pain and the OI cards are clickable and take you to the matching analysis page. A Metrics button hides the strip when you want more room for the board.
How the sentiment score and suggested strategies work
The sentiment chip is a points score, not a black box. Each input adds or subtracts:
- PCR: +2 at 1.3 or above, +1 at 1.0 or above, −1 at 0.9 or below, −2 at 0.7 or below.
- Spot vs Max Pain: −1 if spot is more than 0.5% above it, +1 if more than 0.5% below.
- IV skew: −1 above +1.0, +1 below −1.0.
- OI flow: +2 when PE OI is rising while CE OI falls, −2 for the reverse.
- Spot change: +1 above +0.3%, −1 below −0.3%.
- Buildup counts: +2 when CE long buildups and PE short buildups each outnumber their opposite by more than 2; −2 for the mirror.
A total of 6 or more reads Extremely Bullish, 3 or more Bullish, 1 or more Mild Bullish, and the same thresholds below zero for the bearish side; anything else is Neutral.
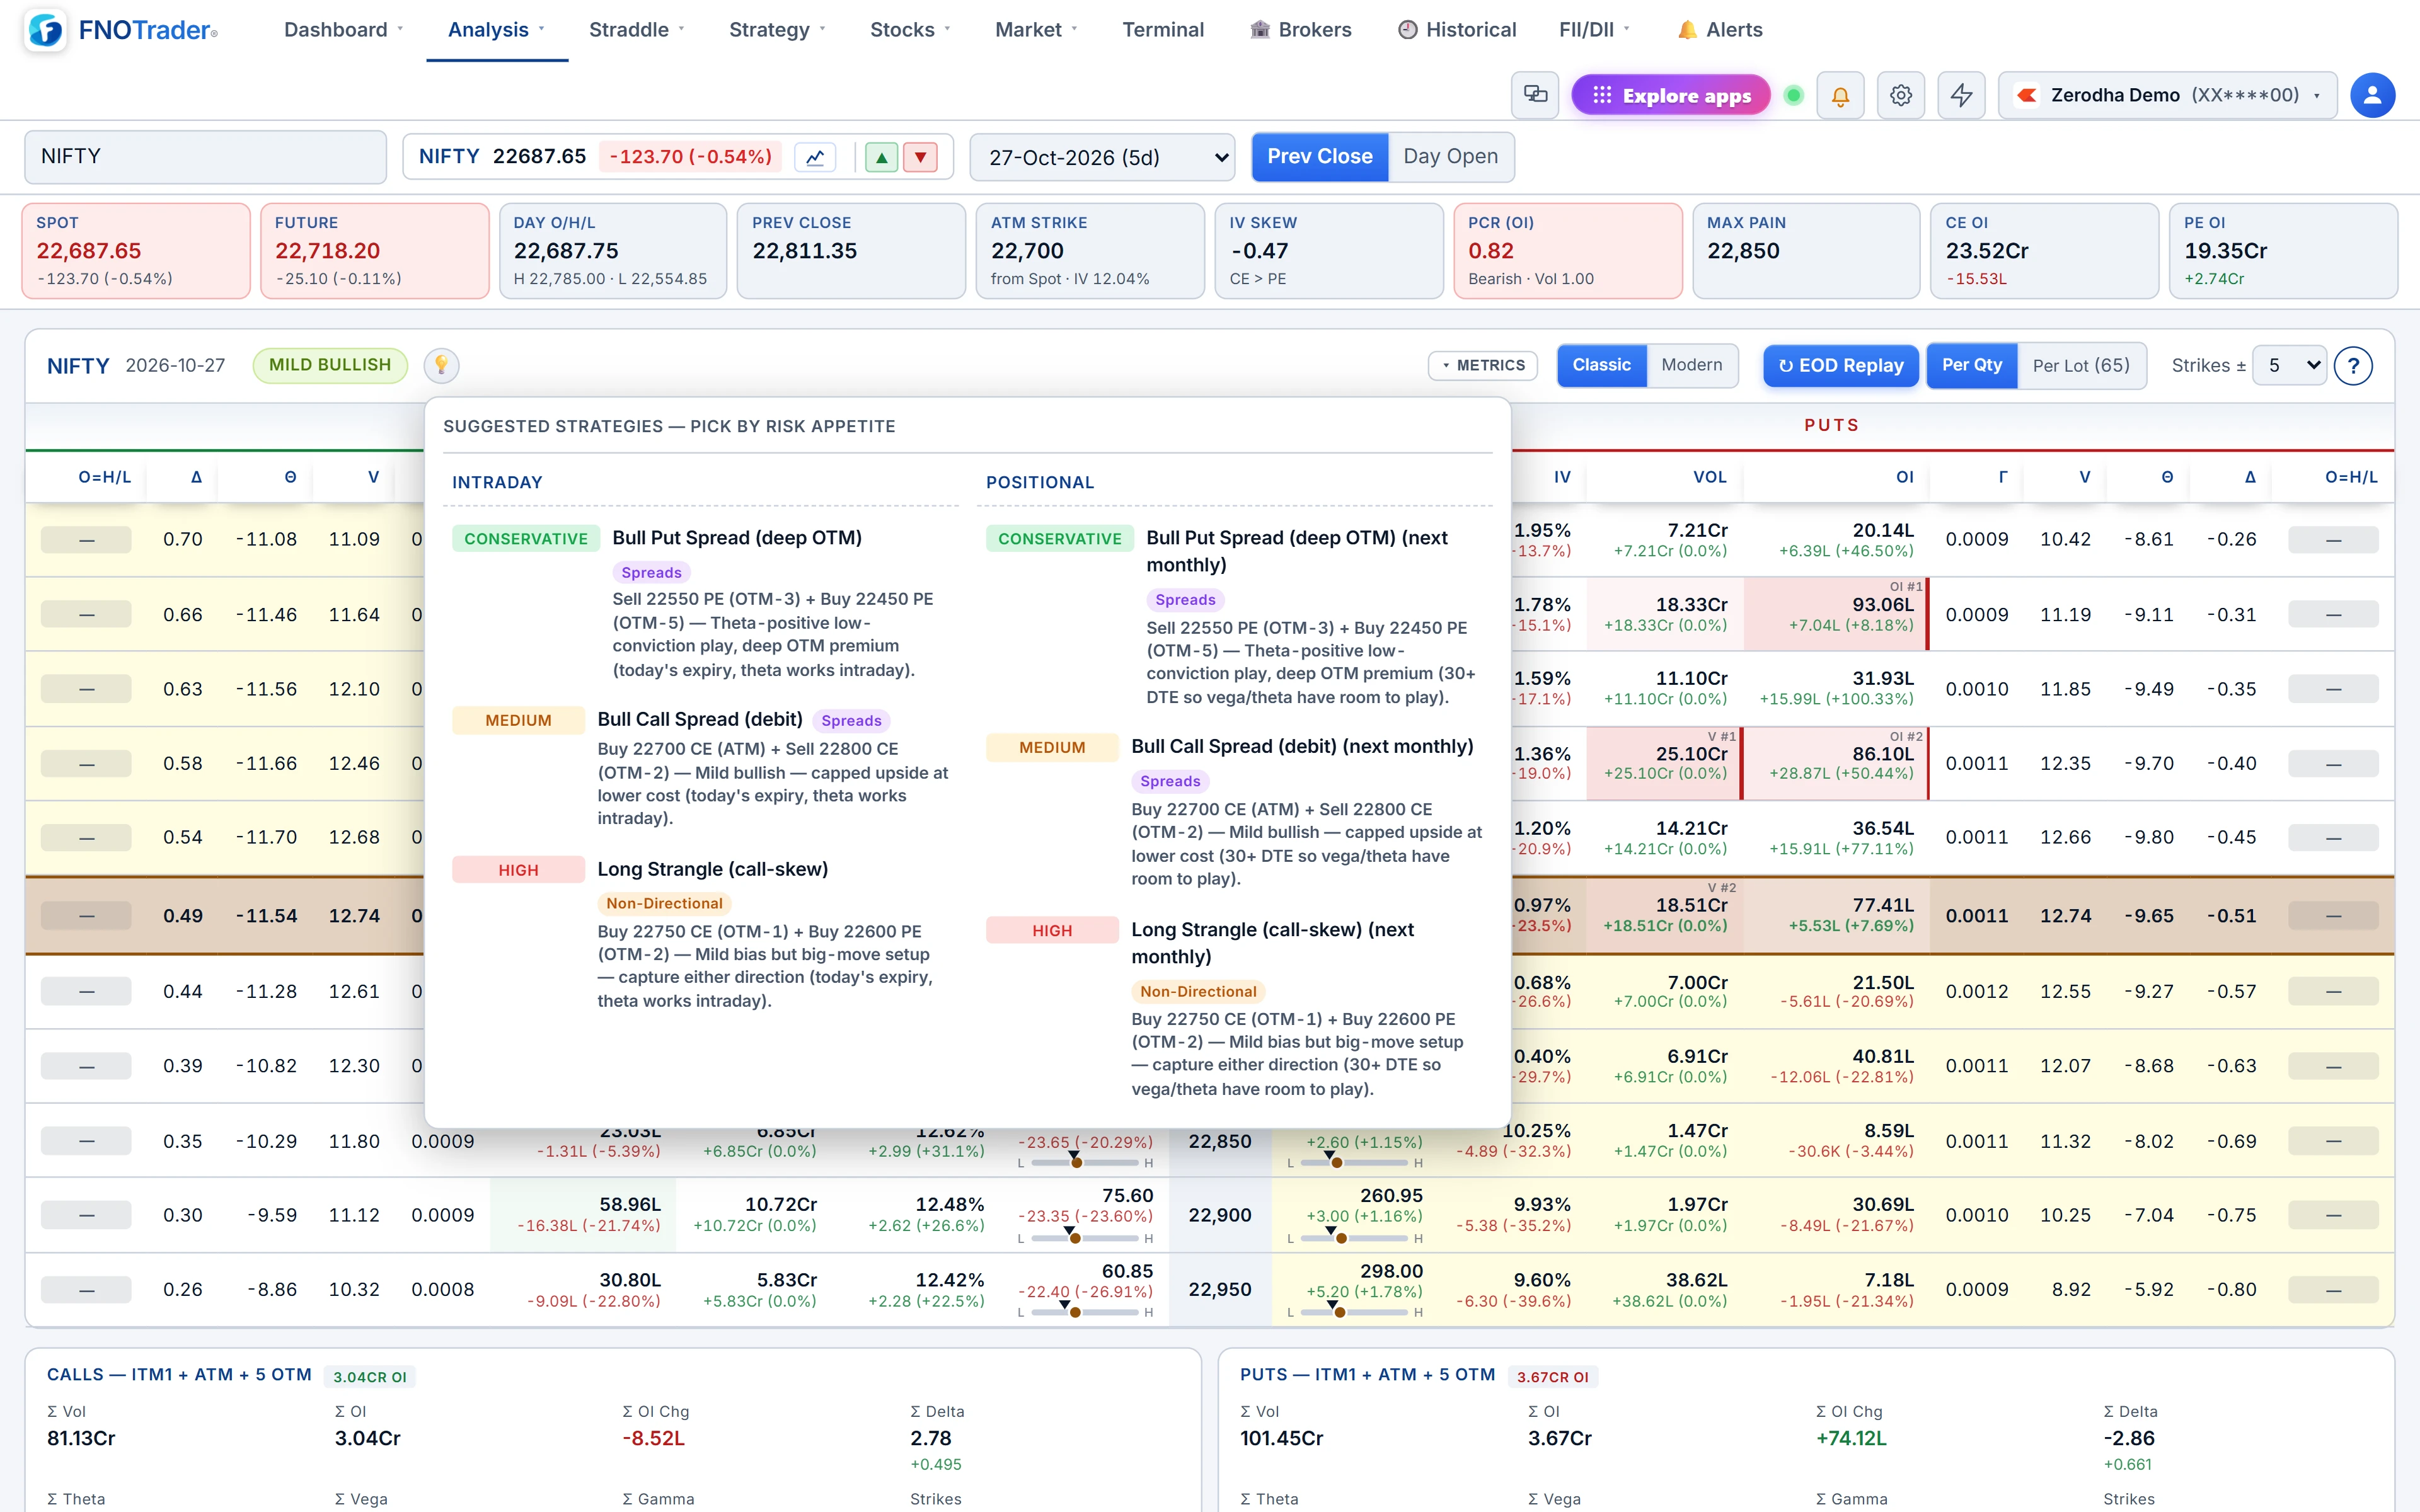
The 💡 button next to it opens the strategy grid: Intraday and Positional columns, each with a Conservative, Medium and High-risk card. Every card names its legs with real strikes from the board — for example a bull put spread one and three strikes below ATM on a Bullish read, or an iron condor with wings two and five strikes out on a Neutral read when ATM IV is 24% or higher. When IV is low (under 14%) a Neutral read switches to long-volatility ideas such as a calendar or long straddle. The cards are a starting point to study, not an order.
Layouts, columns and the board itself
Classic is a fixed, mirrored table: Greeks, OI, volume, IV and LTP on each side, each cell carrying its change underneath, and a low–high range bar with VWAP marked inside the LTP cell. Modern splits the board into three synced panes, keeps the header fixed, scrolls back to ATM when it moves, and adds a Columns menu.
Modern's columns include buildup tag, trend, delta, OI, OI change and OI change %, last trade time, low–high, change, bid, ask and LTP per side, with IV, IV change, and per-strike OI PCR and volume PCR in the centre. Gamma, theta, vega, volume, VWAP and an O=H / O=L flag can be switched on. A strike with no trade for five minutes gets an illiquid marker.
The ATM row is amber. ITM strikes on each side get a pale tint, measured from the ATM strike. The top three strikes by OI and by volume on each side are graded and tagged, and Modern draws an OI bar inside each OI cell scaled to that side's largest strike.
- Strikes ±: 5 (default), 10, 15, 20, 30, 50 or All around ATM.
- Per Qty / Per Lot: Per Lot multiplies prices and Greeks by the lot size; OI and volume stay raw.
- Change basis: Prev Close or Day Open, which changes the Chg column and the buildup tag in Modern.
- LTP hover: rest on any LTP for a one-day 5-minute chart of that contract, with optional VWAP, OI and volume.
- Strike click: opens CE and PE price and OI history for that strike.
A worked Max Pain example
Hypothetical three-strike chain: 24,000 has CE OI 10 lakh and PE OI 30 lakh; 24,100 has 20 lakh and 20 lakh; 24,200 has 40 lakh CE and 5 lakh PE.
Test an expiry at 24,100. Calls below it pay: 24,000 CE is 100 points in the money × 10 lakh = 1,000 lakh-points. Puts above it pay: 24,200 PE is 100 points × 5 lakh = 500. Total 1,500.
Test 24,000: only the 24,100 and 24,200 puts are in the money — 100 × 20 + 200 × 5 = 3,000. Test 24,200: the calls pay 200 × 10 + 100 × 20 = 4,000. The smallest total is at 24,100, so that is Max Pain. The card does exactly this across every strike in the chain.
The mistake is treating it as a target. Max Pain moves as OI moves and says nothing about timing; it is one input to the score above, worth a single point.
What updates live, and what does not
How fresh the numbers are. With a broker connected, the page updates live, tick by tick. Without one it refreshes once a minute with the last completed minute, and without a plan the data is delayed by 15 minutes. Connecting a broker upgrades the page to live without a reload.
Prices, OI and the ATM row update with each tick. IV, Greeks, PCR, Max Pain, skew, sentiment and the strategy grid are recalculated when the chain is reloaded — change the expiry or basis, or reopen the page, to refresh them during a fast move.
Where to find it
- Open Options Analytics and choose Analysis → Option Chain.
- Pick the symbol and expiry, then Classic or Modern.
- Set the strike range and Per Lot if you think in lots.
- Click 💡 for suggested strategies; click a stat card to jump to its page, such as the Open Interest chart.
Common questions
How is PCR calculated on the FNOTrader option chain?
It is total put open interest divided by total call open interest across the whole chain for the selected expiry. Volume PCR, the same ratio on volume, is shown underneath.
How is IV skew calculated?
Put IV five strikes below ATM minus call IV five strikes above ATM. A positive number means downside protection is priced richer than upside calls.
Where do the suggested strategies come from?
From a points score built from PCR, spot versus Max Pain, IV skew, OI flow, spot change and buildup counts. Each sentiment level maps to a fixed set of strategies, with strikes stepped from ATM on the live board. They are for study, not recommendations.
What does Per Lot do on the option chain?
It multiplies premium, change, VWAP, bid/ask and the Greeks by the contract's lot size, so you see the rupee value of one lot. OI and volume are unchanged.
Why does the ATM sometimes differ from the strike nearest spot?
On NIFTY and SENSEX weeklies the ATM is taken from the synthetic future (strike plus call minus put at ATM), which reflects carry better than spot.
More on Options App
More in Options App · App: Options Analytics · Definitions: glossary · All: every article