Why a down day is a good test
When the index drops 1.5% and a stock finishes flat, or recovers faster than the index afterwards, someone was buying while everyone else was selling. That is relative strength in its most literal form.
The Leaders page has two tabs. Leaders after a fall anchors to a specific market down day and ranks what happened next. Momentum 100 ignores single days and ranks the steadiest one-year trends. For how relative strength plays out across sectors, see sector rotation.
Leaders after a fall: how it works
| Setting | What it does |
|---|---|
| Universe | NIFTY 500 (default), Midcap 150, Small Cap 250, Micro Cap 250 or All NSE. The benchmark is that universe's own index; All NSE uses NIFTY 500. |
| Fall of at least | How big a day's drop in the benchmark counts as a down day: −0.5%, −1.0% (default), −1.5% or −2.0%. |
| Down day | Every qualifying day in the last 30 sessions is listed; the latest is used unless you pick another. If there is none, the most recent one within about six months is used, so the page is never empty. |
Every stock in the universe is then ranked by its % move from the down day's close to now. If the down day is today, there is no “since” yet, so stocks are ranked by the down day's own move instead — who bucked today's fall hardest.
Stage, Mansfield RS and the trend template score are shown as columns but do not filter or weight this ranking; it is pure performance. You can re-sort by the fall-day move, move since the fall, either one versus NIFTY 50 or versus the universe's index, 1D to 1Y returns, setup score, Mansfield RS or trend template.
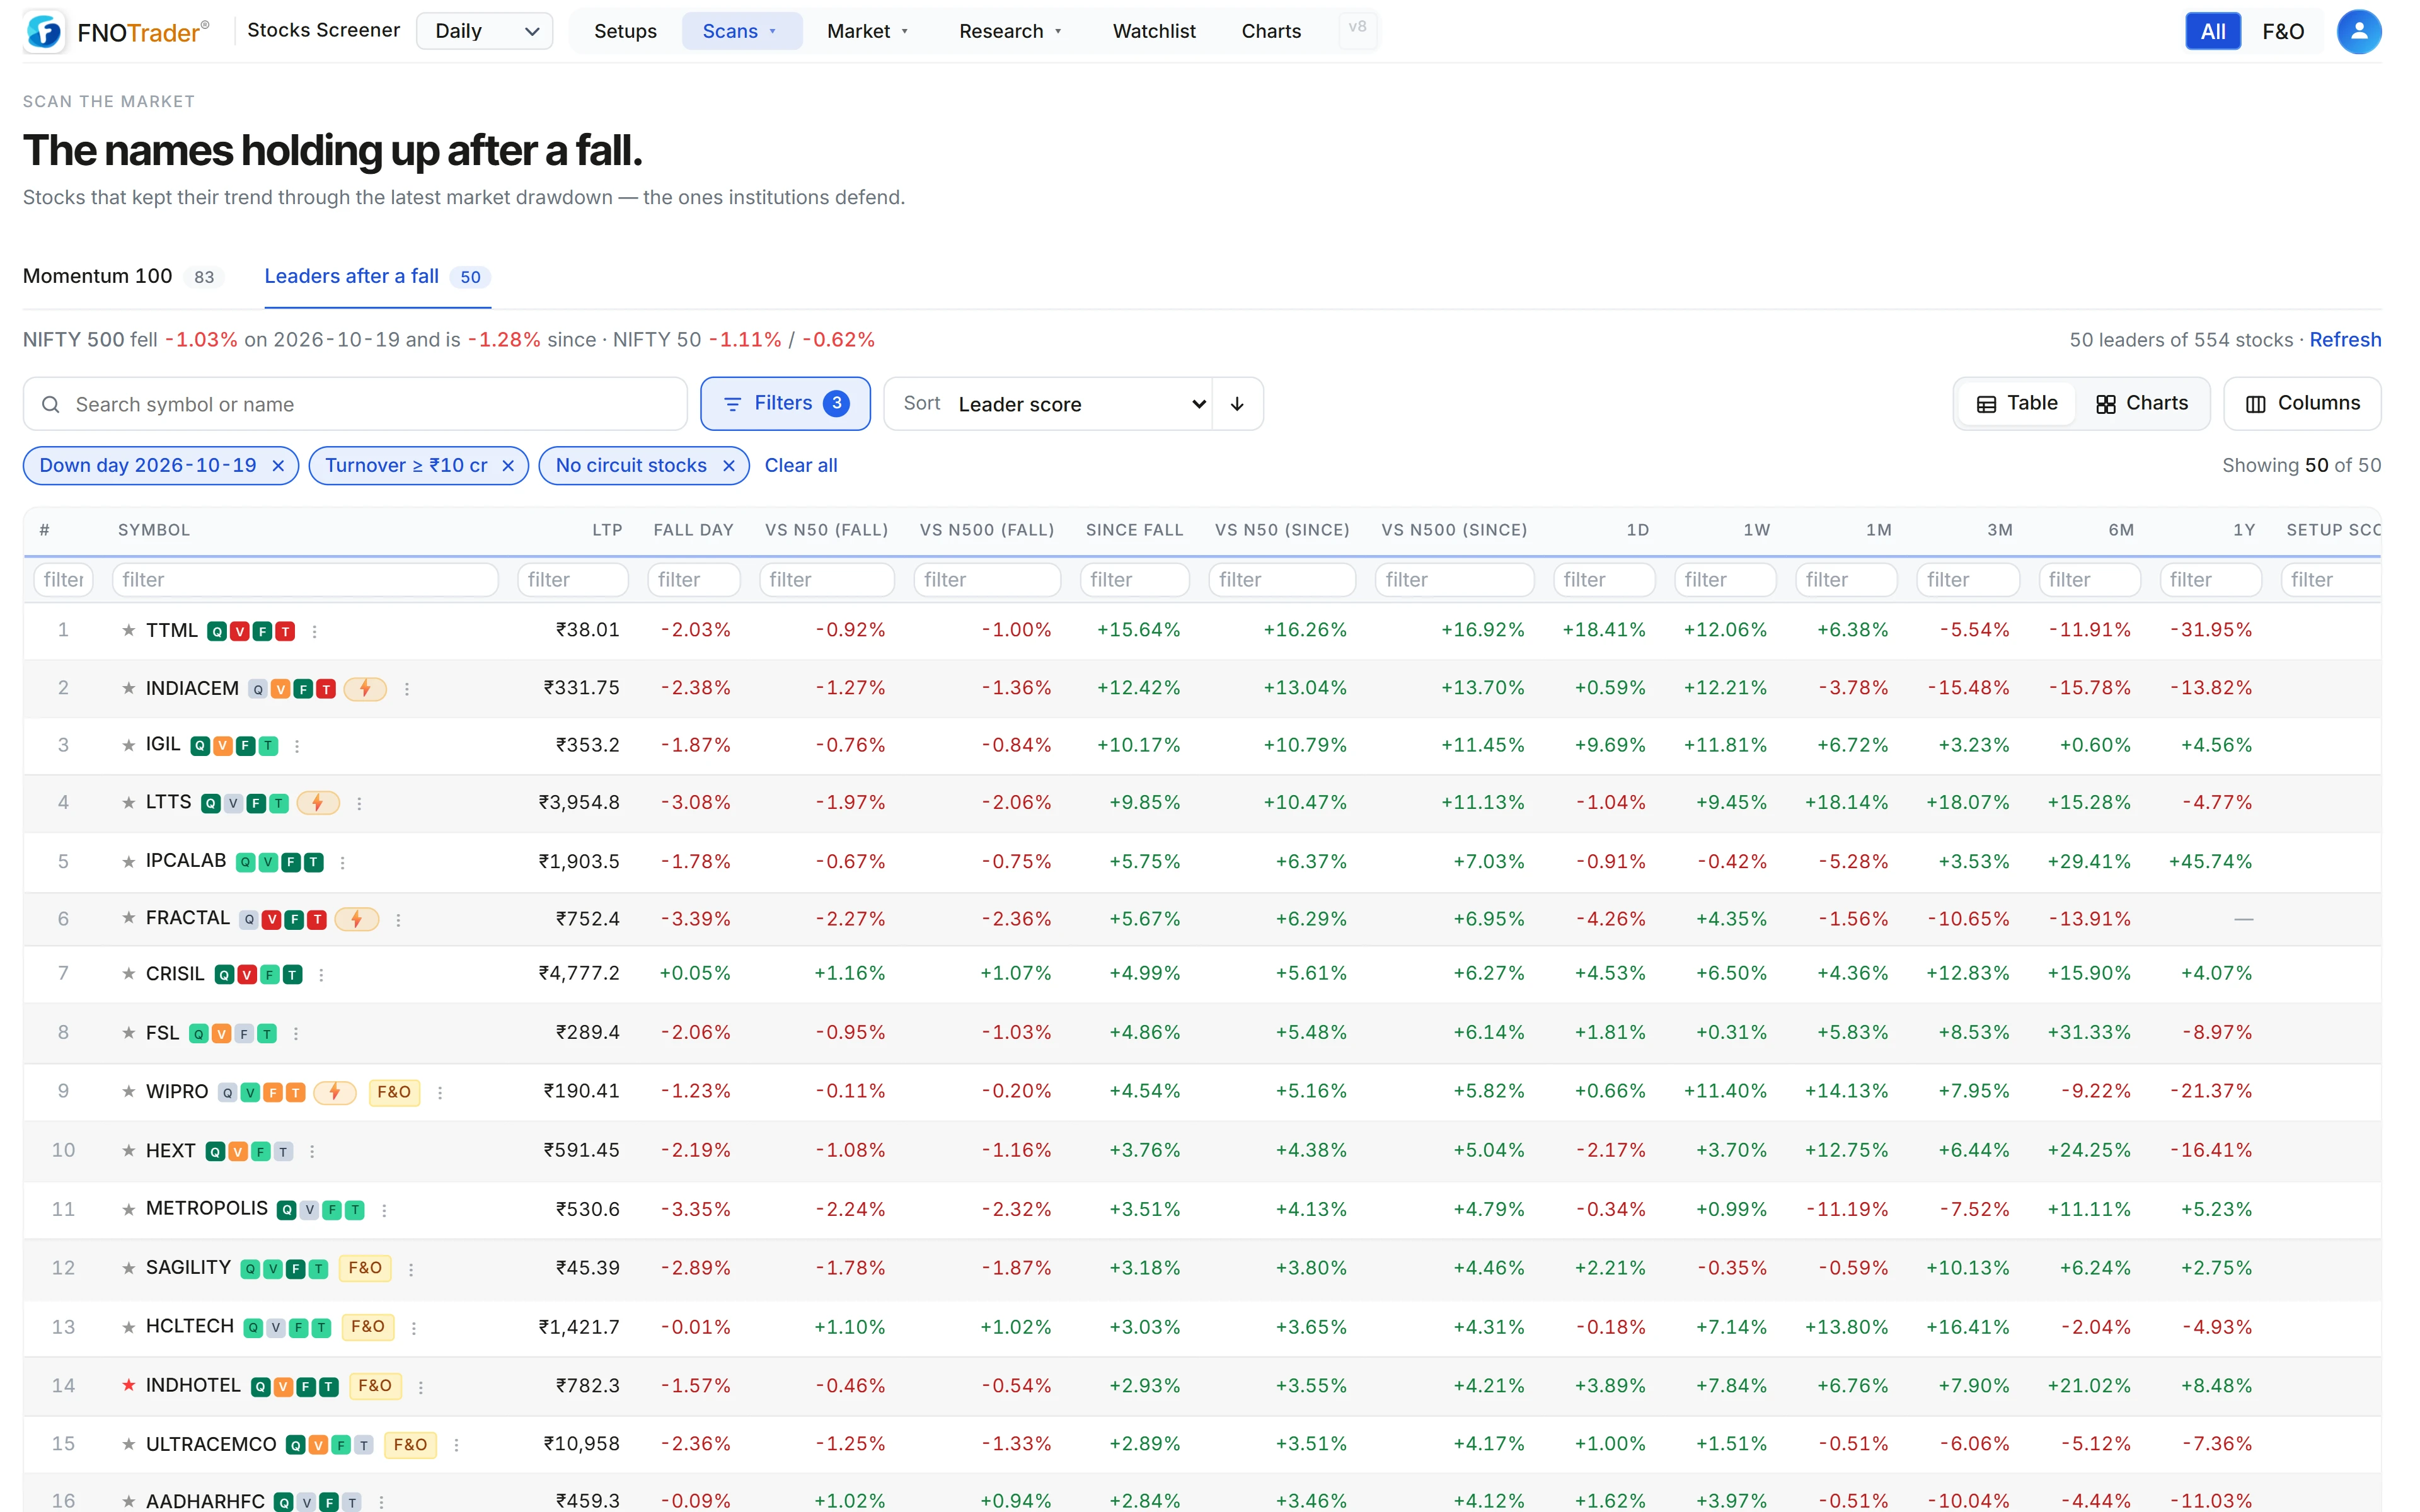
Worked example: reading a leader
Hypothetical numbers. NIFTY 500 fell 1.4% on the down day and is up 0.8% since.
- Stock A fell 0.5% on the day and is up 6.0% since. Versus the index since: 6.0 − 0.8 = +5.2 points. It sits near the top.
- Stock B fell 3.0% on the day and is up 2.0% since: +1.2 points versus the index since, but it lost twice as much as the index on the day itself.
Ranked by “since the fall”, A is ahead of B. Re-sorting by “vs NIFTY 50 on fall day” shows you the stocks that were defended on the day, a different and equally useful list.
Momentum 100: how it ranks
Momentum 100 is the top 100 NSE stocks by risk-adjusted momentum: the 12-1 month return (price 21 sessions ago versus 252 sessions ago, which skips the most recent month) divided by the stock's annualised volatility over the last year.
Before ranking, a stock must pass every gate:
- Price at least ₹10 and a full year of history.
- Traded on at least 90% of the last 21 sessions, and traded on the latest one.
- Median daily turnover of at least ₹2 crore over the last 63 sessions.
- Circuit-locked days (open = high = low = close) no more than 5% of the last 63 traded sessions.
- Annualised volatility no higher than 100%.
- In a Weinstein Stage 2 uptrend, with a trend template score of at least 6 of 8.
The list carries an “as of” date and is a snapshot for that session.
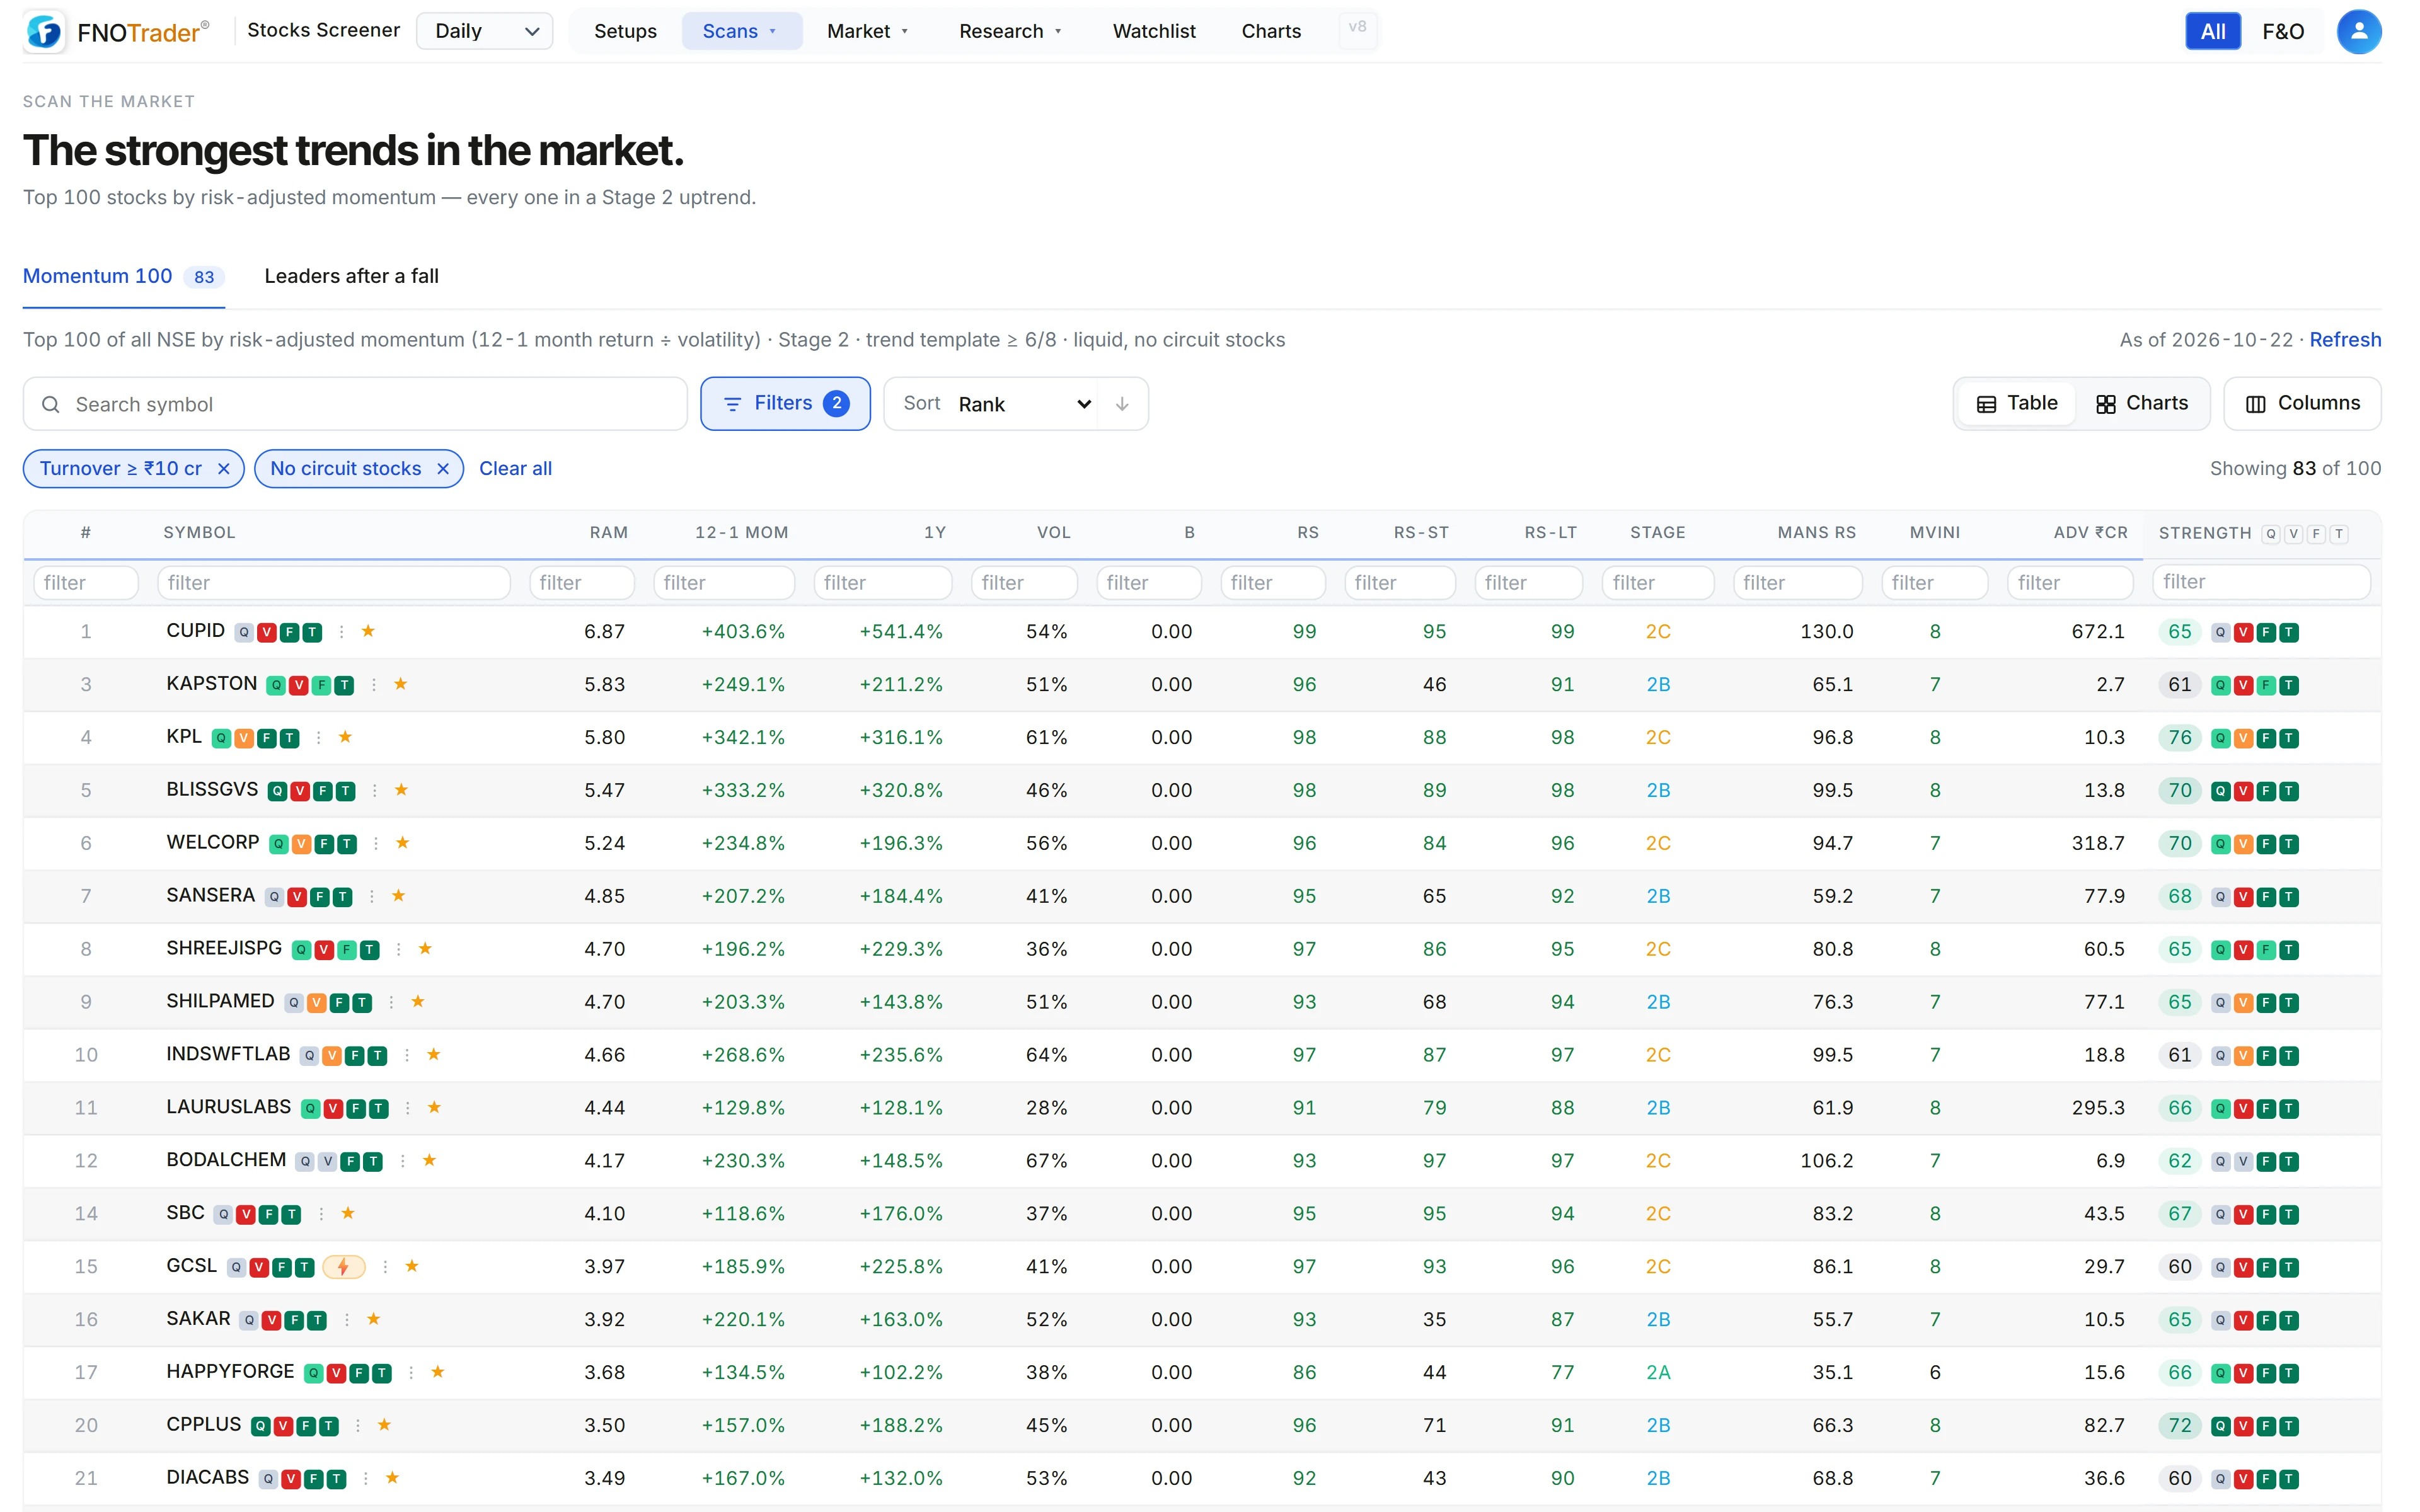
Worked example: why dividing by volatility matters
Two hypothetical stocks:
- Stock C: 12-1 return 30%, volatility 40% → 30 / 40 = 0.75.
- Stock D: 12-1 return 45%, volatility 75% → 45 / 75 = 0.60.
D went up more, but C ranks higher, because C got its return with far less swinging around. Ranking by raw return favours stocks that lurch; this ranking favours stocks that trend. It is a description of the past year, not a forecast.
Limits
- One down day is a small sample. A stock can hold up on one fall for reasons that have nothing to do with leadership — a result, a block deal.
- Momentum lists turn over. A stock drops off when its trend or one of the gates breaks.
- The global filter (turnover, circuits, GSM, price) applies to both tabs.
Where to find it
- In the Stocks app, open Scans → Leaders.
- Choose the Momentum 100 or Leaders after a fall tab.
- For Leaders after a fall, open Filters to change universe, down day or fall size.
- Switch to charts to see each stock with its chart; chart settings set the candle size and period.
Common questions
How do I find stocks that are outperforming during a market fall?
Open Scans, then Leaders, in the FNOTrader Stocks app and choose Leaders after a fall. It anchors to a recent day the index fell by at least 1% and ranks stocks by how they have moved since.
What is 12-1 momentum?
The return from 12 months ago to 1 month ago, skipping the most recent month. Momentum 100 divides it by the stock's one-year volatility to rank risk-adjusted momentum.
Which stocks are excluded from Momentum 100?
Stocks under ₹10, illiquid or circuit-prone stocks, those with volatility above 100%, and anything not in a Stage 2 uptrend with a trend template score of at least 6 of 8.
Does Leaders after a fall filter by stage?
No. Stage, Mansfield RS and trend template are shown as columns, but the ranking is pure performance since the down day.
More on Stocks App
More in Stocks App · App: Stocks Scanner · Definitions: glossary · All: every article