What the three columns answer
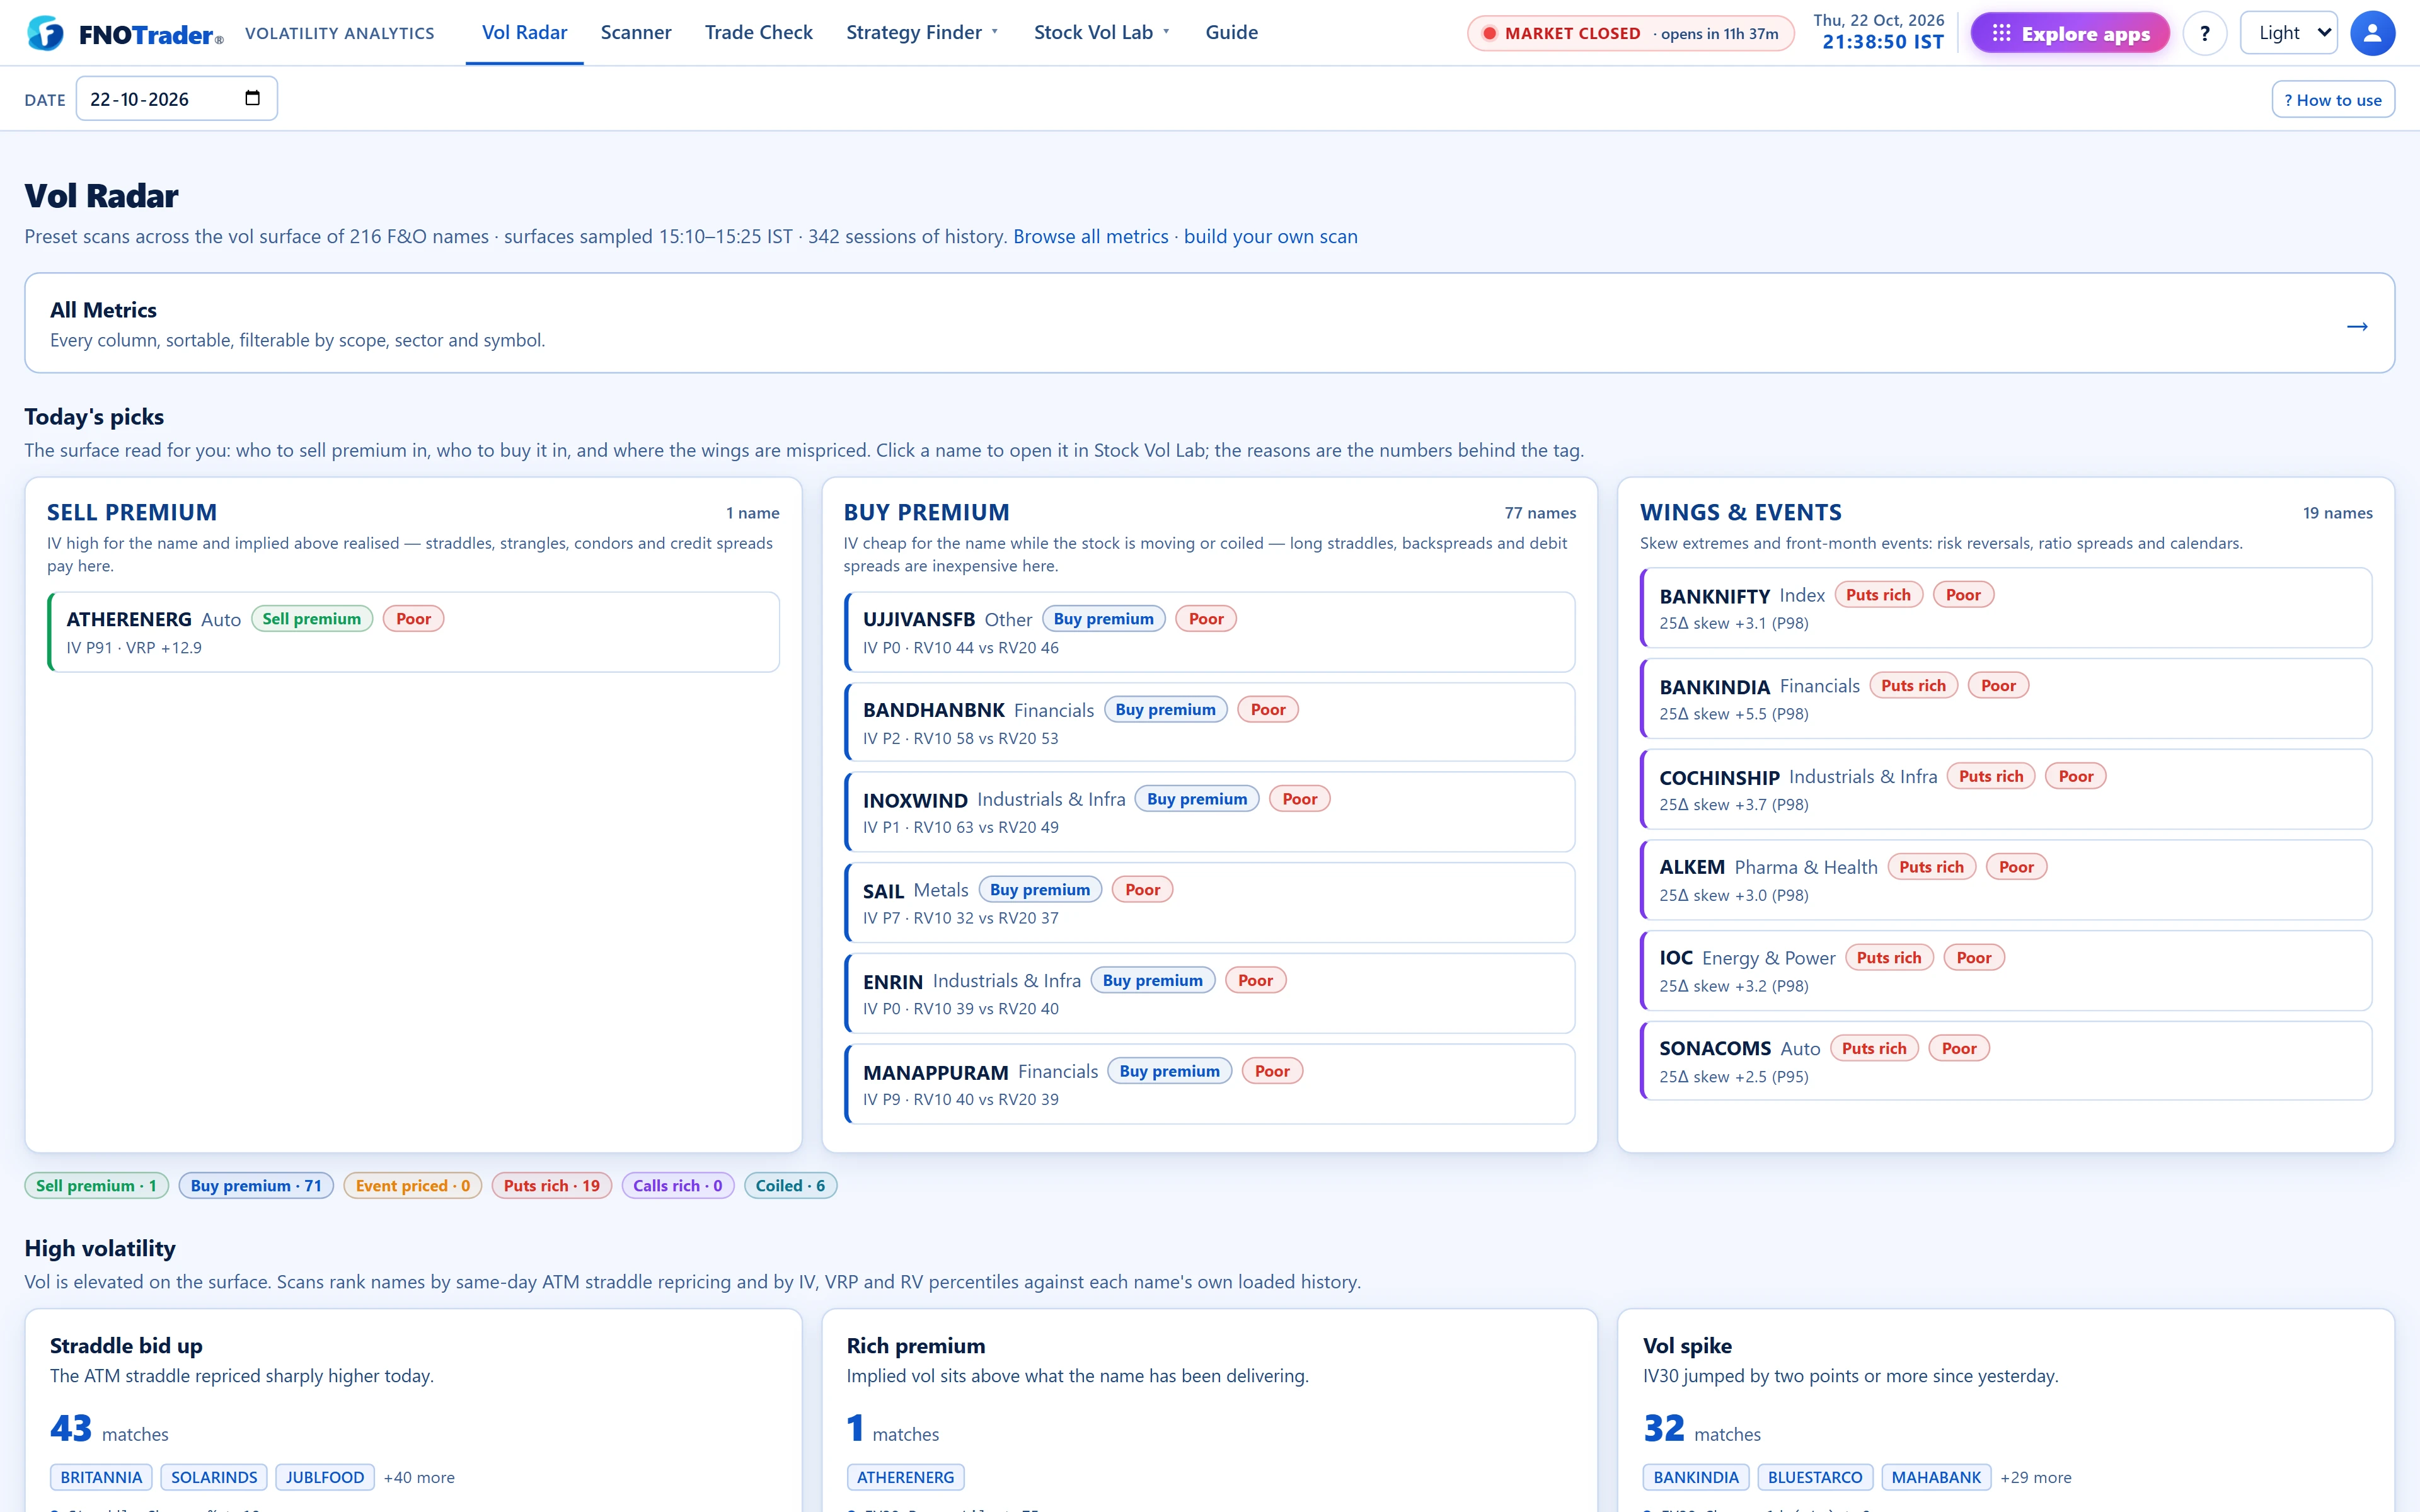
Today’s picks sit at the top of Vol Radar. Every F&O name gets at most one regime tag, and the tags are grouped into three columns: Sell premium, Buy premium and Wings & Events.
Each card shows the name, its sector, the tag, a liquidity chip, and the numbers that produced the tag (for example “IV P68 · VRP +4.0”). Each column lists its top six by strength and shows how many names qualify in total. A row of chips underneath counts every tag for the day; clicking one opens All Metrics.
Read the tags as a description: “options on this name are priced high relative to its own year and to what it has been moving”. Whether that is worth trading depends on the structure, the event calendar and the book — which is what the other pages are for.
The exact rules behind each tag
Terms: IV %ile is the front-expiry ATM IV percentile over the last 252 sessions; VRP = IV30 − 20-day close-to-close realised vol, in vol points; slope = IV30 − IV90; skew = 25Δ put IV − 25Δ call IV.
| Tag (column) | Rule |
|---|---|
| Sell premium (Sell) | IV %ile ≥ 60 and VRP ≥ +3 |
| Buy premium (Buy) | IV %ile ≤ 30 and either VRP ≤ +1 or RV10 > 1.15 × RV20 |
| Coiled (Buy) | IV %ile ≤ 20 and RV20 percentile ≤ 20 |
| Event priced (Wings & Events) | slope ≥ +1.5 pts and IV %ile ≥ 50 |
| Puts rich (Wings & Events) | skew percentile ≥ 85 and skew ≥ +1 pt |
| Calls rich (Wings & Events) | skew percentile ≤ 15 and skew ≤ −1.5 pts |
If a name meets more than one rule, the tag with the strongest score wins; if it meets none it is Neutral and does not appear in the columns.
Why each rule has two conditions
High IV alone is not rich. A stock whose IV is at its 80th percentile because it is genuinely moving 3% a day is not overpriced. Sell premium therefore also needs implied above realised by three points: the market is charging for more movement than is happening.
Low IV alone is not cheap. Buy premium needs either the carry to be gone (VRP at +1 or below) or short-term movement accelerating (10-day realised more than 15% above 20-day). Coiled covers the other case: both implied and realised near the bottom of their year.
An inverted front (IV30 well above IV90) while IV is elevated usually means a known event sits inside the near expiry — results, a policy date, an index change. Puts rich and Calls rich flag a wing that is extreme against the name’s own skew history, not just against other names.
A worked example
Three hypothetical names on one day:
- Name A: IV %ile 68, IV30 22%, RV20 18%. VRP = +4. Both Sell conditions hold → Sell premium, card reads “IV P68 · VRP +4.0”.
- Name B: IV %ile 25, IV30 20%, RV20 19.5%, RV10 21%. VRP = +0.5, which is ≤ +1 → Buy premium.
- Name C: IV %ile 72, VRP +1, slope +2.0. Not Sell (VRP under 3), but slope ≥ 1.5 with IV %ile ≥ 50 → Event priced.
Name C is the instructive one: its IV is high, but the extra is concentrated in the front expiry. Selling that front-month straddle is selling the event, not a general premium.
The liquidity chip
Each card carries a Good / Fair / Poor chip from the live order book of the front expiry’s ATM call and put. Each leg is graded on three things and gets the worst of them; the chip shows the worse leg:
| Read | Good | Fair | Poor |
|---|---|---|---|
| 5-level depth (thinner side, in lots) | 25+ | 5–25 | under 5 |
| Spread (ask − bid) / mid | ≤ 0.5% | ≤ 1.5% | wider |
| Prints per minute | 10+ | 2–10 | under 2 |
Hover the chip for the spread, depth, prints per minute and rupees per lot to cross. Poor means the read may be right but getting in and out costs more. Judge it during the session: after the close and at weekends the book is the last one the exchange sent and usually looks worse.
Where to find it
- Open Volatility Analytics; Vol Radar is the first tab.
- Pick a date in the top bar to see the picks for any past session.
- Click a card to open that name in Stock Vol Lab and check the read on its own history.
- Below the picks are the preset scans — see Radar scans, All Metrics and Scanner.
Common questions
What does Sell premium mean on Vol Radar?
The name's IV percentile is 60 or higher and IV30 is at least three vol points above 20-day realised volatility. It describes expensive options; it is not a recommendation to sell.
Why does a name with very high IV not show as Sell premium?
If realised volatility is close to or above implied, VRP is under +3 and the premium is being earned by real movement. It may instead show as Event priced if the front expiry is inverted.
What is a Coiled tag?
Both the IV percentile and the 20-day realised volatility percentile are at 20 or below: options and the stock are both near the quiet end of their year. It appears in the Buy premium column.
What does the liquidity chip measure?
The live order book of the front-expiry ATM call and put: five-level depth in lots, spread as a share of premium and prints per minute. Each leg takes its worst read and the chip shows the worse leg.
Can a name have more than one regime tag?
It can meet several rules, but only the strongest-scoring tag is shown, so each name appears in at most one column.
More on Volatility Analytics
More in Volatility Analytics · App: Volatility Analytics · Definitions: glossary · All: every article