One surface per name per day
Every page in Vol Lab — Vol Radar, Strategy Finder, Trade Check and Stock Vol Lab — reads from the same object: for each F&O underlying on each trading day, the implied volatility of every usable strike in every listed expiry, plus the summary numbers derived from it (ATM IV, IV30/60/90, 25Δ and 10Δ wings, skew, convexity, straddle).
Because everything is built once and the same way, a number means the same thing on every page. The NIFTY skew you see on the Radar is the skew Trade Check uses to judge your put leg.
The rest of this post is the recipe, in the order the engine applies it.
Step 1 — which prices: the 15:10–15:25 IST sample
For past sessions, each contract’s price is the median of its one-minute closes between 15:10 and 15:25 IST. Not the last traded price, and not a single minute.
The last traded price of a thinly traded strike can be hours old. A single minute can catch a spike. A median over a 16-minute window near the close is a price that the market actually repeated, sampled at the same time for every strike, so the call and the put of a pair are compared like for like.
During market hours, today’s surface is read from the last few minutes of the live one-minute table instead and refreshes through the session.
Step 2 — which strikes count: the quality gates
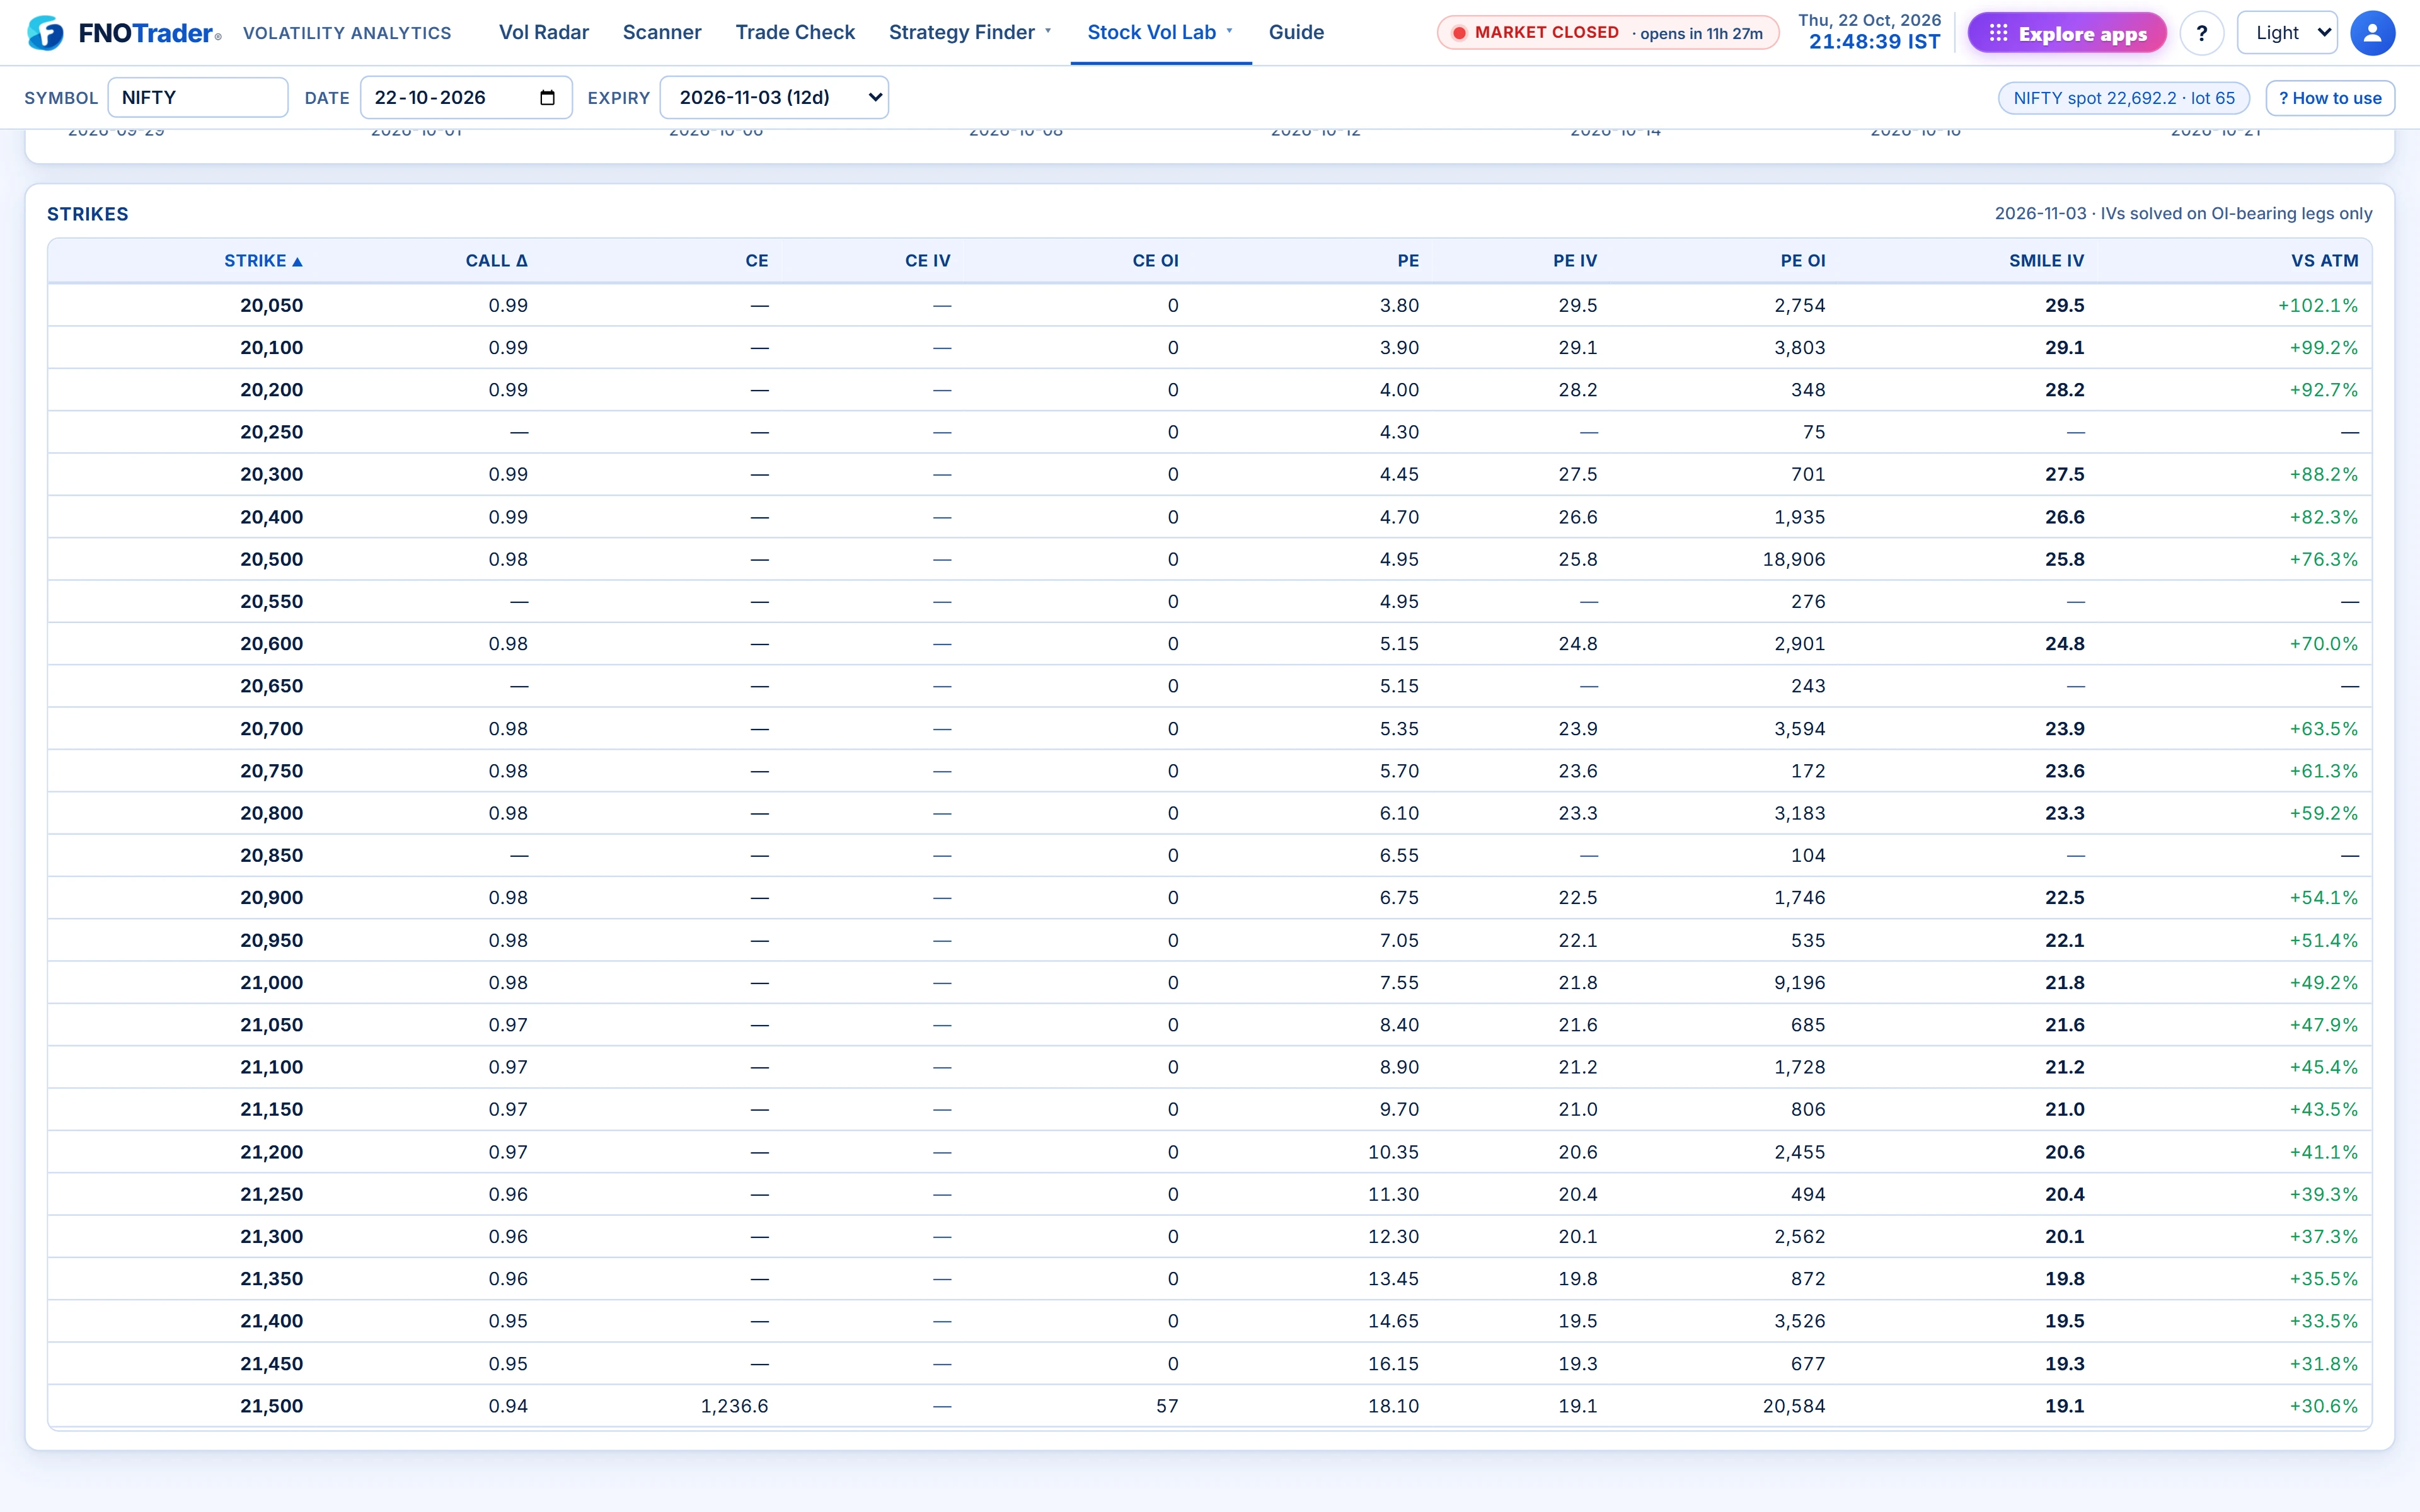
A leg is used only when it has open interest above zero and at least four prints in the sample window. Strikes that fail are shown with a dash and are excluded from every calculation. A few more checks run after that:
- Walking away from the forward, an OTM call or put price must keep falling. A quote that does not is treated as stale and dropped.
- The smile uses the out-of-the-money leg at each strike (all time value, so a stale intrinsic value cannot hide). Within 2% of the forward either leg is accepted.
- Wing IVs that sit far outside the ATM level are ignored as odd prints, and an ATM strike more than 4% from the forward is treated as void.
The cost of these gates is that thin stock chains sometimes show “—” for skew. That is deliberate: no number is better than a wrong one.
Step 3 — the forward, then Black-76
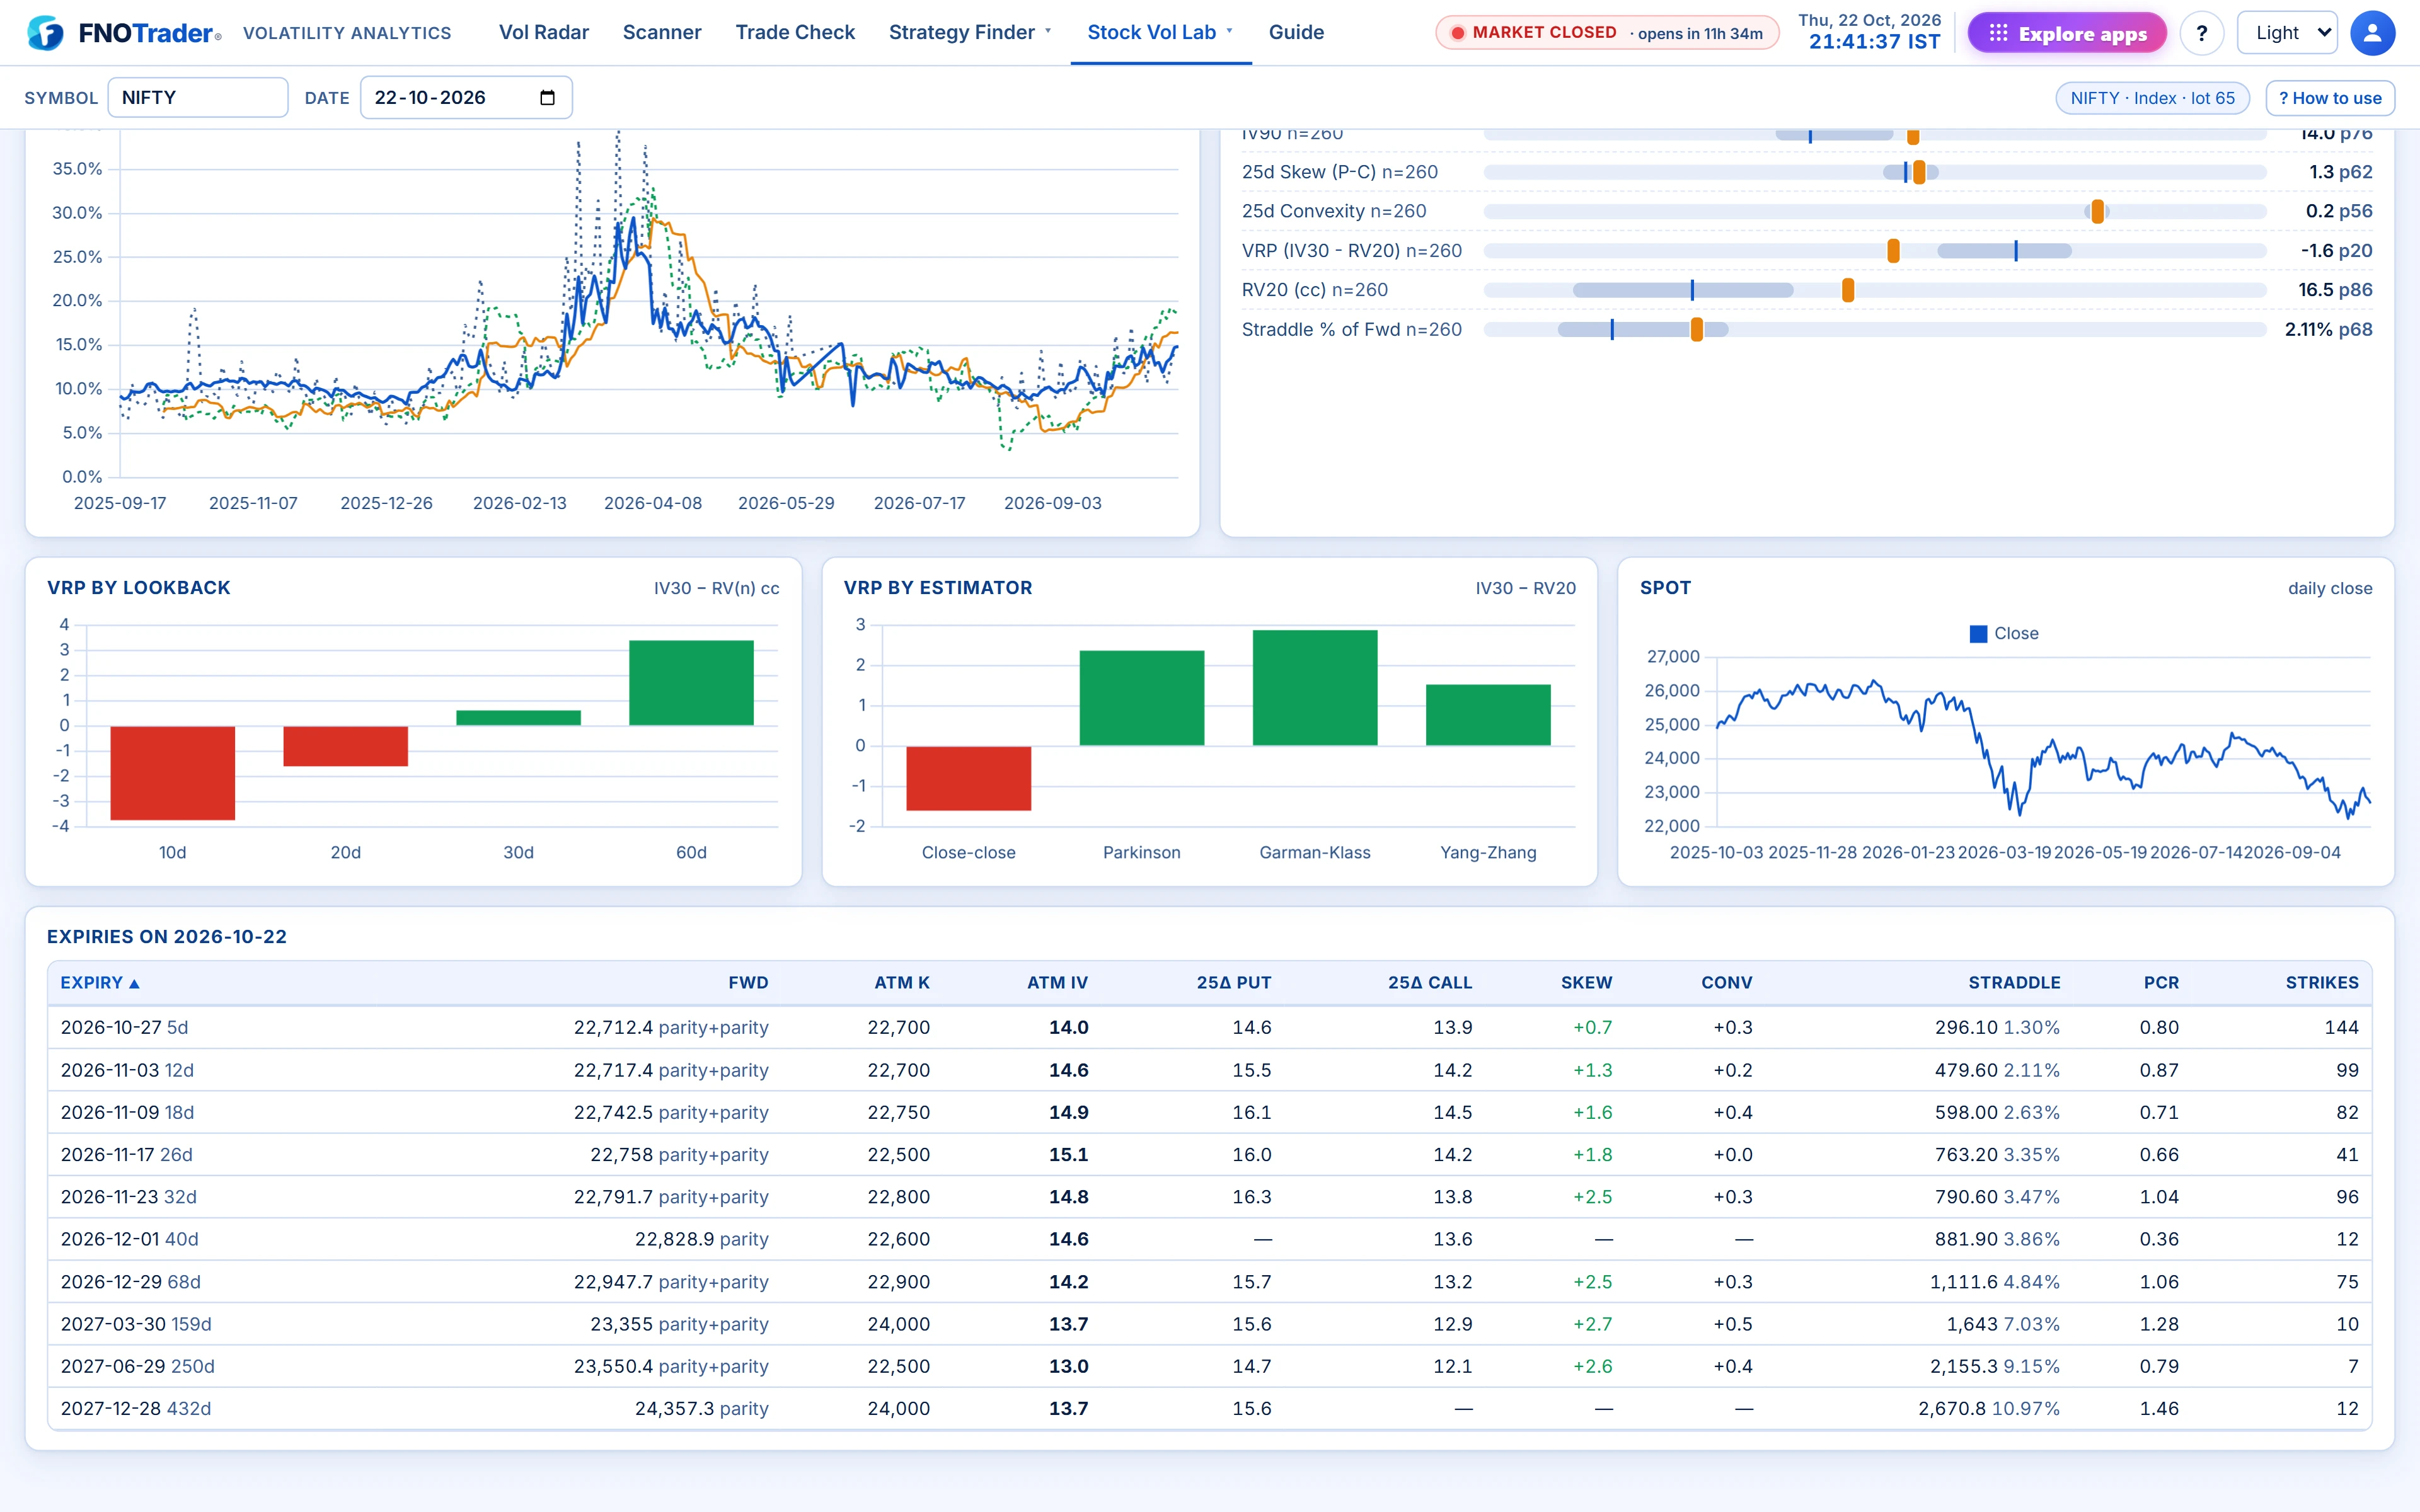
Options are priced off the forward, not spot. Vol Lab takes the same-expiry future when one exists; otherwise the nearest future adjusted for carry; otherwise spot grown at the risk-free rate; and as a last resort the forward implied by put-call parity.
Where the forward did not come from a same-expiry future, it is then refined by put-call parity: F = K + erT(C − P), taken as the median over the three strikes nearest the forward that have live prints on both legs, and accepted only if it lands within 1.5% of the first estimate. This removes the gap between call IV and put IV that appears when the underlying is sampled at a different instant from the options.
IV is then solved with Black-76 on that forward, with r = 6.5%. Black-76 prices an option on a forward directly, so dividends and carry are already inside F and do not need to be guessed separately.
A worked parity example with made-up numbers: strike 24,000, call ₹212, put ₹180, 20 days to expiry. erT = e0.065 × 20/365 ≈ 1.0036, so F ≈ 24,000 + 1.0036 × 32 ≈ 24,032.
Step 4 — IV30 and the wings
IV30, IV60, IV90 are constant-maturity ATM IVs, interpolated linearly in total variance (IV² × T) across expiries with at least one day left. That way a Tuesday and a Friday are comparable and the number does not jump when an expiry rolls off.
Example: expiry A has 20 days and ATM IV 14%; expiry B has 48 days and 16%. Total variance is 0.14² × 20/365 ≈ 0.00107 and 0.16² × 48/365 ≈ 0.00337. Thirty days sits 10/28 of the way between them, so variance ≈ 0.00189, and IV30 = √(0.00189 ÷ 30/365) ≈ 15.2%. Interpolating the IVs directly would give 14.7% — it understates the longer expiry’s weight.
25Δ and 10Δ wings are interpolated in call-delta space: a put with delta −d is the same strike as a call with delta e−rT − d. Using one delta axis for both sides keeps the put and call wings on the same scale. From these: skew = 25Δ put IV − 25Δ call IV, and convexity = average of the two 25Δ IVs − ATM IV.
Step 5 — percentiles against the name’s own history
A 20% IV is cheap for a small-cap and expensive for an index, so most numbers are also shown as a percentile: the share of loaded sessions with a lower value. A percentile needs at least five sessions of history for the name; with fewer, it is left blank.
The IV %ile and IV Rank used across Vol Lab are the same front-expiry ATM IV numbers as the Options app’s Stock Volatility page (last 252 sessions), so one stock carries one IV percentile across the platform. IV30 has its own separate percentile. For how a single index number like India VIX relates to all this, see VIX vs India VIX.
Where to find it
- Open Volatility Analytics and pick a symbol and date in the top bar.
- Stock Vol Lab › Vol Overview shows the expiries table with each expiry’s forward and how it was derived.
- Stock Vol Lab › Smile & Skew shows the strikes table: dashes mark strikes the gates excluded.
- Hover any column header for its definition. Next: how these numbers become tags on Vol Radar.
Common questions
Why does Vol Lab use the 15:10–15:25 median instead of the closing price?
The last traded price of an illiquid strike can be hours old. The median of one-minute closes in a 16-minute window near the close is a repeated price, sampled at the same time for every strike.
What model does Vol Lab use to compute implied volatility?
Black-76 on the forward with a 6.5% rate. The forward comes from the same-expiry future where available, and otherwise is refined by put-call parity at the strikes nearest the money.
Why do some strikes show a dash instead of an IV?
The strike had no open interest or fewer than four prints in the sample window, or its price broke the rule that OTM prices fall away from the forward. Such strikes are excluded from every calculation.
How is IV30 different from front-month ATM IV?
IV30 is interpolated to exactly 30 days in total variance across expiries, so it does not jump at expiry rolls. Front ATM IV is the at-the-money IV of the nearest expiry.
How are 25-delta skew and convexity calculated?
Both wings are interpolated on a call-delta axis. Skew is 25-delta put IV minus 25-delta call IV; convexity is the average of the two 25-delta IVs minus ATM IV, in vol points.
More on Volatility Analytics
More in Volatility Analytics · App: Volatility Analytics · Definitions: glossary · All: every article