What the report is for
The report answers two questions: what did these rules do over this history, and how much of that was the order in which wins and losses happened to arrive.
Every finished run gets its own report page with its own link, so you can refresh it, bookmark it, print it or save it as a PDF without re-running anything. The same page opens whether you just ran the backtest or reopened it from Backtest History.
The top of the report: friction tabs, rules and warnings
Three tabs sit above everything else, all from the same replay:
| Tab | What it shows |
|---|---|
| Plain | The replay as run, with no charges. |
| With Costs | Plain minus your cost per order on every buy and every sell. |
| With Slippage | Costs plus the adverse-fill estimate on each leg's entry and exit. The closest of the three to live P&L. |
Read the With Slippage tab first. If a strategy only works on Plain, it does not work.
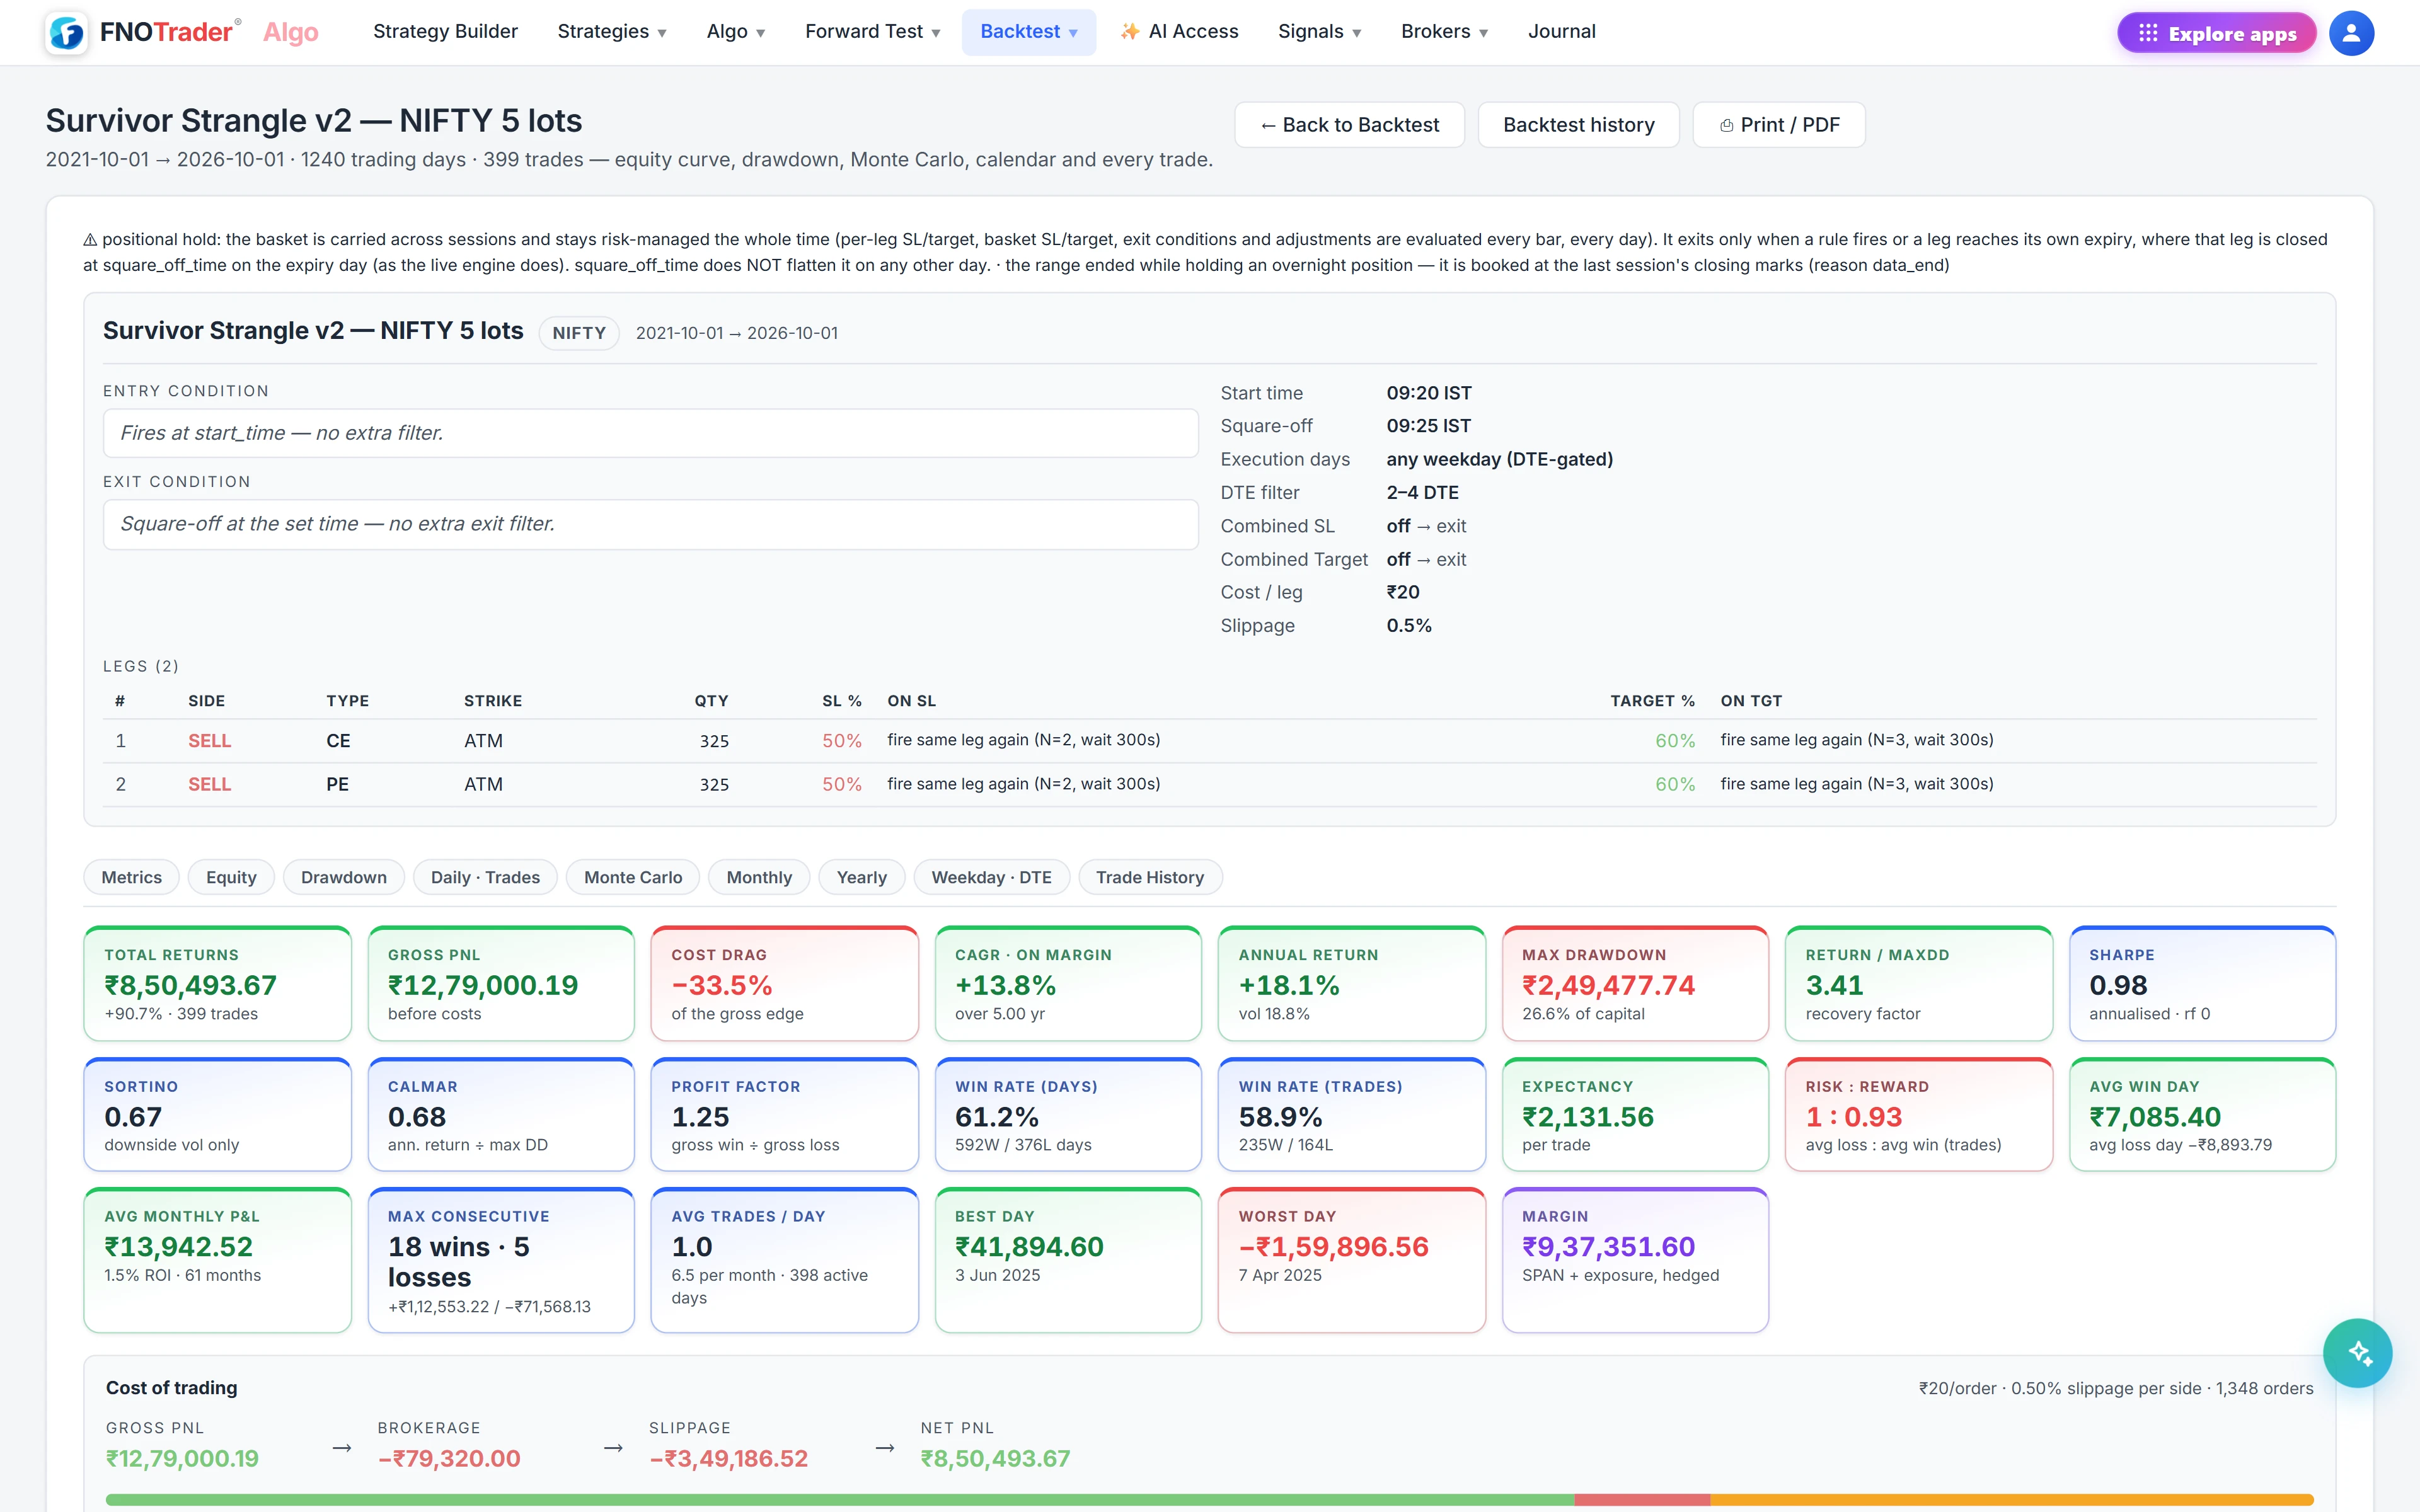
Below the tabs, the rules header echoes back the strategy exactly as it was replayed — entry, exit, stops, targets — so you can confirm the run tested what you meant. The Warnings panel lists anything the replay had to approximate: a leg whose strike fell outside the archived strike window and was moved to the nearest available strike, a metric that is not available in history, missing data, and a line naming which advanced features were simulated, such as overnight carry, protection hedges or adjustment rules. A report with warnings is not wrong, but you should know what they say before you trust the numbers.
Headline numbers, equity curve and calendar
The headline tiles include total return, gross P&L, cost drag, annual return, max drawdown, return to drawdown, Sharpe, Sortino, Calmar, profit factor, win rate by days and by trades, expectancy, average win and loss day, best and worst day, and the margin the strategy blocks. Return figures are measured on that margin when it is known, otherwise on the capital you entered.
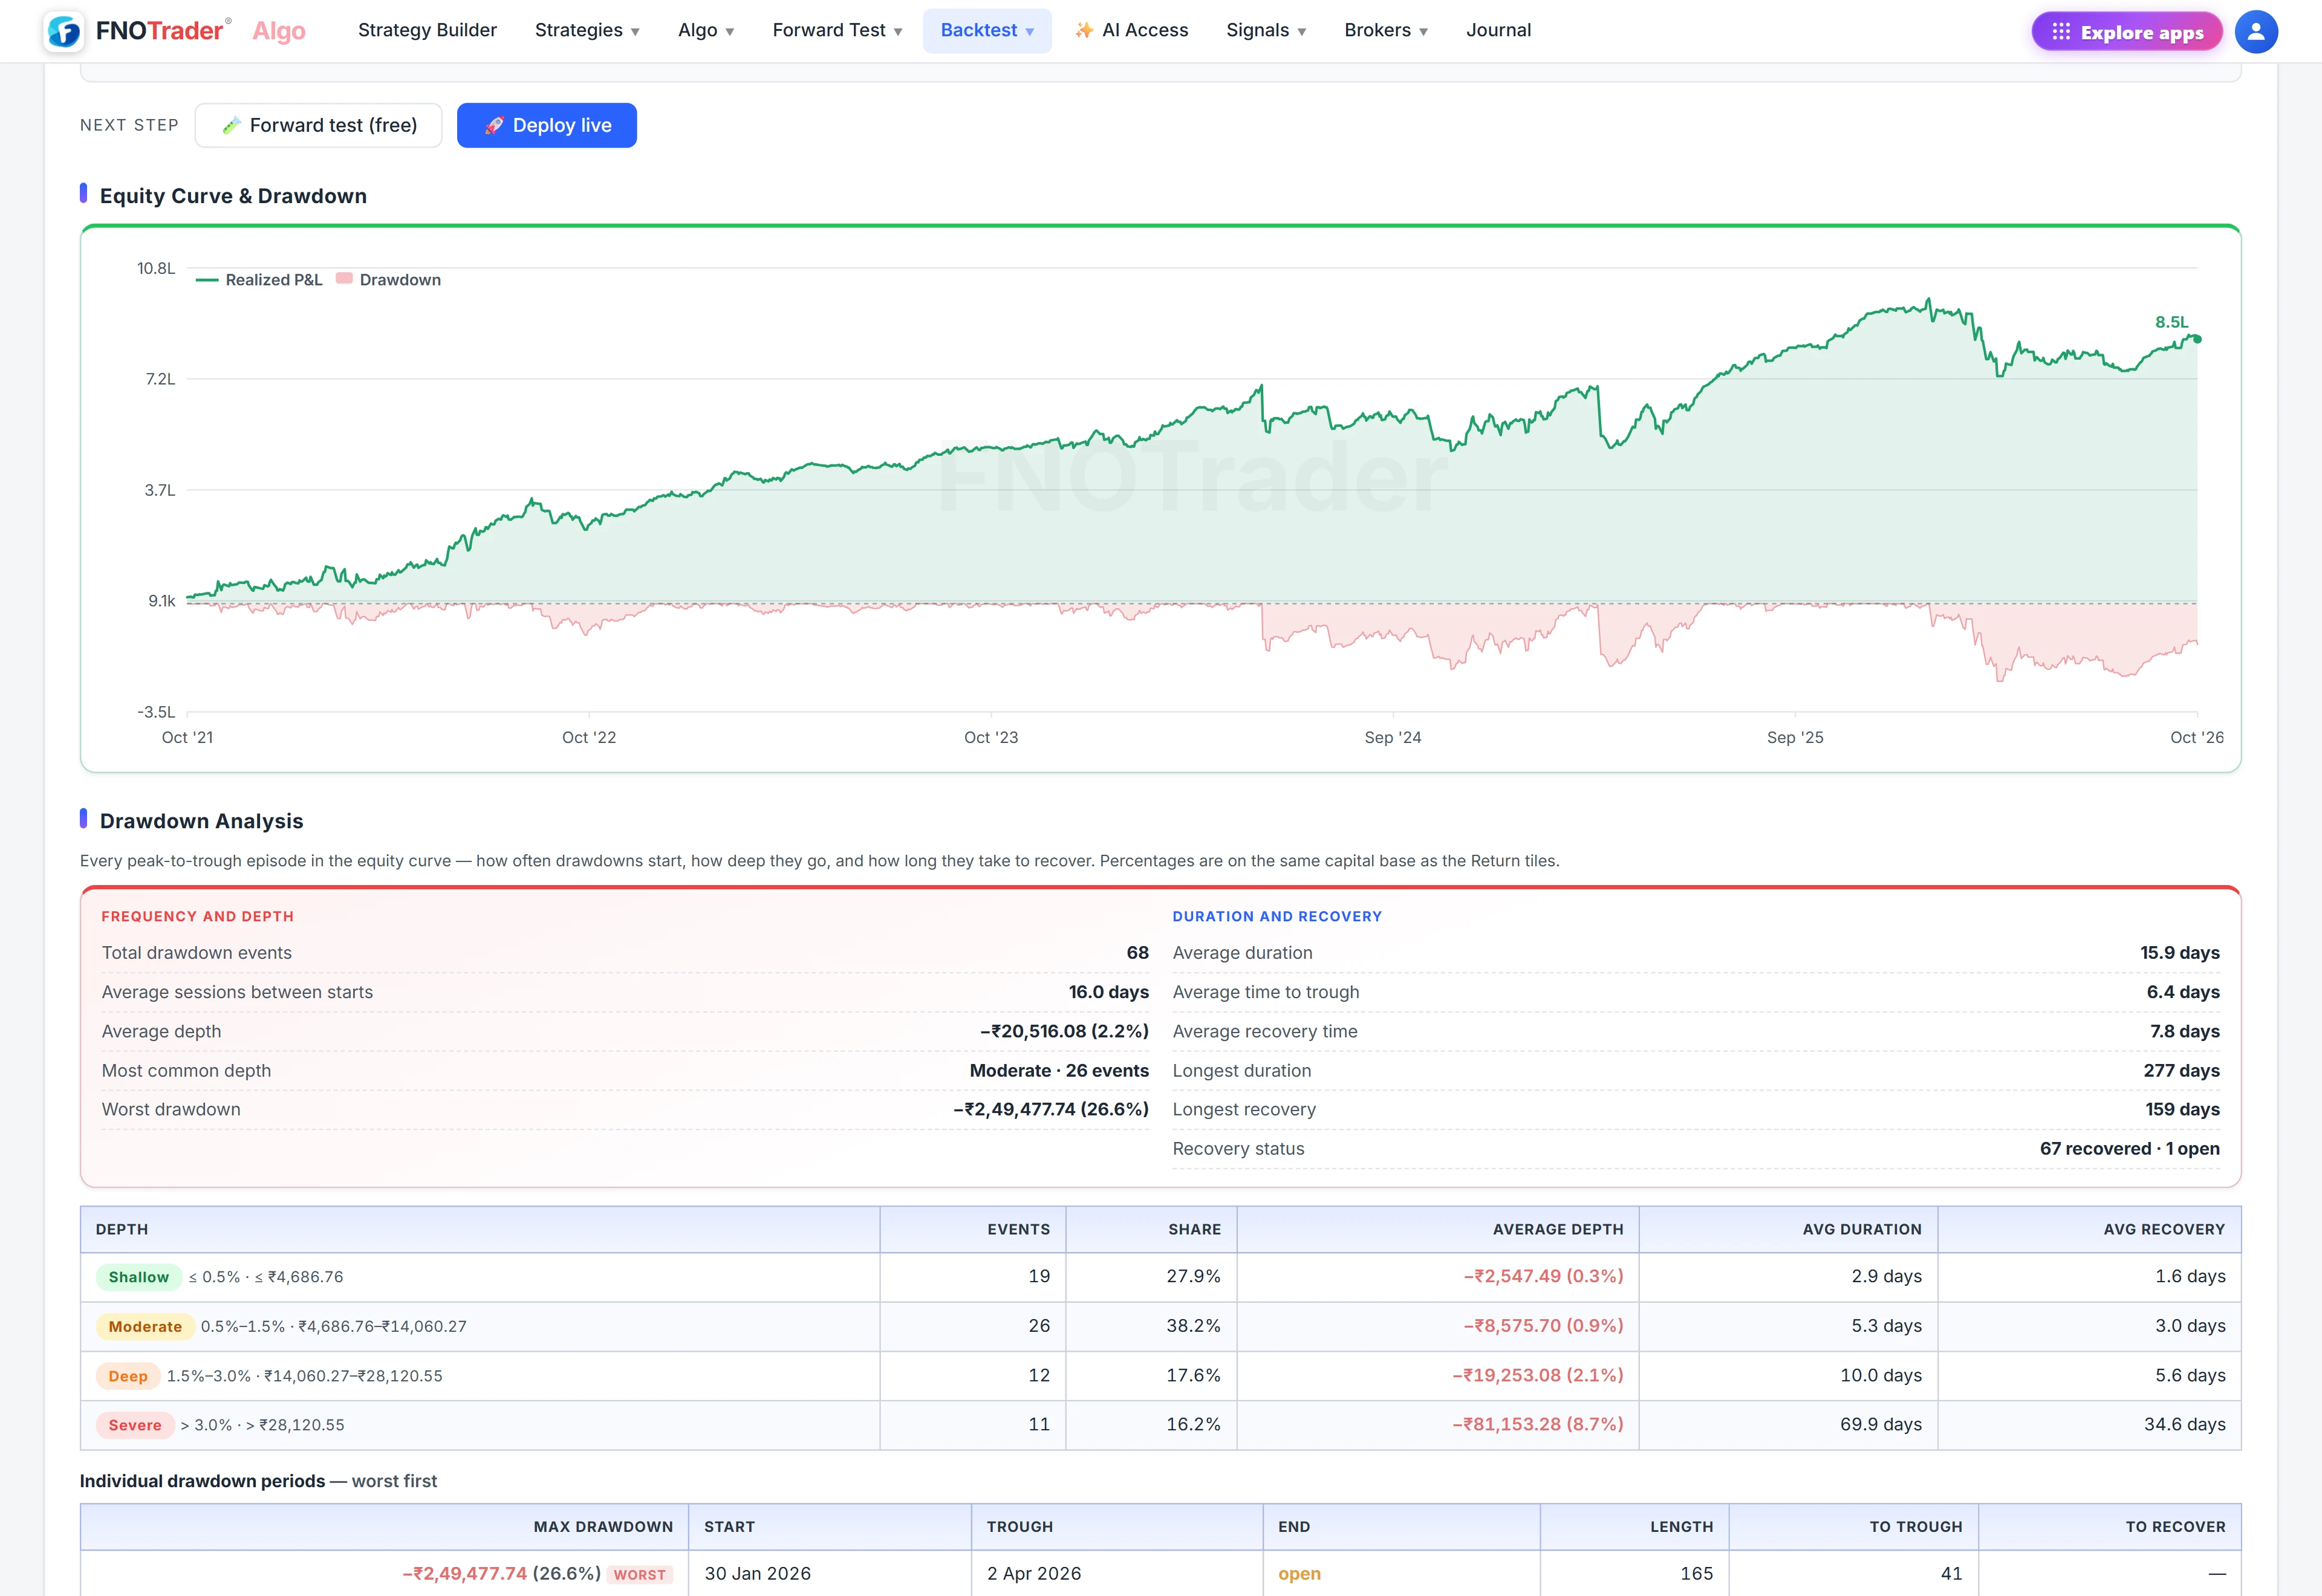
Then, in order: the equity curve with running drawdown, a drawdown analysis, the daily and trade-wise P&L with every leg's entry, exit and exit reason, the Monte Carlo card, a monthly P&L calendar coloured like a heatmap, and a yearly summary with each year's net P&L and worst drawdown.
The monthly calendar is the quickest regime check there is. A strategy whose good months are all in one year, or which loses every expiry-heavy month, shows it here at a glance.
Monte Carlo: how to read the percentiles
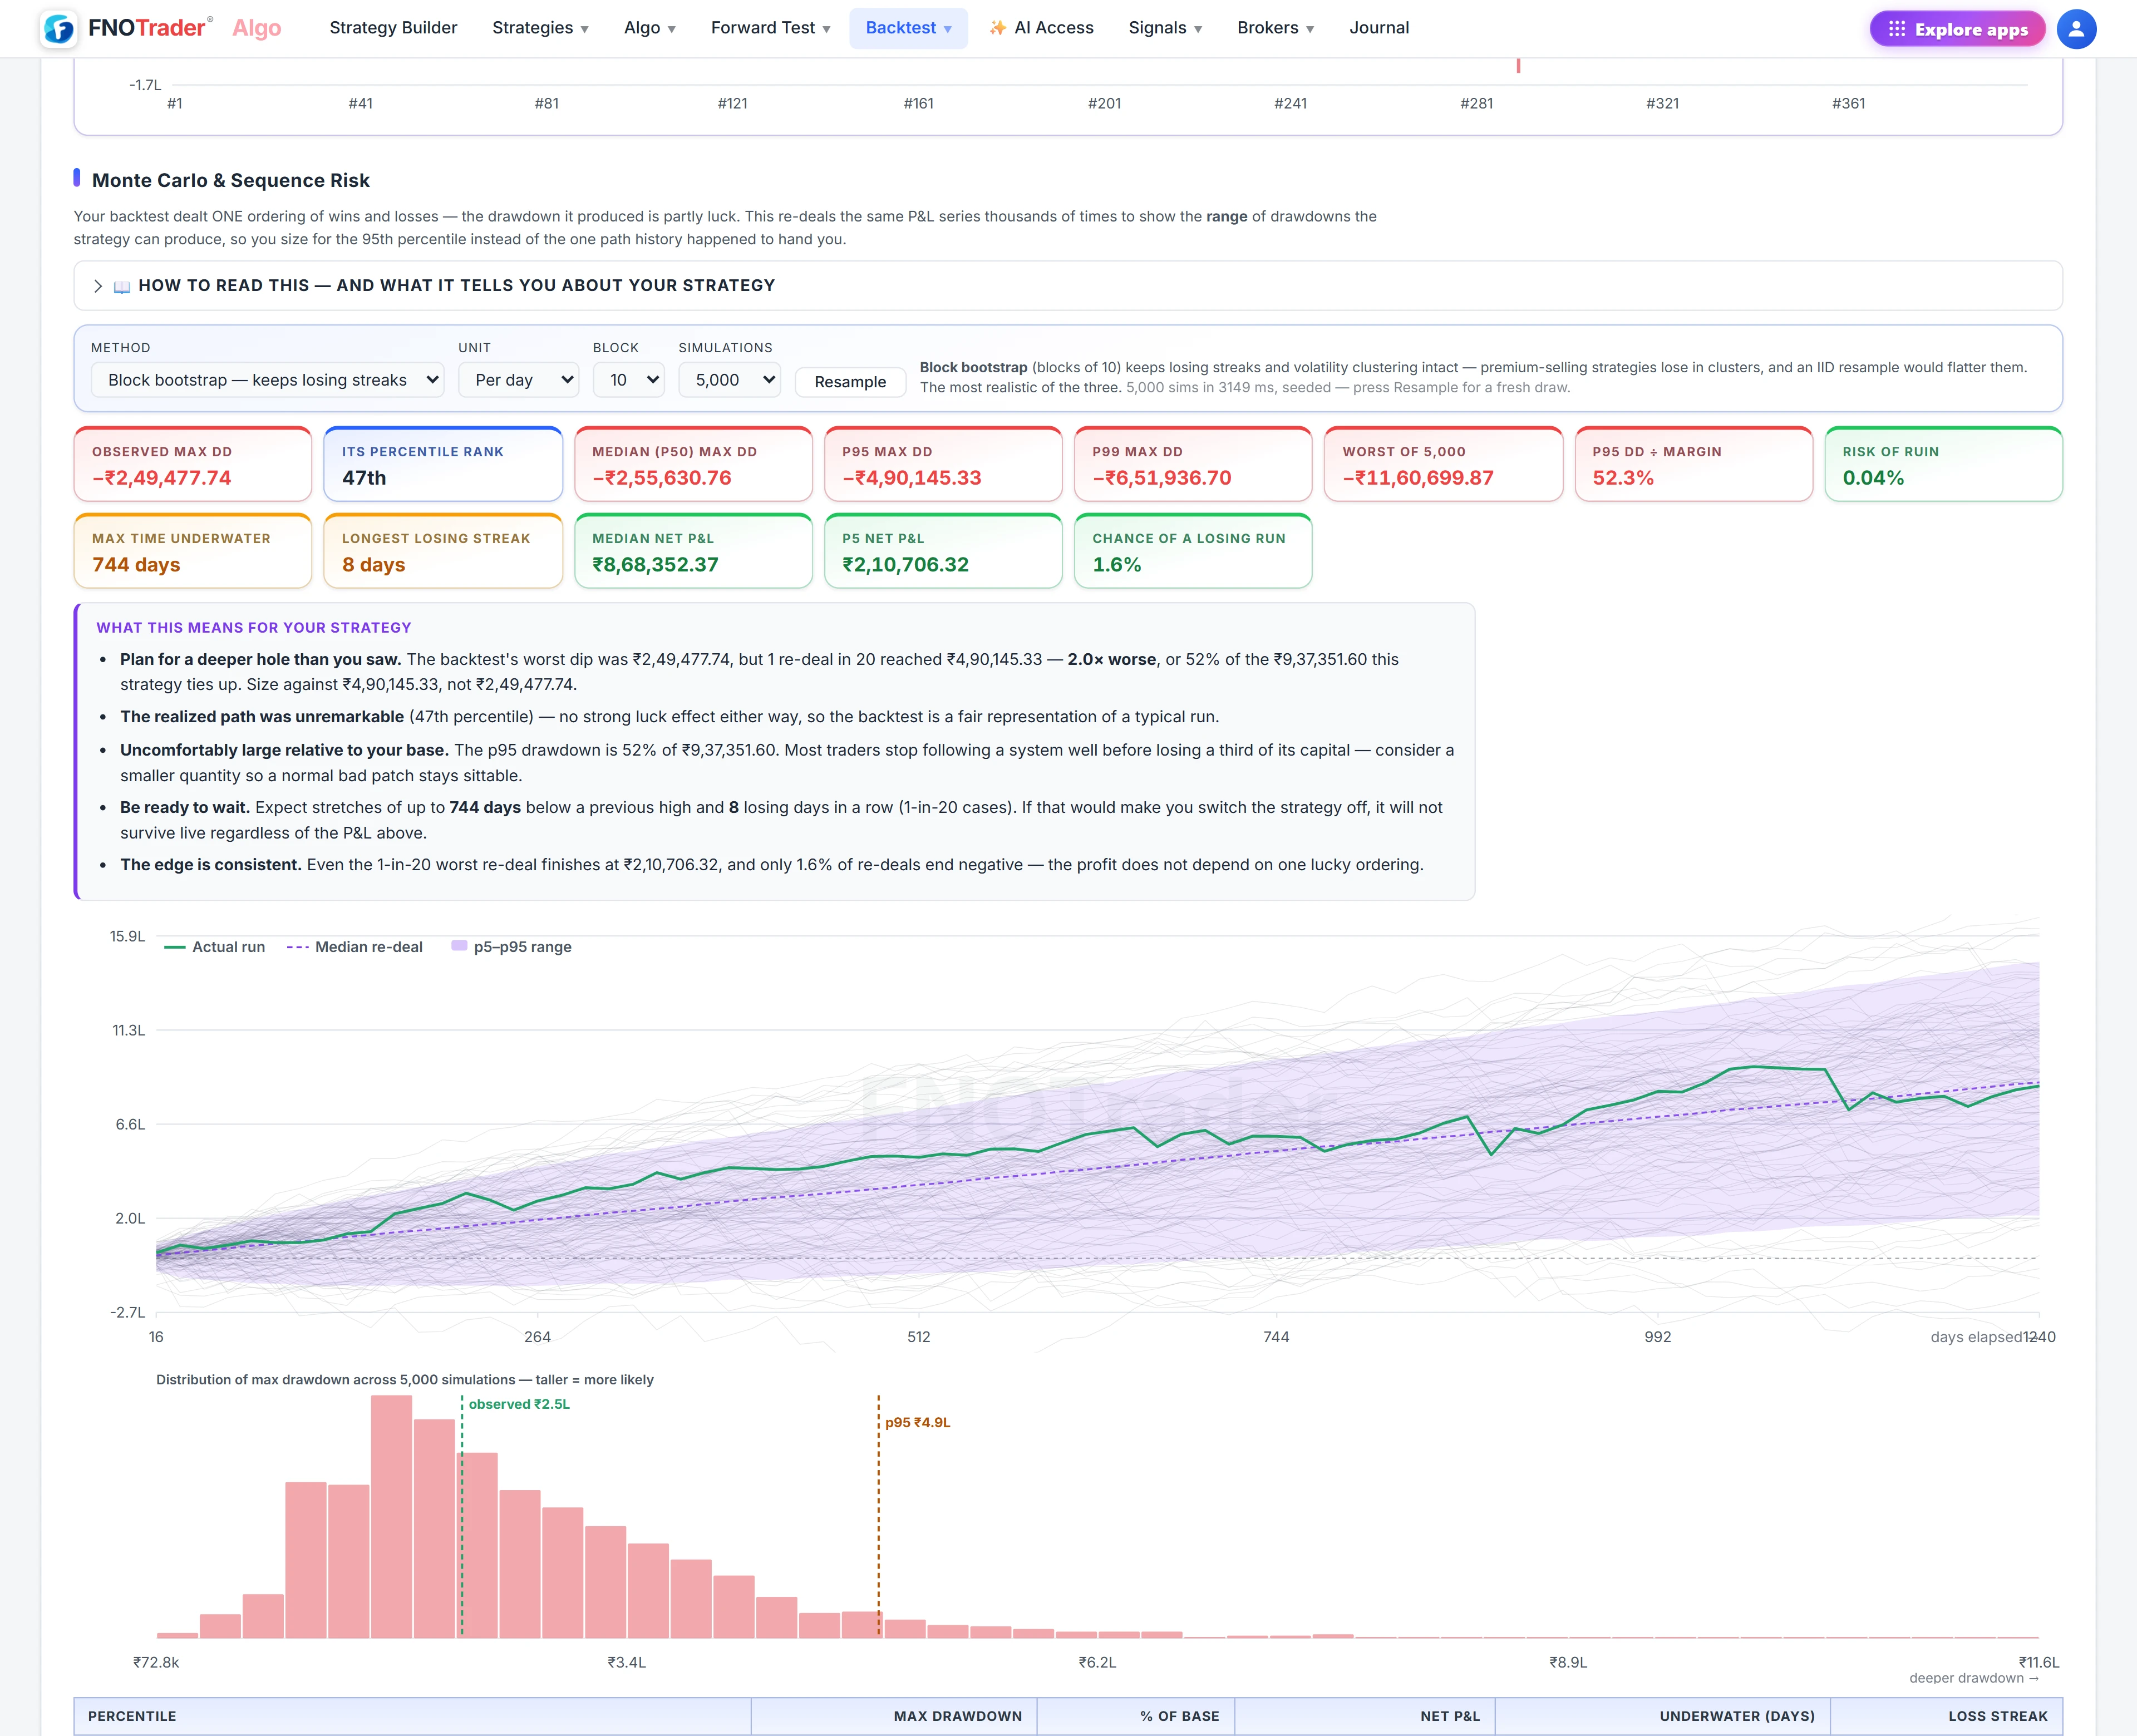
Your backtest dealt you one sequence of days. The same days in a different order give the same total P&L but a completely different drawdown. The Monte Carlo card re-deals your own daily P&L thousands of times and shows the range.
Every figure is a percentile. Read it as a frequency:
| Percentile | Say it as |
|---|---|
| Median (p50) | Half the re-deals are worse. Your normal bad patch. |
| p95 max drawdown | 1 in 20 re-deals is worse. The number to size capital on. |
| p99 / worst | The stress case. Make sure you survive it. |
| p5 net P&L | 1 in 20 re-deals finishes at or below this. If it is negative, the same edge can plausibly lose over this span. |
Mind the direction: for drawdown a higher percentile is worse, for P&L a higher percentile is better. The card also shows risk of ruin, chance of a losing run, longest time under water and longest losing streak, plus an equity cone and a drawdown histogram.
There are three methods. Shuffle only reorders, so P&L never changes and you see pure sequence luck. Bootstrap draws days with replacement, so P&L varies too. Block bootstrap, the default with blocks of 10, keeps runs of consecutive days together. Option-selling losses cluster, so block bootstrap usually reports the deepest and most honest drawdown. Simulations run in your browser (5,000 by default), are seeded so the numbers do not change on every page load, and cost no re-run.
A worked example
Suppose a hypothetical report shows an observed max drawdown of ₹42,000, a Monte Carlo median of ₹48,000 and a p95 of ₹95,000, on a strategy that blocks ₹2.5 lakh of margin.
The observed ₹42,000 sits below the median: history was kinder than average. The number to plan for is the p95, ₹95,000, which is 38% of the margin (95,000 ÷ 2,50,000). Few traders sit calmly through a 38% hole. The usual response is smaller size, not hope: at half the quantity the p95 drawdown is roughly ₹47,500, about 19% of the original margin.
What the report cannot tell you
- Monte Carlo only re-deals days the backtest contained. If the window holds no crash, no re-deal invents one.
- A strategy tuned to its history resamples into confident numbers that are still wrong. See the overfitting section in parameter sweeps.
- The margin used for returns is today's margin for the position, not the margin on each historical day.
- Fills in a replay are bar prices. Partial fills, rejections and freeze splits happen only live, which is what a forward test is for.
Where to find it
- Run a backtest from Backtest in Algo, or open Backtest History and click a saved run.
- Switch between Plain, With Costs and With Slippage at the top.
- Use the section links to jump to Equity Curve, Monte Carlo, Monthly calendar or the trade list.
- In the Monte Carlo card, change Method, Unit, Block and Simulations, or press Resample.
- Use Print / PDF to keep a tearsheet copy.
Common questions
What does p95 drawdown mean in a Monte Carlo backtest?
It is the drawdown that only 1 in 20 re-ordered versions of your results exceeded. It is a common bad outcome, not a worst case, which is why it is the usual figure to size capital on.
Why does Shuffle never change the total P&L?
Shuffle only reorders the same days, and adding the same numbers in a different order gives the same total. It isolates how much of your drawdown was the sequence. Bootstrap methods change which days occur, so P&L varies too.
Which tab of the backtest report should I trust?
With Slippage. It deducts your cost per order and an adverse-fill estimate on every leg, which makes it the closest of the three to what a live account would show.
What are the warnings in a backtest report?
They list what the replay had to approximate: strikes moved to the nearest archived strike, metrics not available in history, missing data, and which advanced features such as adjustments or overnight carry were simulated.
Does running Monte Carlo again cost another backtest?
No. It runs in your browser from the report you already have, including saved reports reopened from Backtest History.
More on Algo & Backtesting
More in Algo & Backtesting · App: Algo & Backtest · Definitions: glossary · All: every article