What they are
The FT indicators are a set of studies that read fields carried on each bar of FNOTrader’s chart data: open interest, buy and sell volume, delta, IV and greeks.
Because the fields arrive with the bars, each study is a straight function of the bars on screen — no second data request and no alignment step where two series can slip by a bar. The names and calculations follow the versions traders already use on other FNOTrader charts, so a number reads the same wherever you see it.
What each one shows
| Indicator | What it draws |
|---|---|
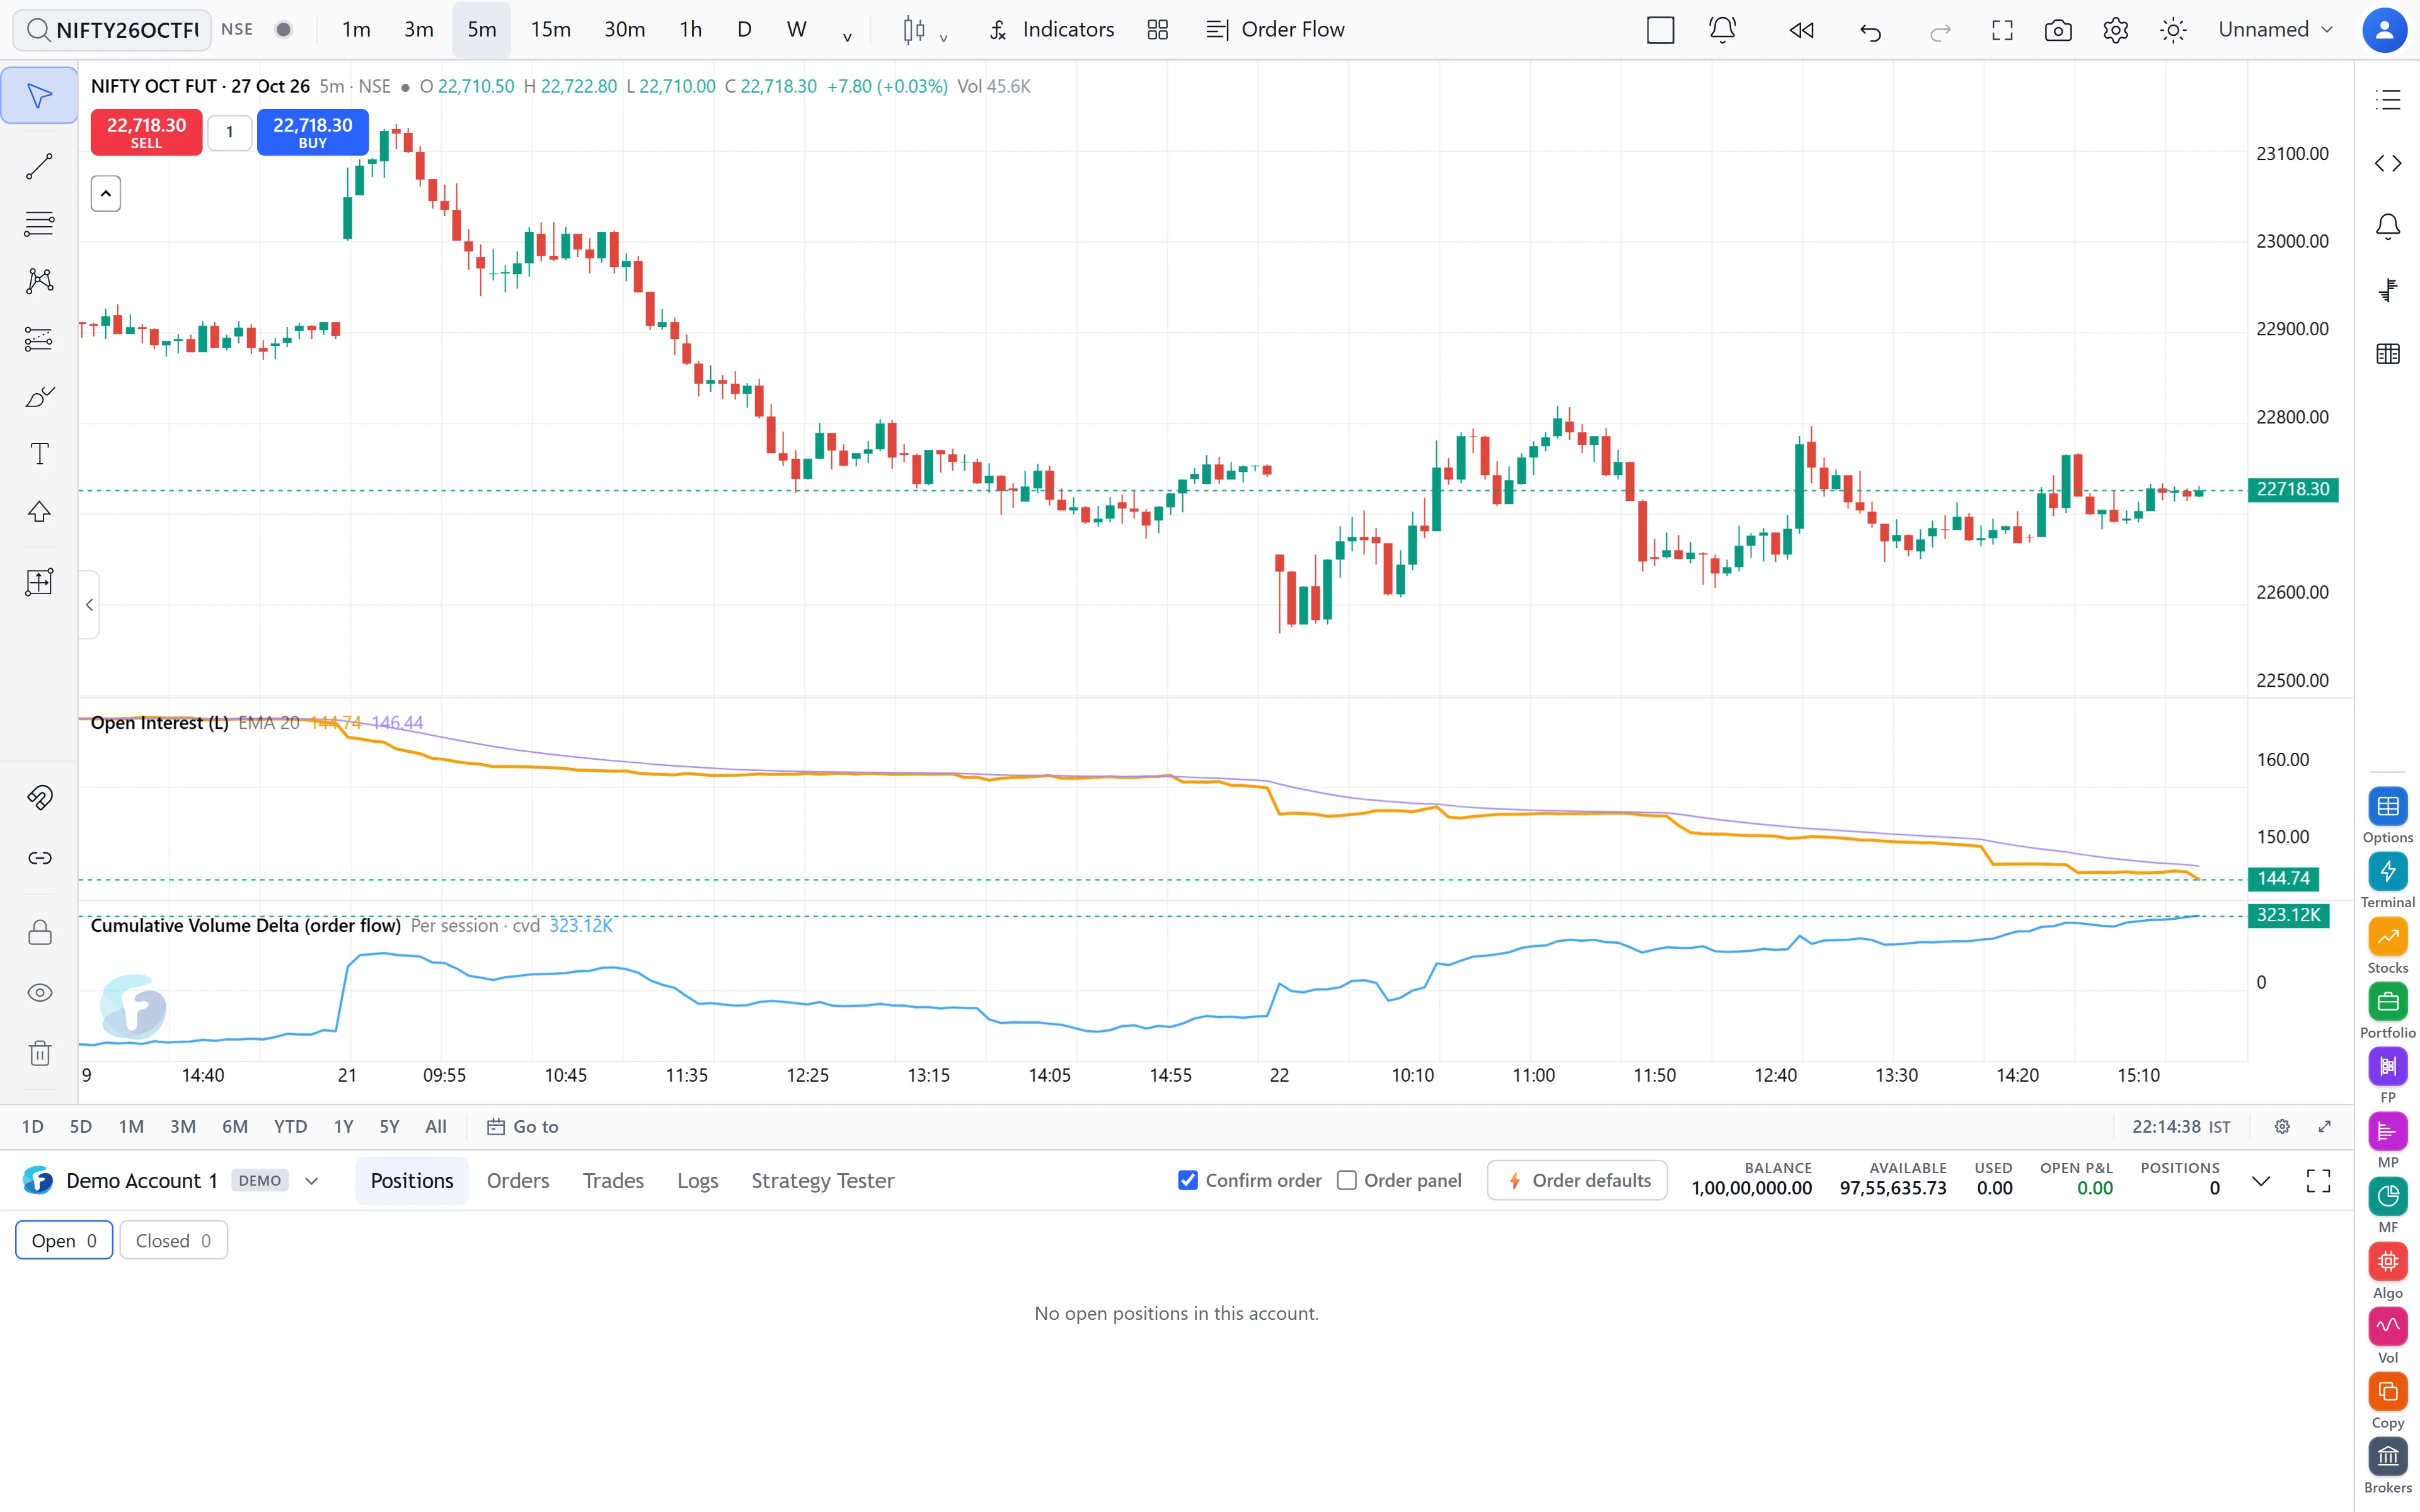
| Open Interest (L) | OI in lakhs, with an optional SMA or EMA (default EMA 20). |
| Buy/Sell Volume | Buy volume above zero, sell volume below. |
| Delta | Per-bar buy minus sell volume, green or red. |
| Cum Vol Delta (L) | Running delta in lakhs, reset to zero at the start of each IST day, with an optional moving average. |
| Delta Bars | Cumulative delta drawn as candles: open, high, low and close of delta within each bar. |
| Implied Volatility (%) | IV as a percentage, as a line or as IV candles. |
| Delta (Greek), Gamma, Theta, Vega | The option’s greeks per bar. On a future, which has none, nothing is drawn rather than a flat zero. |
| Pocket Pivot Volume | Volume bars in four colours (below). |
| Day Levels | Previous day high/low (PDH/PDL) and current day high/low (CDH/CDL). |
| FT Swing VWAP | Two VWAPs, anchored to the latest confirmed swing high and swing low. |
| HTF Candles | Up to three higher-timeframe candle strips (default D, W, M; 5 candles each). |
| Mansfield RS | Relative strength against NIFTY 500. |
| Delivery, Delivery % | Delivered quantity and delivery percentage for stocks. |
How the less obvious ones are calculated
Pocket Pivot Volume. Each bar’s volume is compared with the average of the previous 10 bars. Below that average it is grey. At or above it, green on an up close and red on a down close. It turns violet — a pocket pivot — when the bar closed up, closed above its open, closed in the top half of its range, and its volume beat the largest down-day volume of the prior 10 bars.
Day Levels. PDH/PDL come from the previous full session. Sessions with fewer than five bars, such as a one-hour special session, are skipped so they do not become “yesterday”. The study is meant for intraday charts; on daily bars every day is one bar.
FT Swing VWAP. A swing high is a bar whose high is the highest of the N bars on each side (default 10, range 2–50). It is only known N bars later, and is used only from then on, so the line does not repaint. From each confirmed swing, a volume-weighted average of the typical price (high + low + close) ÷ 3 is accumulated to the current bar; a new swing restarts its line. SH and SL marks show where each swing was confirmed.
A worked example: session CVD
Suppose (hypothetical numbers) a future’s first three 5-minute bars of the day have deltas of +1.2 lakh, −0.4 lakh and +0.7 lakh.
- Bar 1: CVD = 1.2 L
- Bar 2: 1.2 − 0.4 = 0.8 L
- Bar 3: 0.8 + 0.7 = 1.5 L
On the first bar of the next IST day, CVD starts again from that bar’s own delta. That is deliberate: a CVD that runs across days lets yesterday’s imbalance dominate today’s line, and the reading you care about intraday is who has been aggressive this session.
Limits and common mistakes
- The data has to exist. OI, IV and greeks are drawn only where the instrument carries them. A cash stock has no OI; a future has no greeks.
- OI and CVD are in lakhs. A reading of 12.5 means 12.5 lakh, not 12.5.
- Swing VWAP lags by design. With strength 10, a swing appears 10 bars after it happened. Lowering the strength gives earlier but noisier swings.
- For order-flow delta built from aggressor trades, use the order-flow CVD described in order flow on the chart.
Where to find them
- Open a chart on FNOTrader Charts.
- Open Indicators and search for the name, for example “Cum Vol Delta” or “FT Swing VWAP”. They sit in the Volume, Options and Trend categories.
- Open the indicator’s settings to change lengths, the moving average and colours.
Common questions
How do I show open interest on a chart for NIFTY futures?
Add the Open Interest (L) indicator from Indicators. It draws OI in lakhs in its own pane, with an optional moving average.
Does the CVD indicator reset every day?
Yes. Cum Vol Delta (L) resets to zero at the start of each IST trading day.
Does FT Swing VWAP repaint?
No. A swing is confirmed only after the set number of bars on its right, and the VWAP uses it only from that bar onward.
Why does the greeks indicator show nothing on a future?
Futures have no greeks, so the indicator draws nothing instead of a misleading flat zero.
What is a pocket pivot?
An up bar closing in the top half of its range whose volume beats the largest down-day volume of the prior 10 bars.
More on Charts & Marketplace
More in Charts & Marketplace · App: FNOTrader Charts · Definitions: glossary · All: every article