What an imbalance is measuring
An imbalance marks a row where aggressive buying (or selling) was several times larger than the aggressive flow on the other side of the market at the adjacent price.
The reason for “adjacent” is how a market works. A buyer who lifts the offer at 100 is trading against sellers resting at 100; the sellers who were hitting the bid were doing so one tick lower, at 99.95 or 99.90. Comparing buy and sell volume on the same row compares two groups who never met. The meaningful comparison is across the diagonal.
For the basics of reading cells, see footprint charts explained and footprint views and row size.
The diagonal rule the app uses
Within each candle the app walks the rows from bottom to top and checks two things:
- Buy imbalance at a row: that row's buy volume divided by the sell volume on the row below is at least the threshold.
- Sell imbalance at a row: that row's sell volume divided by the buy volume on the row above is at least the threshold.
A row whose comparison cell is zero is not flagged — a ratio against nothing is undefined, and treating it as infinite would flag every thin edge row.
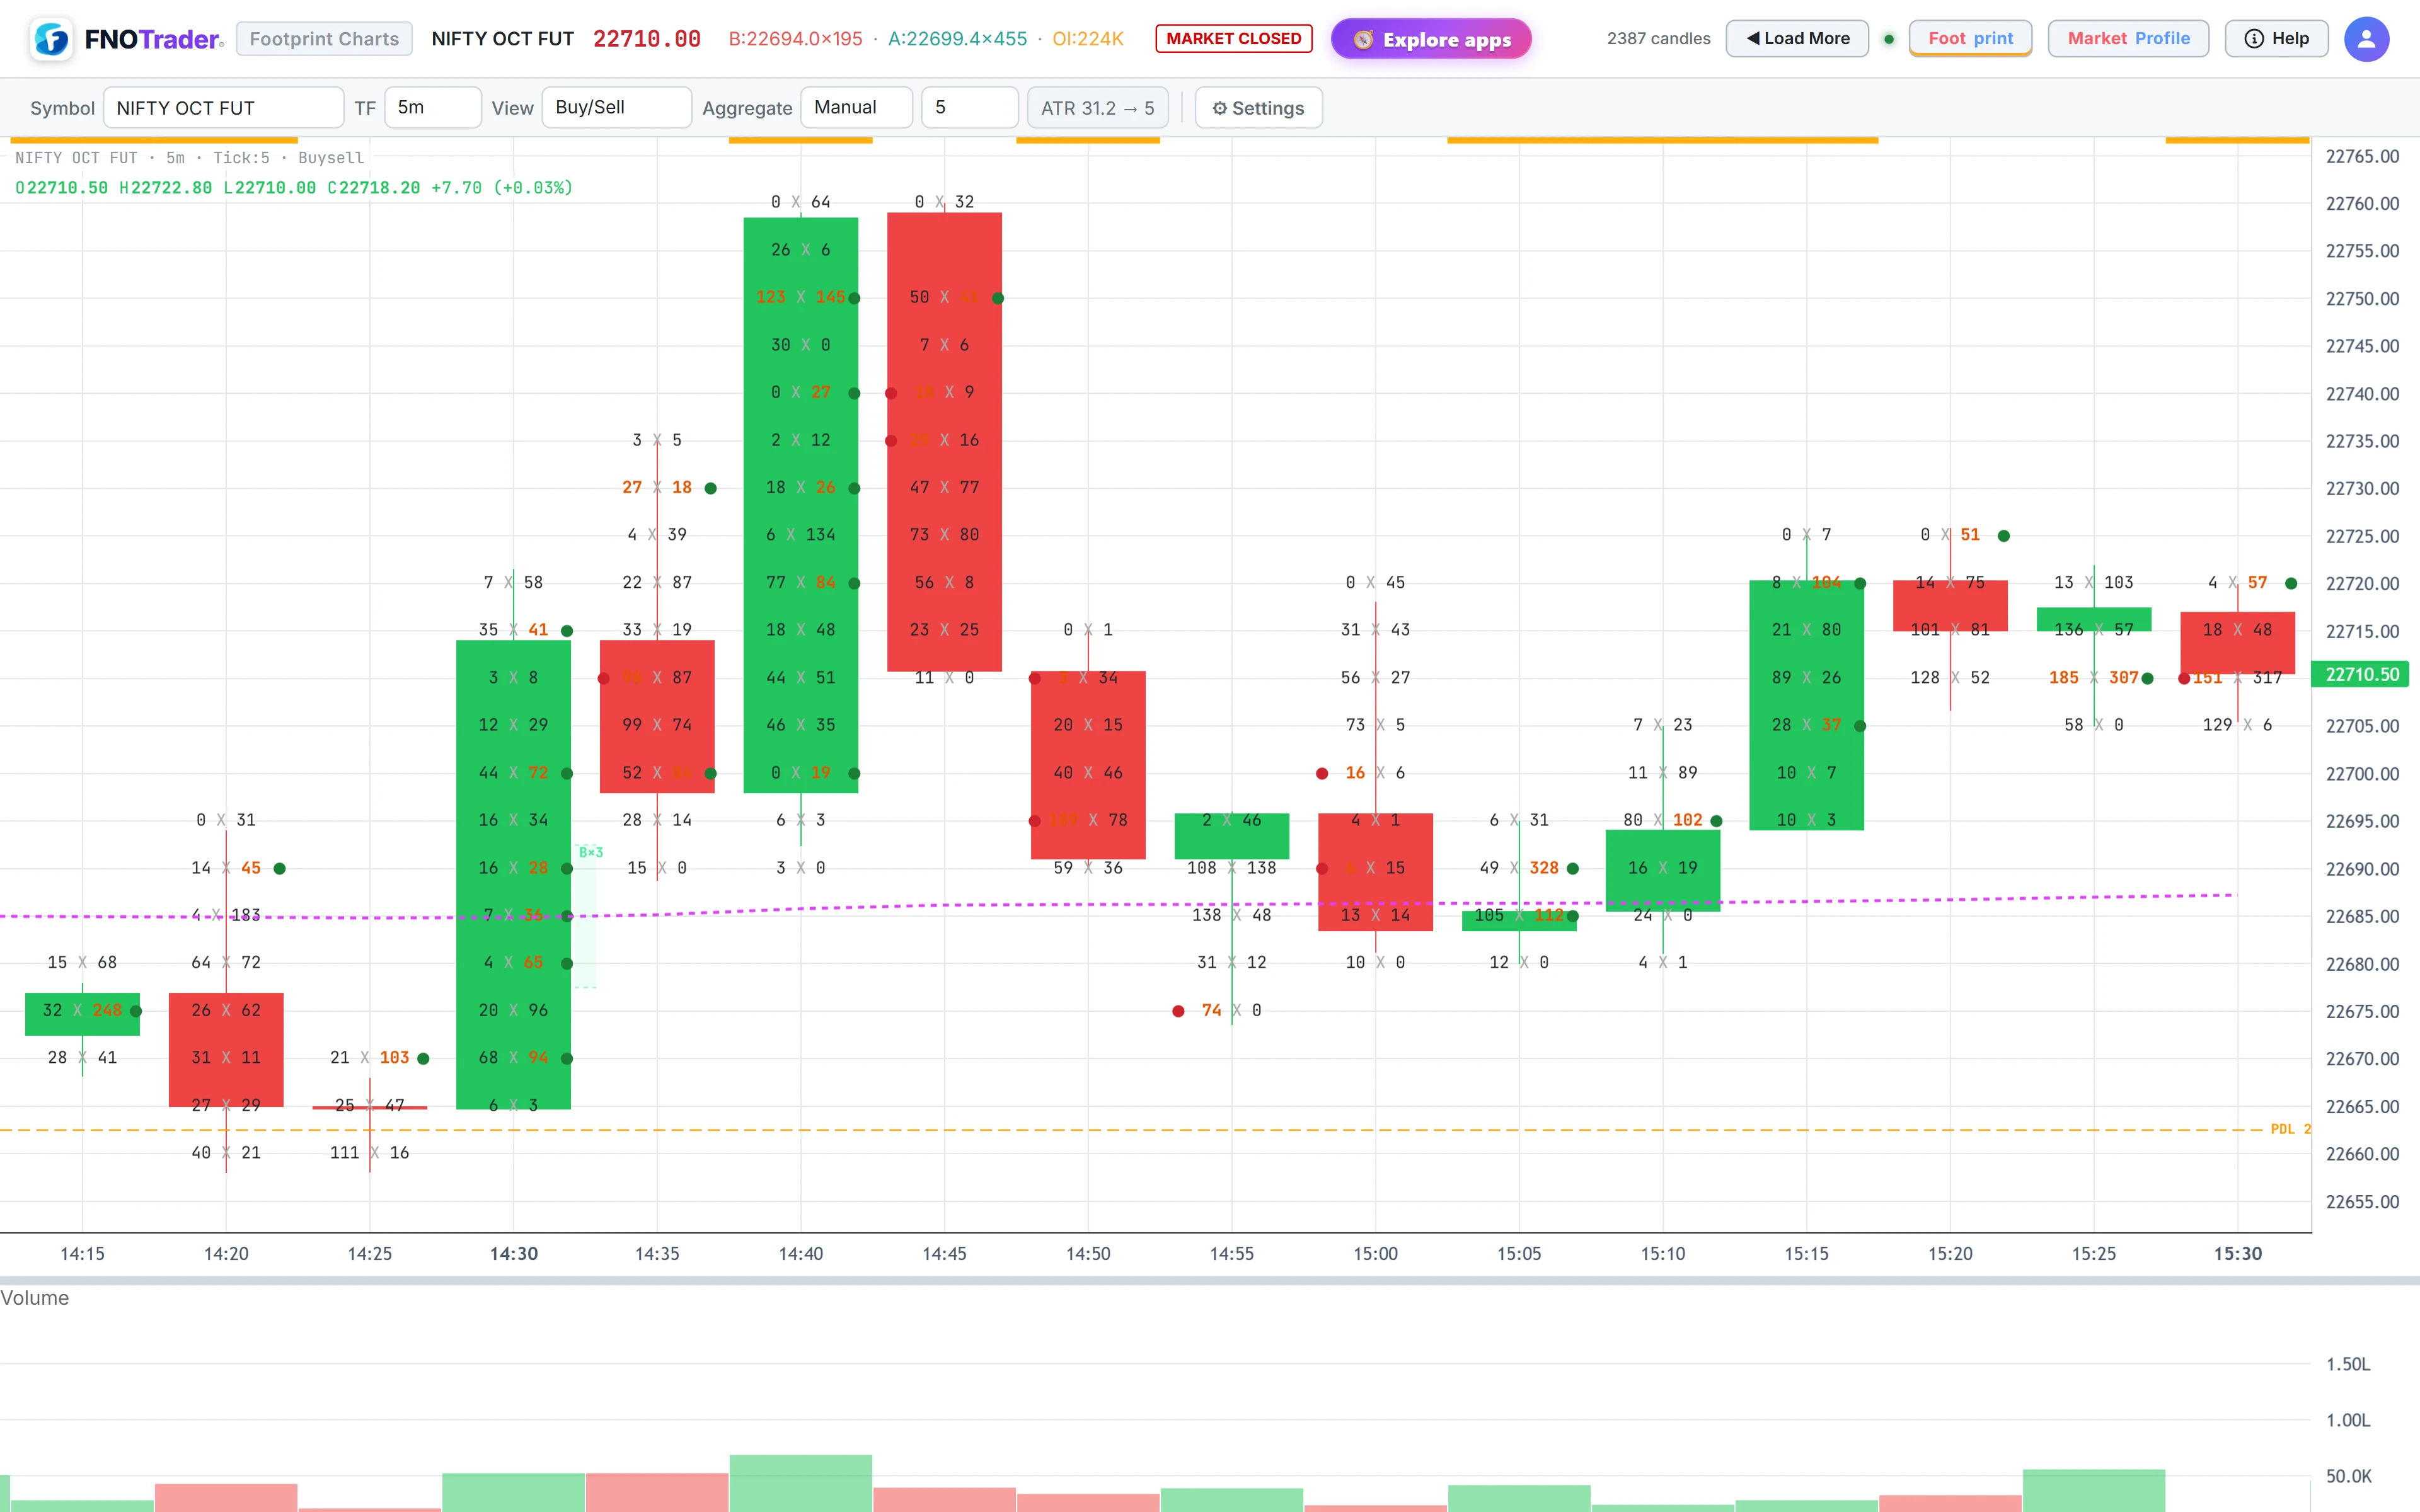
Imbalanced cells are marked with a small dot on the side that dominated, green for buying and red for selling, and the number is drawn in bold.
The threshold setting
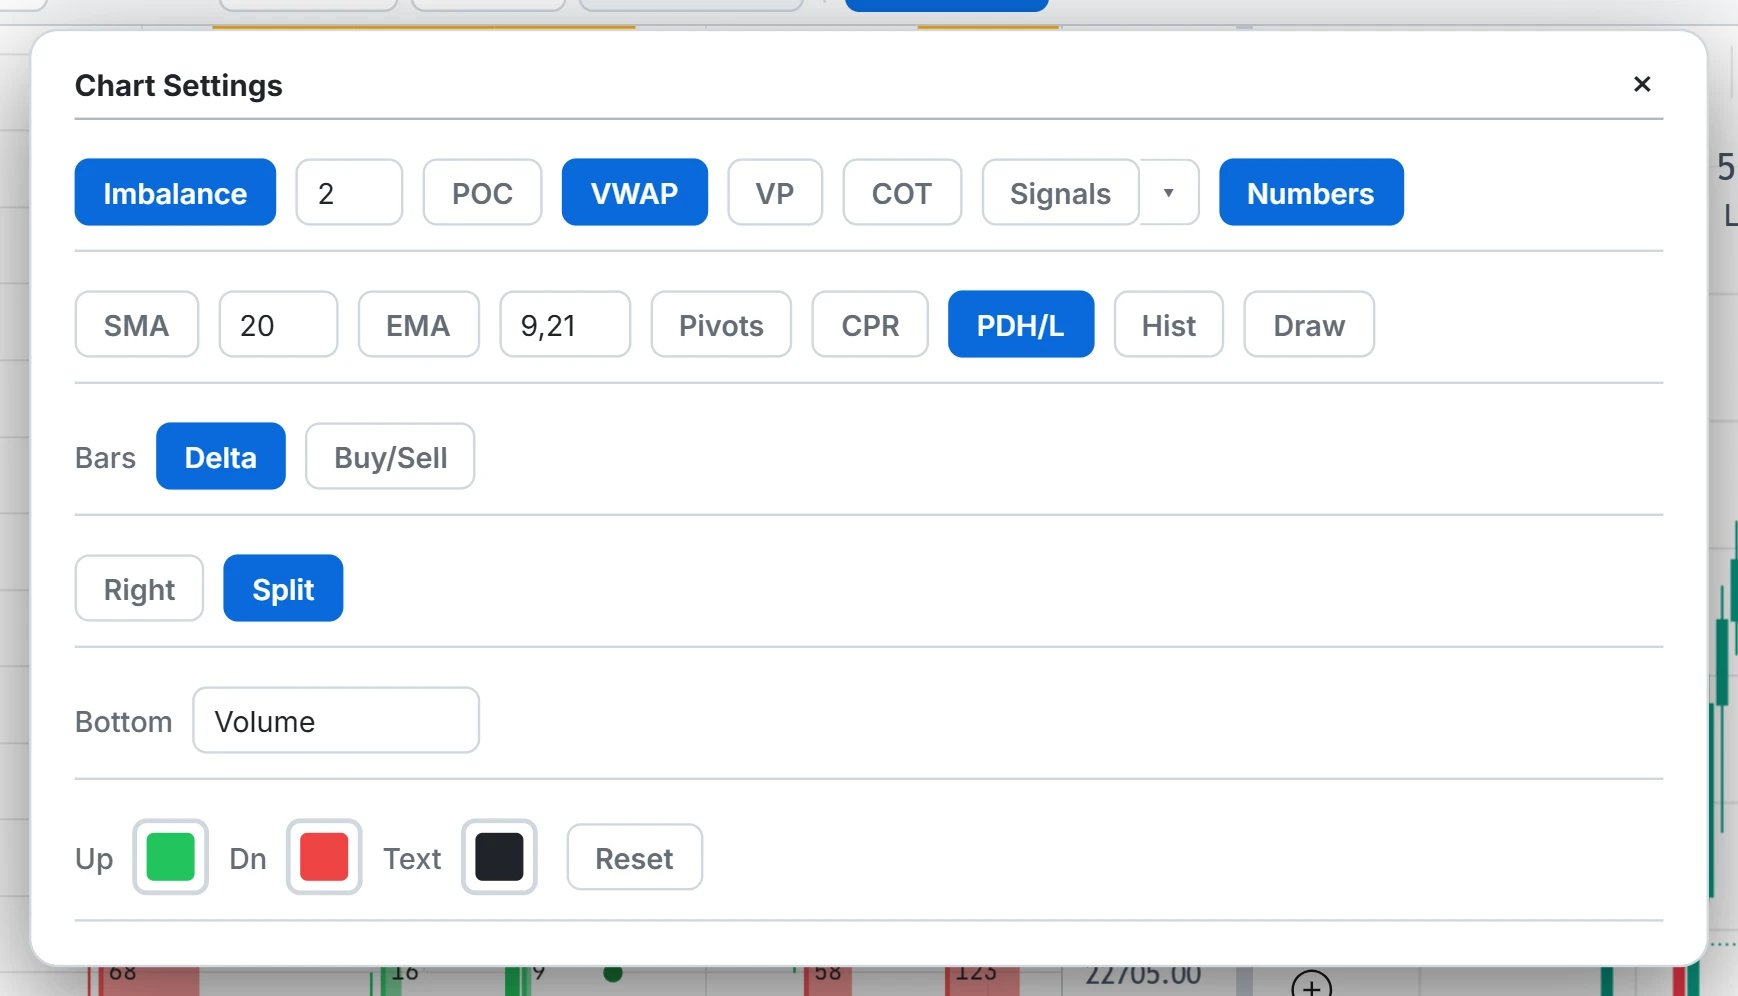
The threshold sits next to the Imbalance button under Settings. It is a ratio: 2 means 200%, 3 means 300%. It accepts values from 1 to 20 in steps of 0.5, and the default is 2.
| Threshold | What it does to the chart |
|---|---|
| 1.5–2 | Many marks. Useful on thin contracts, noisy on liquid ones. |
| 3 | A common reference level. Flags rows where one side traded three times the other. |
| 4 and above | Few marks, mostly at genuine one-sided bursts. |
The threshold and the row size interact. A smaller row holds less volume, so ratios swing more and the same threshold flags more rows. If you change row size, revisit the threshold.
When imbalances become stacked
A single imbalance is one row. A stacked imbalance is three or more imbalances in the same direction on consecutive rows of the same candle — a band of prices where one side kept winning as price moved through it.
The app draws a stacked zone as a shaded band across the candle with a bracket on the
left edge and a count label such as ×4 for four stacked rows. The run
breaks as soon as a row in between is not imbalanced in that direction.
Stacked zones are often watched as areas price may react to on a return, because they mark where one side was aggressive enough to move price several ticks without meeting resistance. Whether that holds on any given day is a separate question the chart cannot answer for you.
A worked example
Hypothetical NIFTY future candle, 5-point rows, threshold 3. Read the buy column against the sell column one row lower:
| Price | Sell x Buy (lots) | Buy ÷ sell below |
|---|---|---|
| 24,330 | 6 x 40 | 40 ÷ 9 = 4.4 → imbalance |
| 24,325 | 9 x 52 | 52 ÷ 12 = 4.3 → imbalance |
| 24,320 | 12 x 45 | 45 ÷ 8 = 5.6 → imbalance |
| 24,315 | 8 x 30 | 30 ÷ 25 = 1.2 |
| 24,310 | 25 x 18 | (no row below) |
Three consecutive buy imbalances, 24,320 to 24,330, form a stacked zone labelled ×3. Note that a side-by-side reading of 24,315 (8 sell, 30 buy) looks like a 375% imbalance, but on the diagonal it is only 1.2 — exactly the misreading the rule avoids.
Common mistakes
- Comparing the same row. It feels natural and it is wrong; the app always compares diagonally.
- Reading small numbers. 4 lots against 1 lot is a 400% imbalance and means very little. Check the size, not just the mark.
- Forgetting the classification. Buy and sell are inferred with the tick rule, so very quiet rows can lean one way simply by inheritance.
- Changing two settings at once. Change row size or threshold, not both, or you cannot tell which one moved the result.
Where to find it
- Open Footprint & Market Profile and load a futures or option symbol.
- Open Settings and make sure Imbalance is on (it is by default).
- Type a threshold in the box next to it.
- For the signals that build on these cells, read absorption, exhaustion, tails and divergence.
Common questions
What is a diagonal imbalance on a footprint chart?
It compares buy volume at one price with sell volume one row lower, and sell volume at one price with buy volume one row higher. Those are the two groups that actually traded against each other.
What does an imbalance threshold of 3 mean?
It means 300%: one side's volume must be at least three times the opposing volume on the diagonal row before the cell is marked. The default in the app is 2.
How many rows make a stacked imbalance?
Three or more consecutive rows in the same candle, all imbalanced in the same direction. The app shades the band and labels it with the count.
Why does my footprint show more imbalances after I reduced the row size?
Smaller rows hold less volume each, so ratios between neighbouring rows swing more and cross the threshold more often. Raise the threshold or use a larger row.
More on Footprint & Market Profile
More in Footprint & Market Profile · App: Footprint & Market Profile · Definitions: glossary · All: every article