What the signals are, and what they are not
The signals look at one place in each candle — the row at its high and the row at its low — and ask what the order flow there says about how that extreme was made.
They describe what happened in a finished or forming bar. They are not entries and they do not predict the next bar. Read them as labels on evidence you could have found yourself by staring at the cells, which is exactly how you should check them.
The cell basics are in footprint charts explained.
Thresholds scale with the bar
A fixed lot count would mean something different on a quiet option and on a busy NIFTY future. So every threshold is a share of the bar's own total volume, with a small floor so tiny bars do not trigger:
| Quantity | Threshold |
|---|---|
| Minimum volume on the extreme row for absorption | 2% of bar volume |
| Heavy delta for bar-level exhaustion | 10% of bar volume |
| Minimum volume on the trading side of a tail | 1% of bar volume |
| Delta size for divergence | 5% of bar volume |
| Rejection wick for tails and absorption | 2 rows or more |
At the candle high — three bearish reads
Only one badge is drawn per extreme, checked in this order:
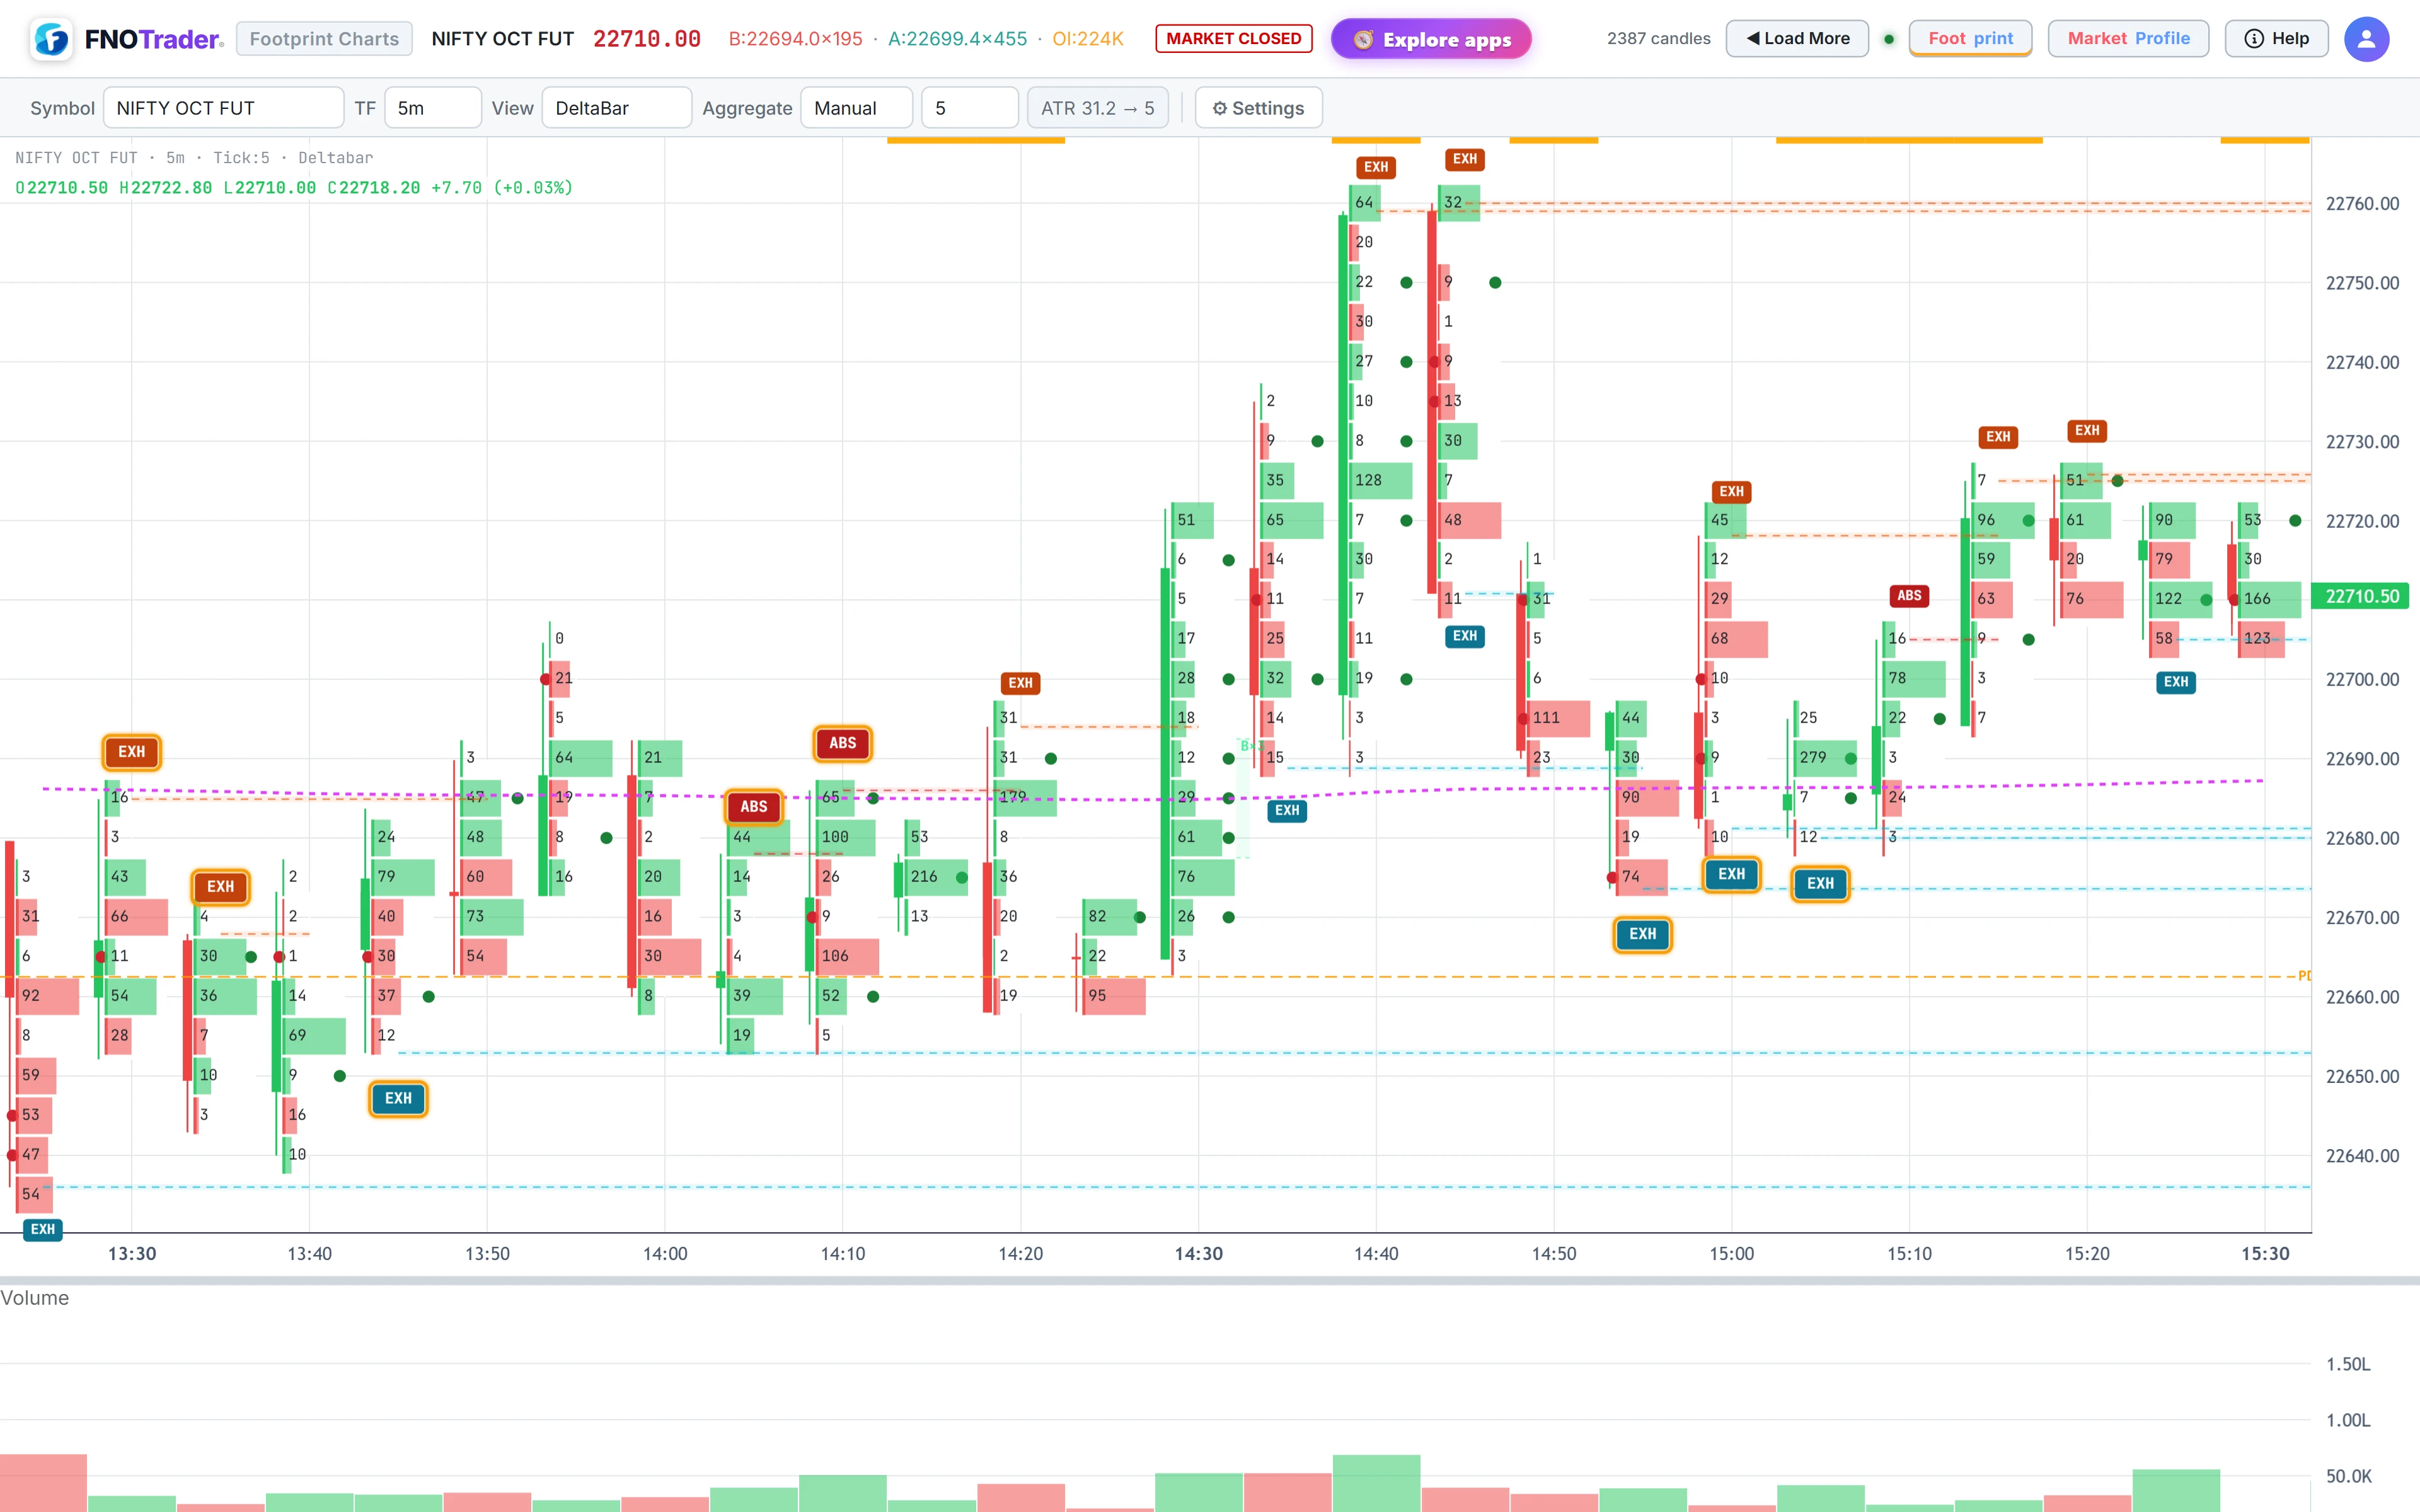
- ST — Selling Tail. At the high row, buy volume is zero and sell volume clears the tail minimum, with a wick of at least two rows. Price reached the high and only sellers traded there.
- EXH — Buying Exhaustion. Either the high row has zero sellers and real buying (buyers found nobody to trade against), or the bar has a two-row wick, a positive delta of at least 10% of its volume, and closed in its lower half — buyers pushed hard and price still finished low.
- ABS — Buying Absorption. A two-row wick, buy volume at the high at least twice the sell volume, the row carrying at least 2% of bar volume and buyers clearly ahead. Aggressive buying met resting sellers who absorbed it.
At the candle low — the mirror image
- BT — Buying Tail. Zero sellers at the low row, real buying, two-row wick.
- EXH — Selling Exhaustion. Zero buyers at the low with real selling, or a two-row wick with negative delta of at least 10% of volume and a close in the upper half.
- ABS — Selling Absorption. Two-row wick, sell volume at the low at least twice the buy volume, meaningful size, sellers clearly ahead.
Signals that print within five rows of the previous day's high or low, or the current day's high or low, get a gold ring, because an extreme near a reference level is usually worth a closer look.
Delta divergence
Divergence asks whether the candle's direction and its delta disagree:
- ▲DIV (bullish) — the candle closed at least one row above its open, yet delta was negative by at least 5% of bar volume. Sellers were more aggressive and price still rose.
- ▼DIV (bearish) — the candle closed at least one row below its open with a positive delta of the same size.
The one-row body filter keeps dojis out. Divergence can print on the same candle as one of the extreme-row signals, because it looks at the whole bar rather than one row.
A worked example
Hypothetical 5-minute bar: total volume 2,000 lots, open 24,300, high 24,340, close 24,310, 5-point rows. The upper wick is 24,340 − 24,310 = 30 points, six rows, so the wick filter passes.
The high row reads 14 x 0 (14 lots sell, 0 buy). Tail minimum is 1% of
2,000 = 20 lots. 14 is below 20, so no Selling Tail. Delta for the bar is +260, and 10% of
volume is 200, so delta is heavy; the close of 24,310 is below the bar's midpoint of 24,320.
That satisfies bar-level Buying Exhaustion, and the EXH badge prints at
the high.
Where to find them, and how to check them
- Open Footprint & Market Profile.
- Under Settings, click Signals to show them, and the small arrow beside it to pick which of the eight appear.
- For any badge, switch to the Buy/Sell view and read the row yourself. If the cell numbers are tiny, the signal is technically valid and practically weak.
Related: imbalances and COT High and Low.
Common questions
What is absorption on a footprint chart?
Absorption is heavy aggressive volume at a candle extreme that fails to push price further, because resting orders on the other side took it all. In the app it needs a two-row wick, one side at least twice the other at that row, and meaningful volume.
What is the difference between exhaustion and a tail?
A tail has zero volume on one side at the extreme plus a rejection wick. Exhaustion is either zero counterparty at the extreme or a bar with heavy delta that still closed against that side.
What does delta divergence mean?
The candle closed up while delta was negative, or closed down while delta was positive. The aggressive side lost the bar on price.
Are footprint signals buy or sell recommendations?
No. They label conditions in the order flow of a bar. They do not predict the next move, and they should be checked against the cells and the wider context.
More on Footprint & Market Profile
More in Footprint & Market Profile · App: Footprint & Market Profile · Definitions: glossary · All: every article