Two profiles, two questions
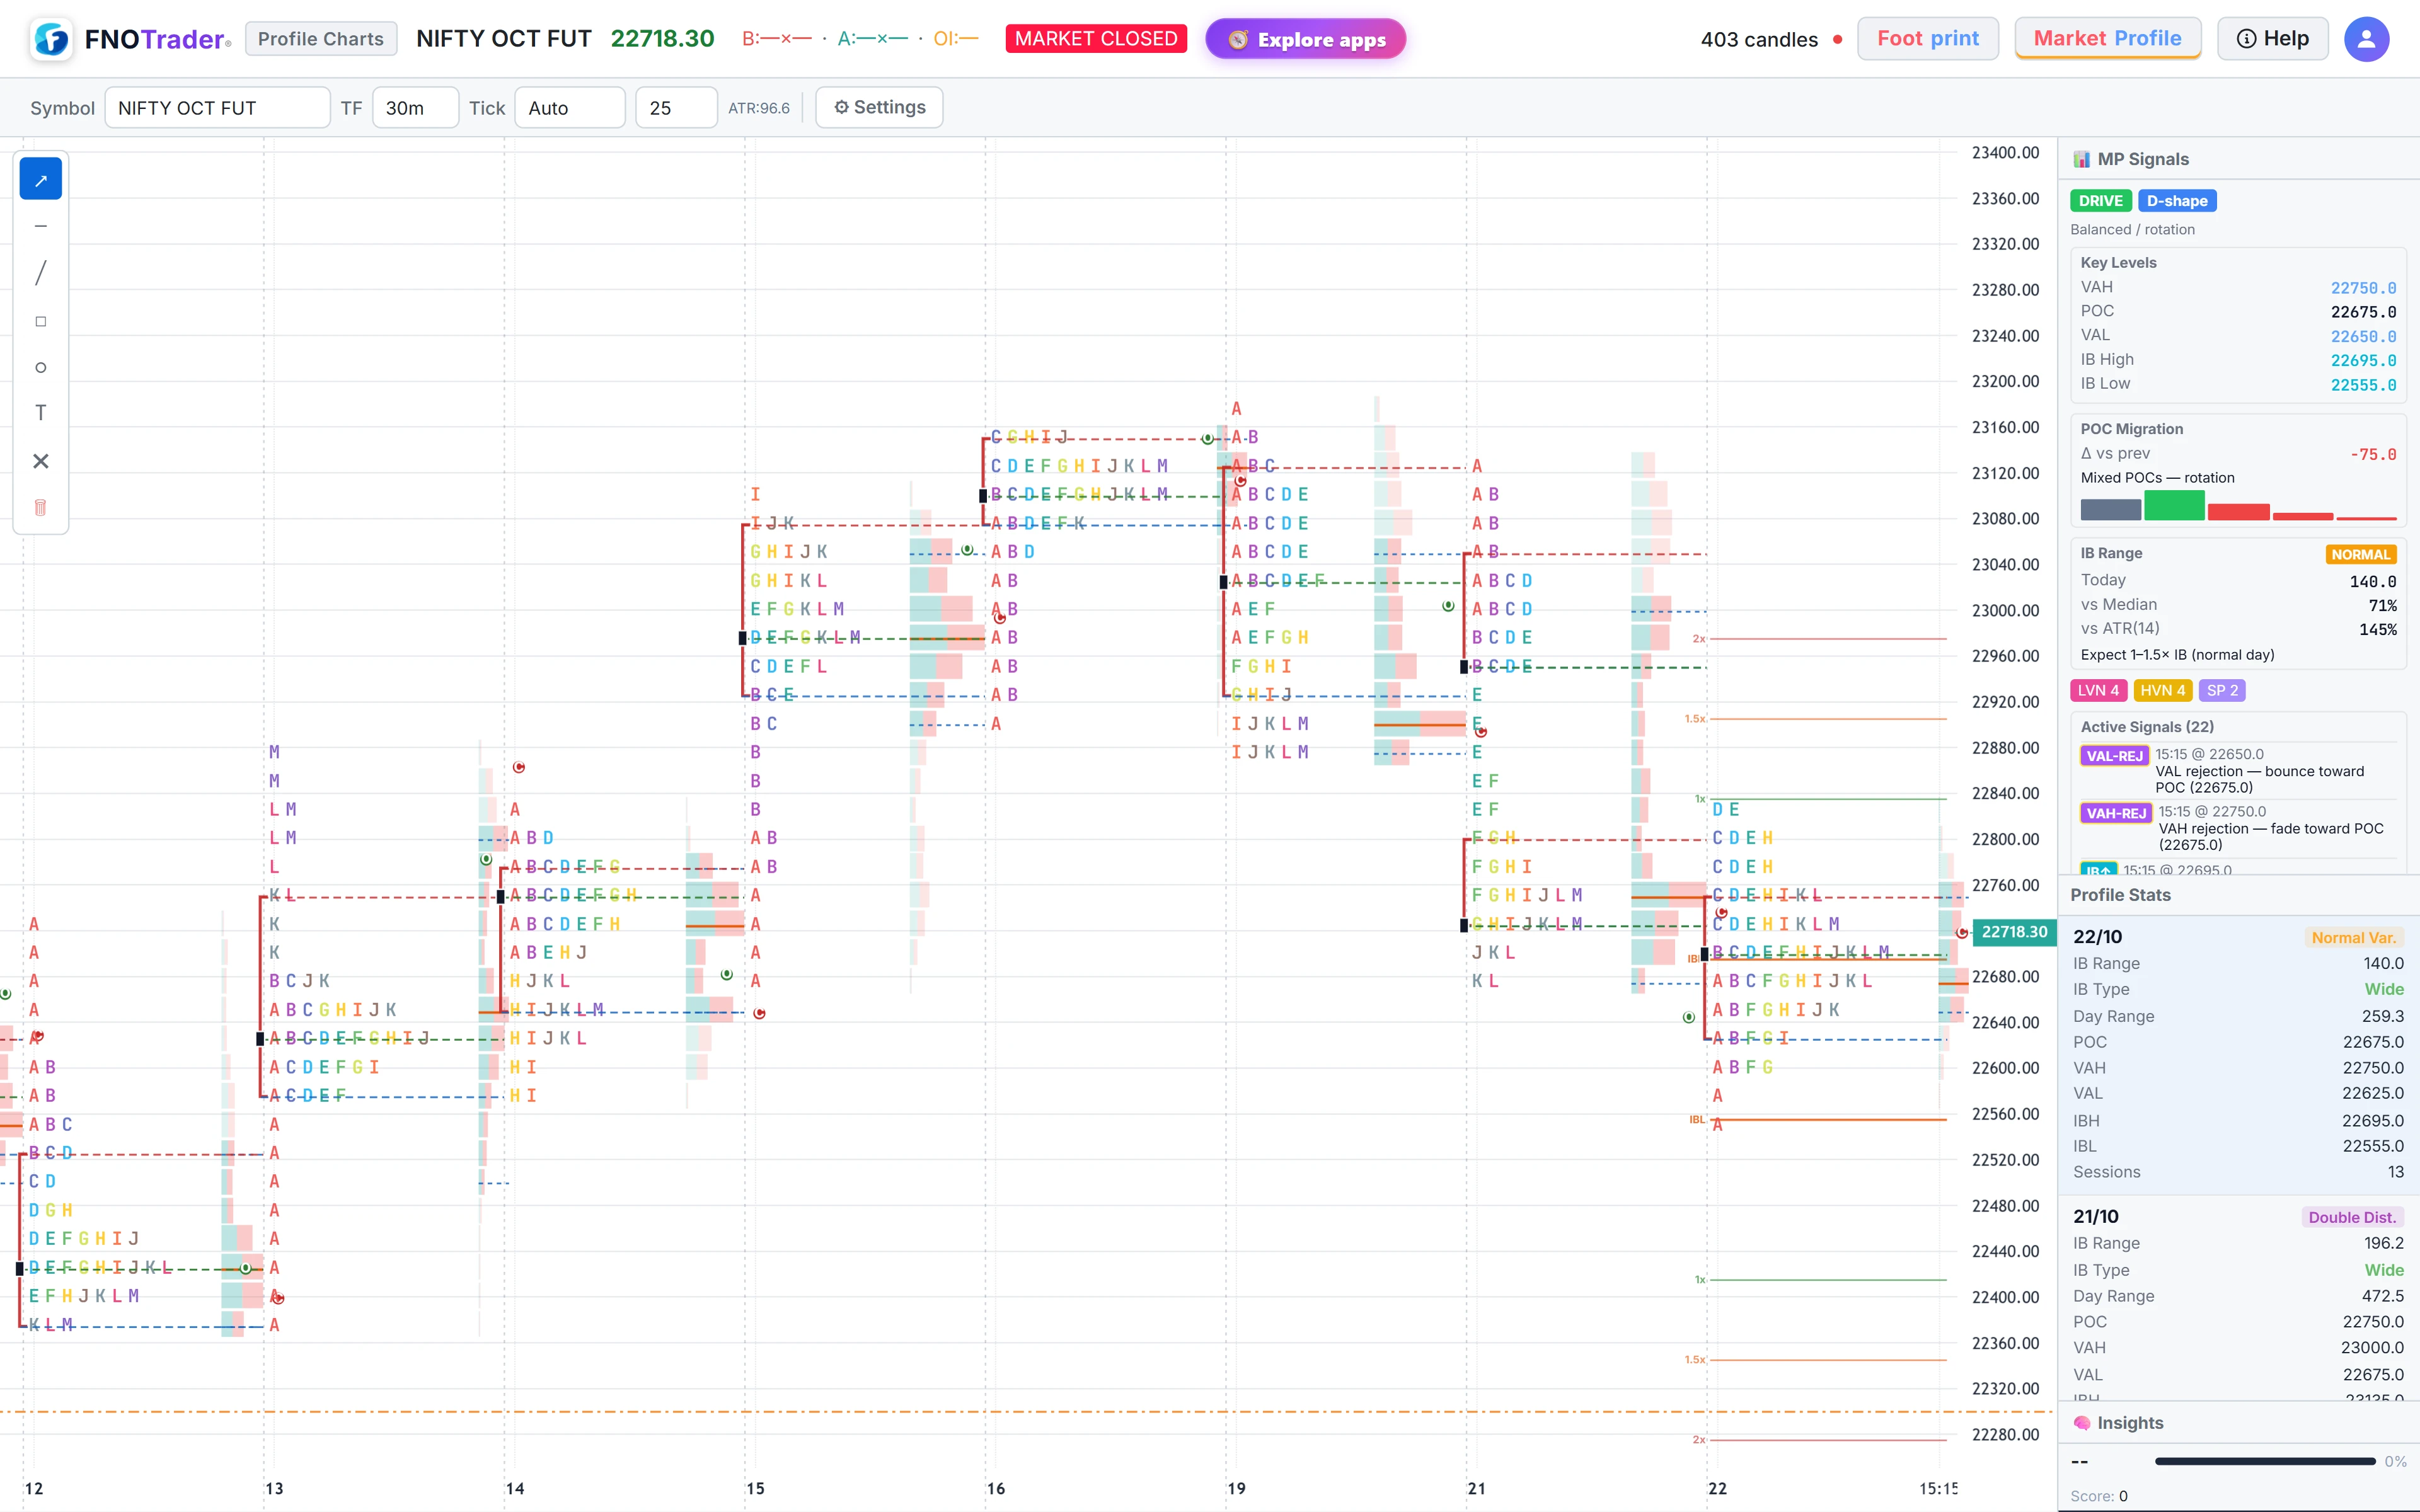
A TPO profile counts time at each price. A volume profile counts volume at each price. The page draws both side by side for every day.
They usually agree, and when they do not, that is information: a price the market visited often but traded little at is a different place from one where it traded heavily in a single burst.
TPO letters
The session is cut into 30-minute brackets from the exchange open. The first bracket is A, the next B, and so on. For NSE, A is 09:15–09:45 IST and the day runs to M. MCX's longer session continues past Z into lower-case letters.
Every price row the market traded in during a bracket gets that bracket's letter, once. A row with five letters was visited in five different half-hours. Stack the letters and the day's shape appears.
Expand under Settings switches between wider letter blocks and a more compact view. Index symbols have no traded volume, so for them the page builds the TPO profile only.
POC and the 70% value area
- POC (point of control) — the row with the most letters in TPO, or the most volume in the volume profile.
- Value area — starting at the POC, the page repeatedly adds whichever neighbouring row (above or below) holds more, until 70% of the day's total is inside. The top is VAH, the bottom VAL.
The volume profile is built from the footprint's per-row volume where available, so its rows use the same classified buy and sell split. Where only candle data exists, a bar's volume is spread evenly across its range.
Two styles are offered under Settings: VP: Buy/Sell splits each bar into buying and selling colours, VP: Classic draws a single soft bar per row.
Initial balance and extensions
The initial balance (IB) is the high and low of the first 60 minutes of the session — brackets A and B on NSE. It is a reference for how wide the early auction was and whether the day later extended beyond it.
The IB button draws IB high and low; its small arrow lets you add extension lines at 0.5×, 1×, 1.5×, 2× and 3× the IB range above and below (1×, 1.5× and 2× are ticked by default). By default the IB is drawn on the newest day only; an option shows it on every day.
The day stats beside each profile classify the IB as Narrow, Medium or Wide by comparing it with the 14-bar average true range.
A worked example
Hypothetical NSE session, 10-point rows. Brackets A and B trade between 24,300 and 24,380, so the IB is 80 points: IB high 24,380, IB low 24,300. The 1× extensions are 24,460 and 24,220; 1.5× are 24,500 and 24,180.
Suppose the profile has 120 letters in total and the 24,340 row has the most, 11. That is the TPO POC. The value area target is 70% of 120 = 84 letters. Starting with 11 at 24,340, the page adds the larger neighbour each step — say 24,350 with 10, then 24,330 with 10, and so on — until the running total reaches 84. If that happens with rows 24,300 to 24,370 included, VAL is 24,300 and VAH is 24,370.
Settings that change the answer
- Row size. Auto picks a step from recent ATR; Manual lets you fix one. A larger step merges rows and can move the POC by a full step. The finest row is one exchange tick.
- Timeframe. The page uses 5, 15 or 30-minute candles (30 by default) for drawing; profiles use 1-minute data where available for accurate highs and lows.
- TPO versus volume levels. Each profile has its own POC and value area. The day stats and signals use the volume profile's.
Where to find it
- Open Market & Volume Profile and search a symbol.
- Pick a timeframe and row size (Auto or Manual).
- Under Settings, toggle TPO, VP, POC, VAH, VAL and IB, and choose a VP style.
Next: open types, shapes and day types.
Common questions
What is a TPO in Market Profile?
A time price opportunity. Each 30-minute bracket of the session gets a letter, and every price traded in that bracket gets the letter once. Rows with more letters are where the market spent more time.
How is the 70% value area calculated?
Start at the point of control and repeatedly add whichever adjacent row holds more letters or volume until 70% of the day's total is inside. The edges are VAH and VAL.
What is the initial balance?
The high and low of the first 60 minutes of the session. On NSE that covers the A and B brackets from 09:15 to 10:15 IST.
What is the difference between TPO and volume profile?
TPO counts time spent at each price; volume profile counts volume traded there. Each has its own POC and value area, and they do not always agree.
More on Footprint & Market Profile
More in Footprint & Market Profile · App: Market & Volume Profile · Definitions: glossary · All: every article