What it is, and the trap it avoids
The app keeps every fund's disclosed portfolio each month and compares the latest with the one before, stock by stock. Search a stock to see what every fund did in it, or a fund to see every stock it added or cut.
The trap is reading weights. If a stock rises 25% while the fund does nothing, its weight rises too. Compare weights and you would call that buying. So the app works in shares: disclosed market value ÷ that day's closing price, using split- and bonus-adjusted prices so a split between two disclosures does not look like a purchase.
The five actions
| Action | Meaning |
|---|---|
| New | In this month's portfolio, not in the previous one |
| Added | Implied shares up by at least 1% |
| Trimmed | Implied shares down by at least 1% |
| Exited | In the previous portfolio, gone from this one |
| Hold | Share change within ±1% |
The ±1% band exists because disclosed rupee values are rounded and the valuation price may differ slightly from the close; smaller moves are noise. Some older months were stored before market values were recorded. For those, value is estimated from weight × the fund's AUM, which ignores the fund's own inflows that month, so the band widens to ±5% and the row is marked est.
A fund is only compared against a previous disclosure no more than three months older. Arbitrage funds are left out entirely: their stock legs are hedged positions rolled every month, and would flood New and Exited with trades that carry no view.
A worked example
A hypothetical fund disclosed ₹50 crore in a stock last month at a close of ₹1,000: 50,00,00,000 ÷ 1,000 = 5,00,000 shares. This month it discloses ₹60 crore at a close of ₹1,250: 4,80,000 shares.
- Rupee value rose 20% — it looks like buying.
- Shares fell from 5,00,000 to 4,80,000, a 4% drop, beyond the 1% band: Trimmed.
- Net ₹ flow = change in shares × the latest close = −20,000 × ₹1,250 = −₹2.5 crore.
The manager sold into the rally. Weights alone would have told you the opposite.
The stock view and the fund view
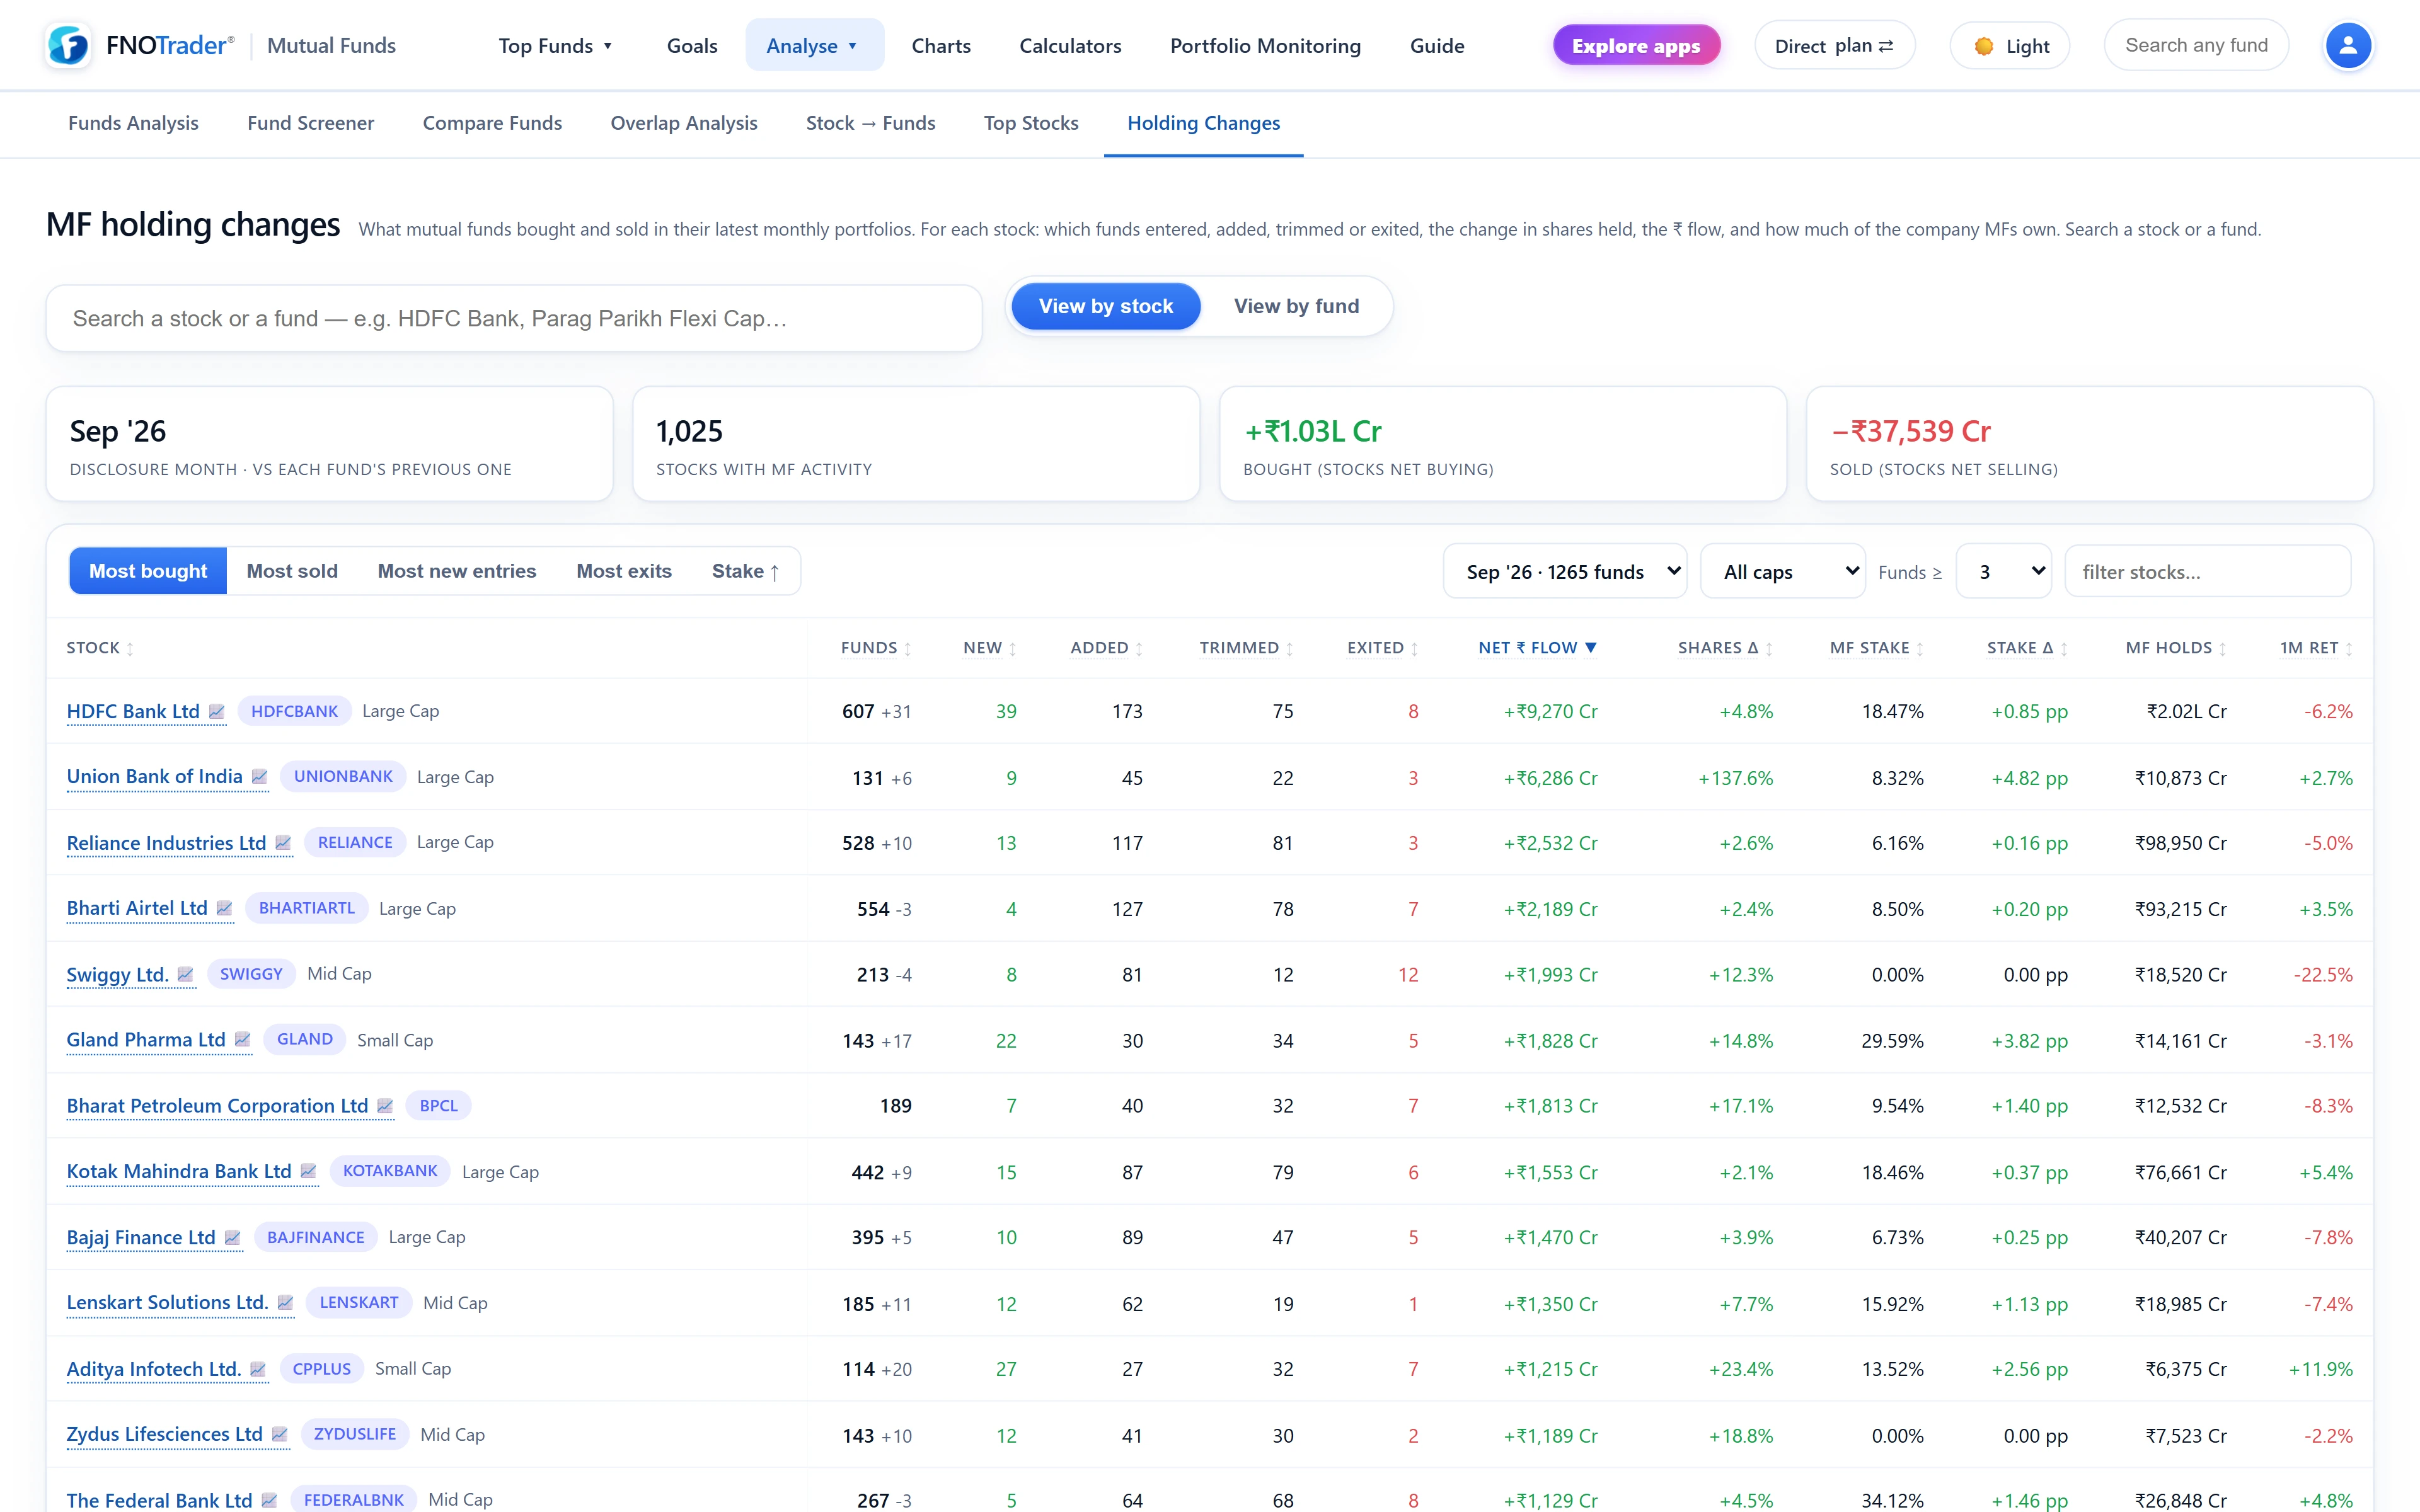
By stock, each row aggregates every fund: funds holding now (and the change), counts of New, Added, Trimmed and Exited, net ₹ flow, shares change, MF stake (implied shares ÷ the company's shares outstanding, summed across the funds) and its change in percentage points, total MF holding value, and the stock's own 1-month return. Quick views sort by most bought, most sold, most new entries, most exits and largest stake increase. A minimum-funds filter (default 3) and a cap filter keep thinly held names out. Open a stock for every fund's action and a month-by-month stake history for the last six months, like a shareholding-pattern page.
By fund, each row shows stocks held, counts of each action, ₹ bought, ₹ sold, net, and churn: half the gross traded value as a share of AUM. A fund that bought ₹300 crore and sold ₹200 crore on ₹10,000 crore of AUM has churn of (300 + 200) ÷ 2 ÷ 10,000 = 2.5% for the month.
Timing and limits
- Disclosures lag. Portfolios arrive about ten days after month-end, so the newest month fills in over the first half of the following month. The month picker defaults to the month most funds have published, and shows how many funds each month covers.
- Monthly granularity. A position bought and sold within one month never appears.
- Flow is an estimate. It values the share change at the latest close, not at the manager's actual trade prices.
- Fund buying is not a signal. Funds also buy because they received inflows and must deploy them. For the current snapshot, see Top Stocks.
Where to find it
- In Mutual Funds, open Analyse → Holding Changes.
- Choose the month, then a quick view, or search a stock or fund.
- Click a stock for every fund's action and its stake history, or a fund for its full list of trades.
Common questions
How can I see which stocks mutual funds bought last month?
Holding Changes compares each fund's latest monthly portfolio with the previous one. The Most bought view ranks stocks by net rupee flow across all funds.
Why does a stock show Trimmed when the fund's holding value went up?
Changes are measured in implied shares, value divided by the closing price. If the price rose more than the value, the fund holds fewer shares.
What does est mean on a holding change?
The comparison month was stored without market values, so value was estimated from weight and AUM. Those rows need a 5% share change to count as Added or Trimmed.
When is last month's data complete?
Funds disclose about ten days after month-end, so the newest month fills in over the first half of the next month.
What is fund churn in Holding Changes?
Half of the rupees bought plus sold in the month, as a percentage of the fund's AUM.
More on Mutual Funds
More in Mutual Funds · App: Mutual Funds · Definitions: glossary · All: every article