Five pages, slow-moving by design
This is end-of-day and fortnightly data. It sets context for days and weeks, not for the next five minutes.
The FII/DII menu holds Cash Market Activity, FII Index Activity, Participant Open Interest, MWPL and Ban List, and FPI Sector Flows. The general idea of what FII and DII flows mean is covered in FII and DII flows explained; this post is about reading these pages.
Cash Market Activity shows daily FII/FPI and DII buy, sell and net in ₹ crore over a date range, as bars and a day-wise table. The pattern over a run of days is the point, not any one row.
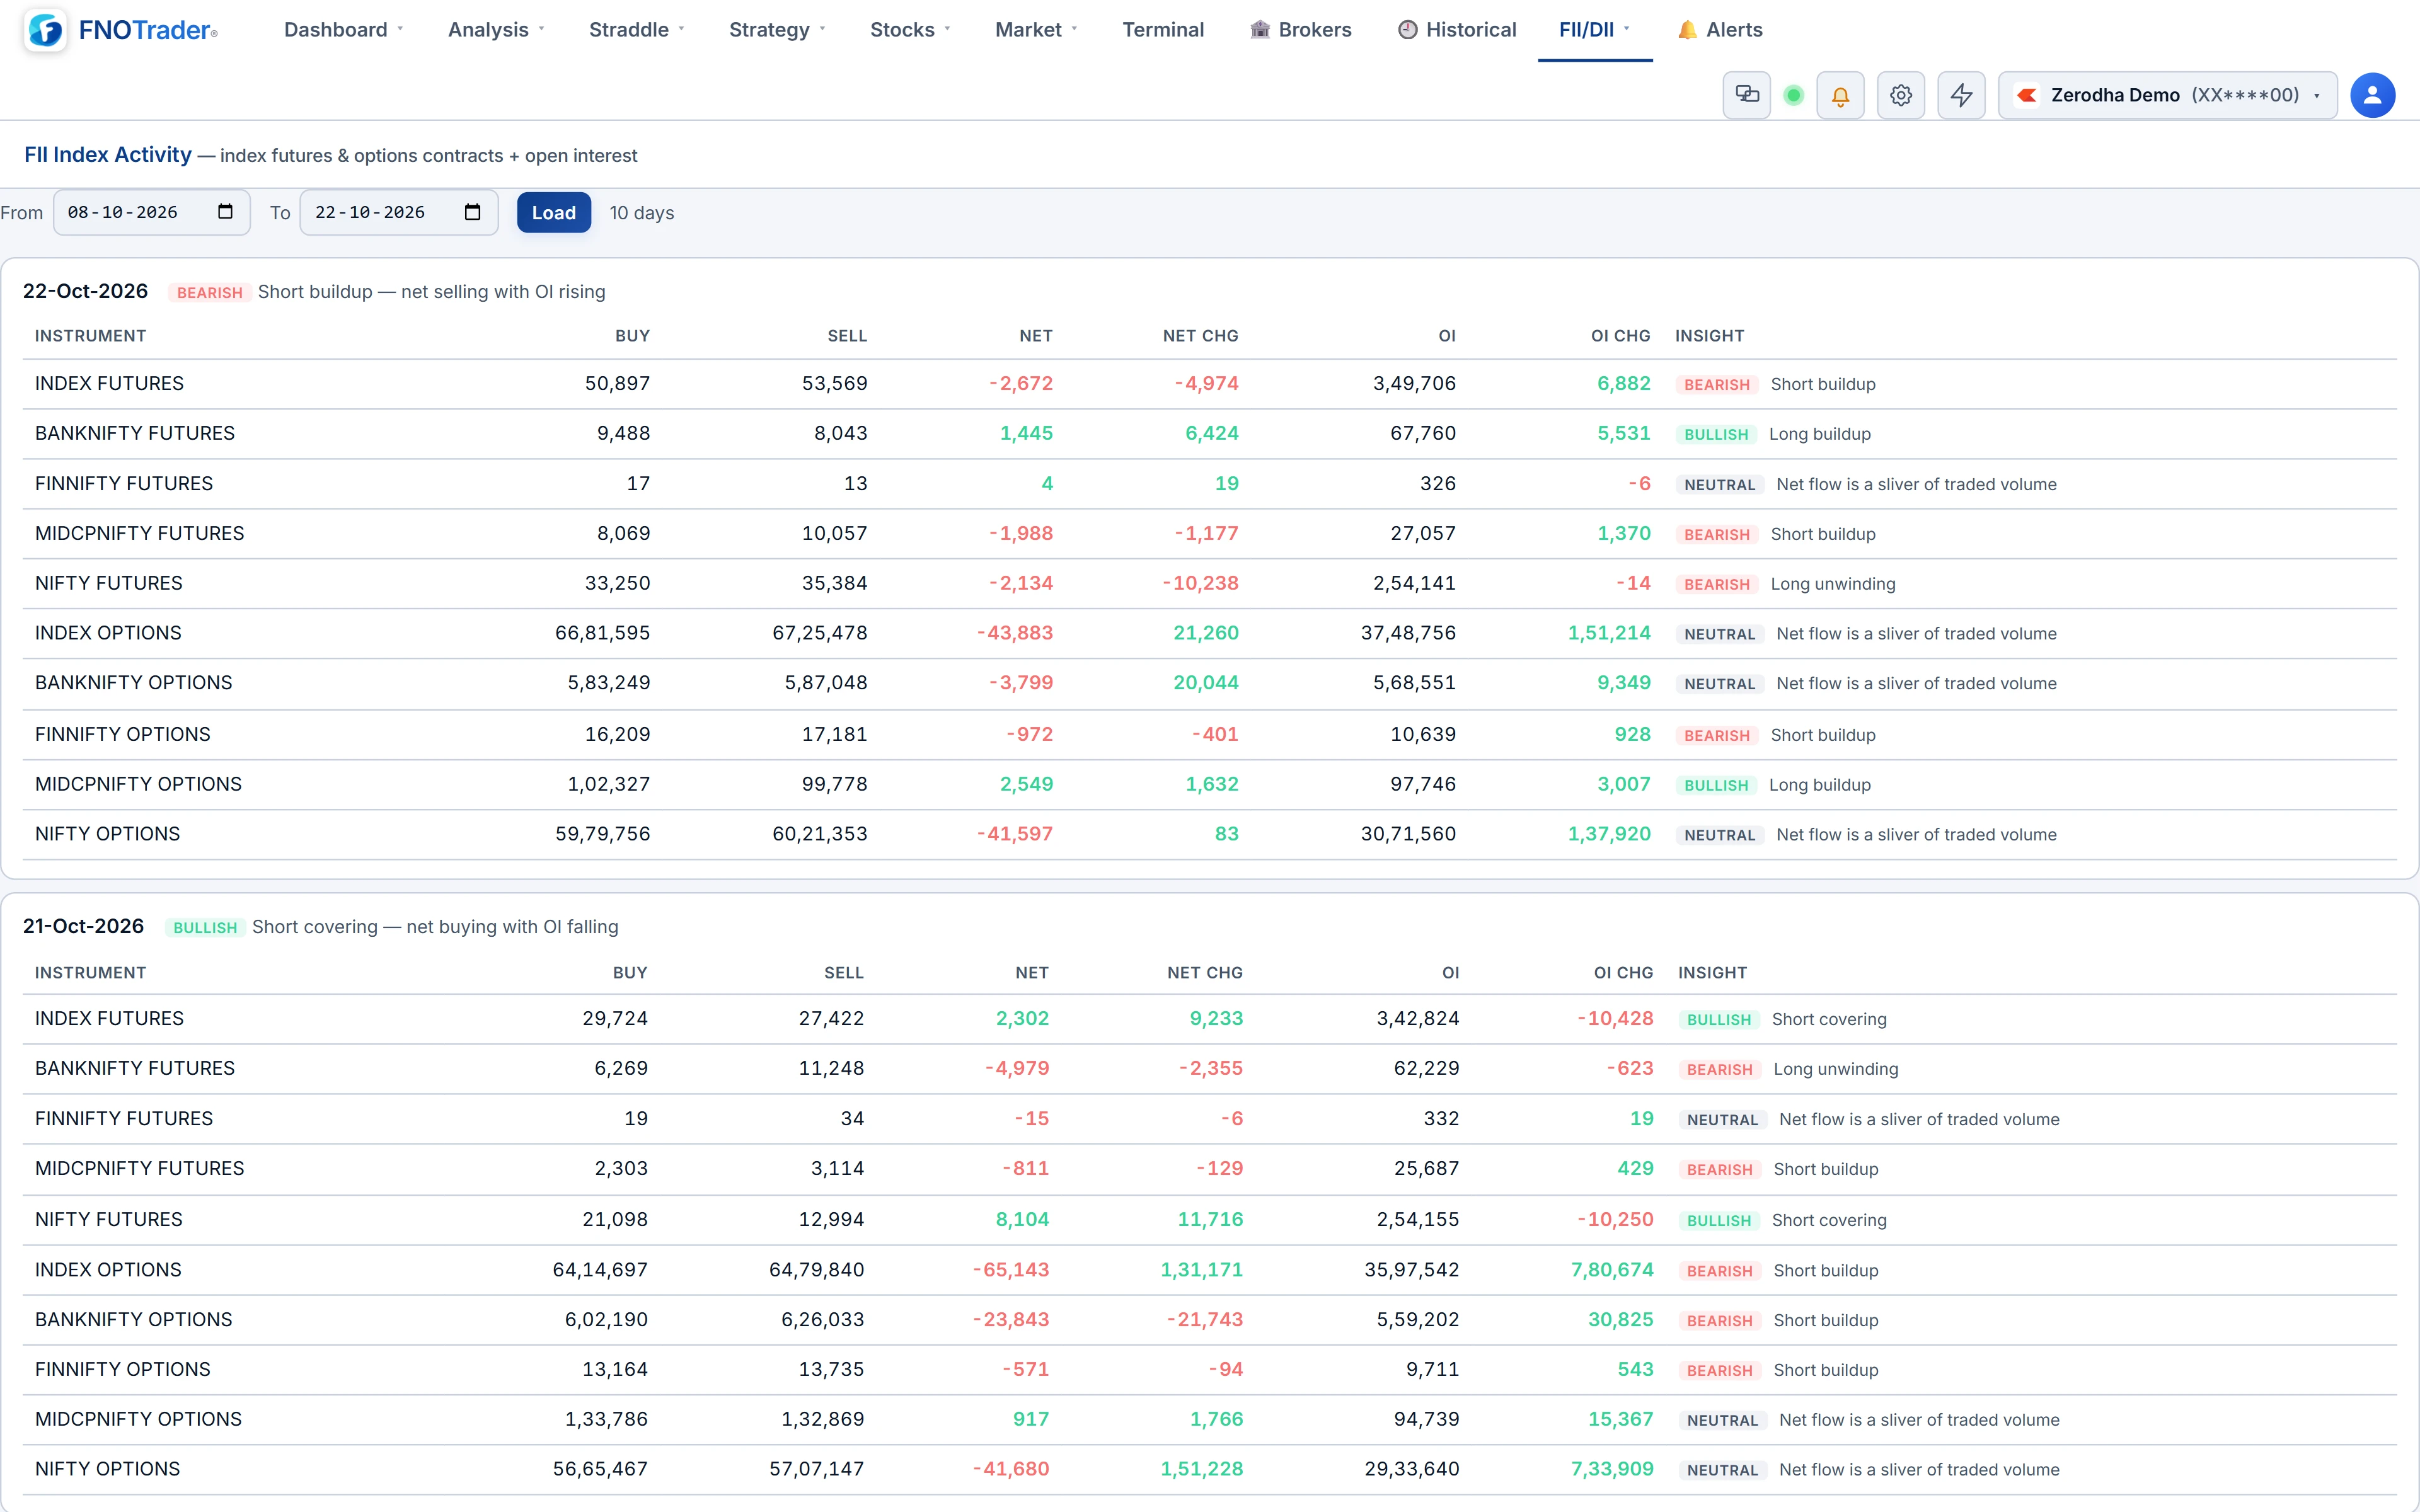
FII Index Activity: flow against OI
For each day, FII positioning in index futures, index calls and index puts: contracts bought, sold, net, open interest and OI change. Each row gets a stance chip from net flow against OI change:
| Net flow | OI | Read |
|---|---|---|
| Buy | Up | Long buildup — Bullish |
| Buy | Down | Short covering — Bullish lean |
| Sell | Up | Short buildup — Bearish |
| Sell | Down | Long unwinding — Bearish lean |
If the net is a sliver of the day's traded contracts — under 0.5% of them, or under 50 contracts — the chip reads Neutral instead of forcing a direction. Index futures carry the day-level read, because option rows combine calls and puts.
Participant OI: who is on which side
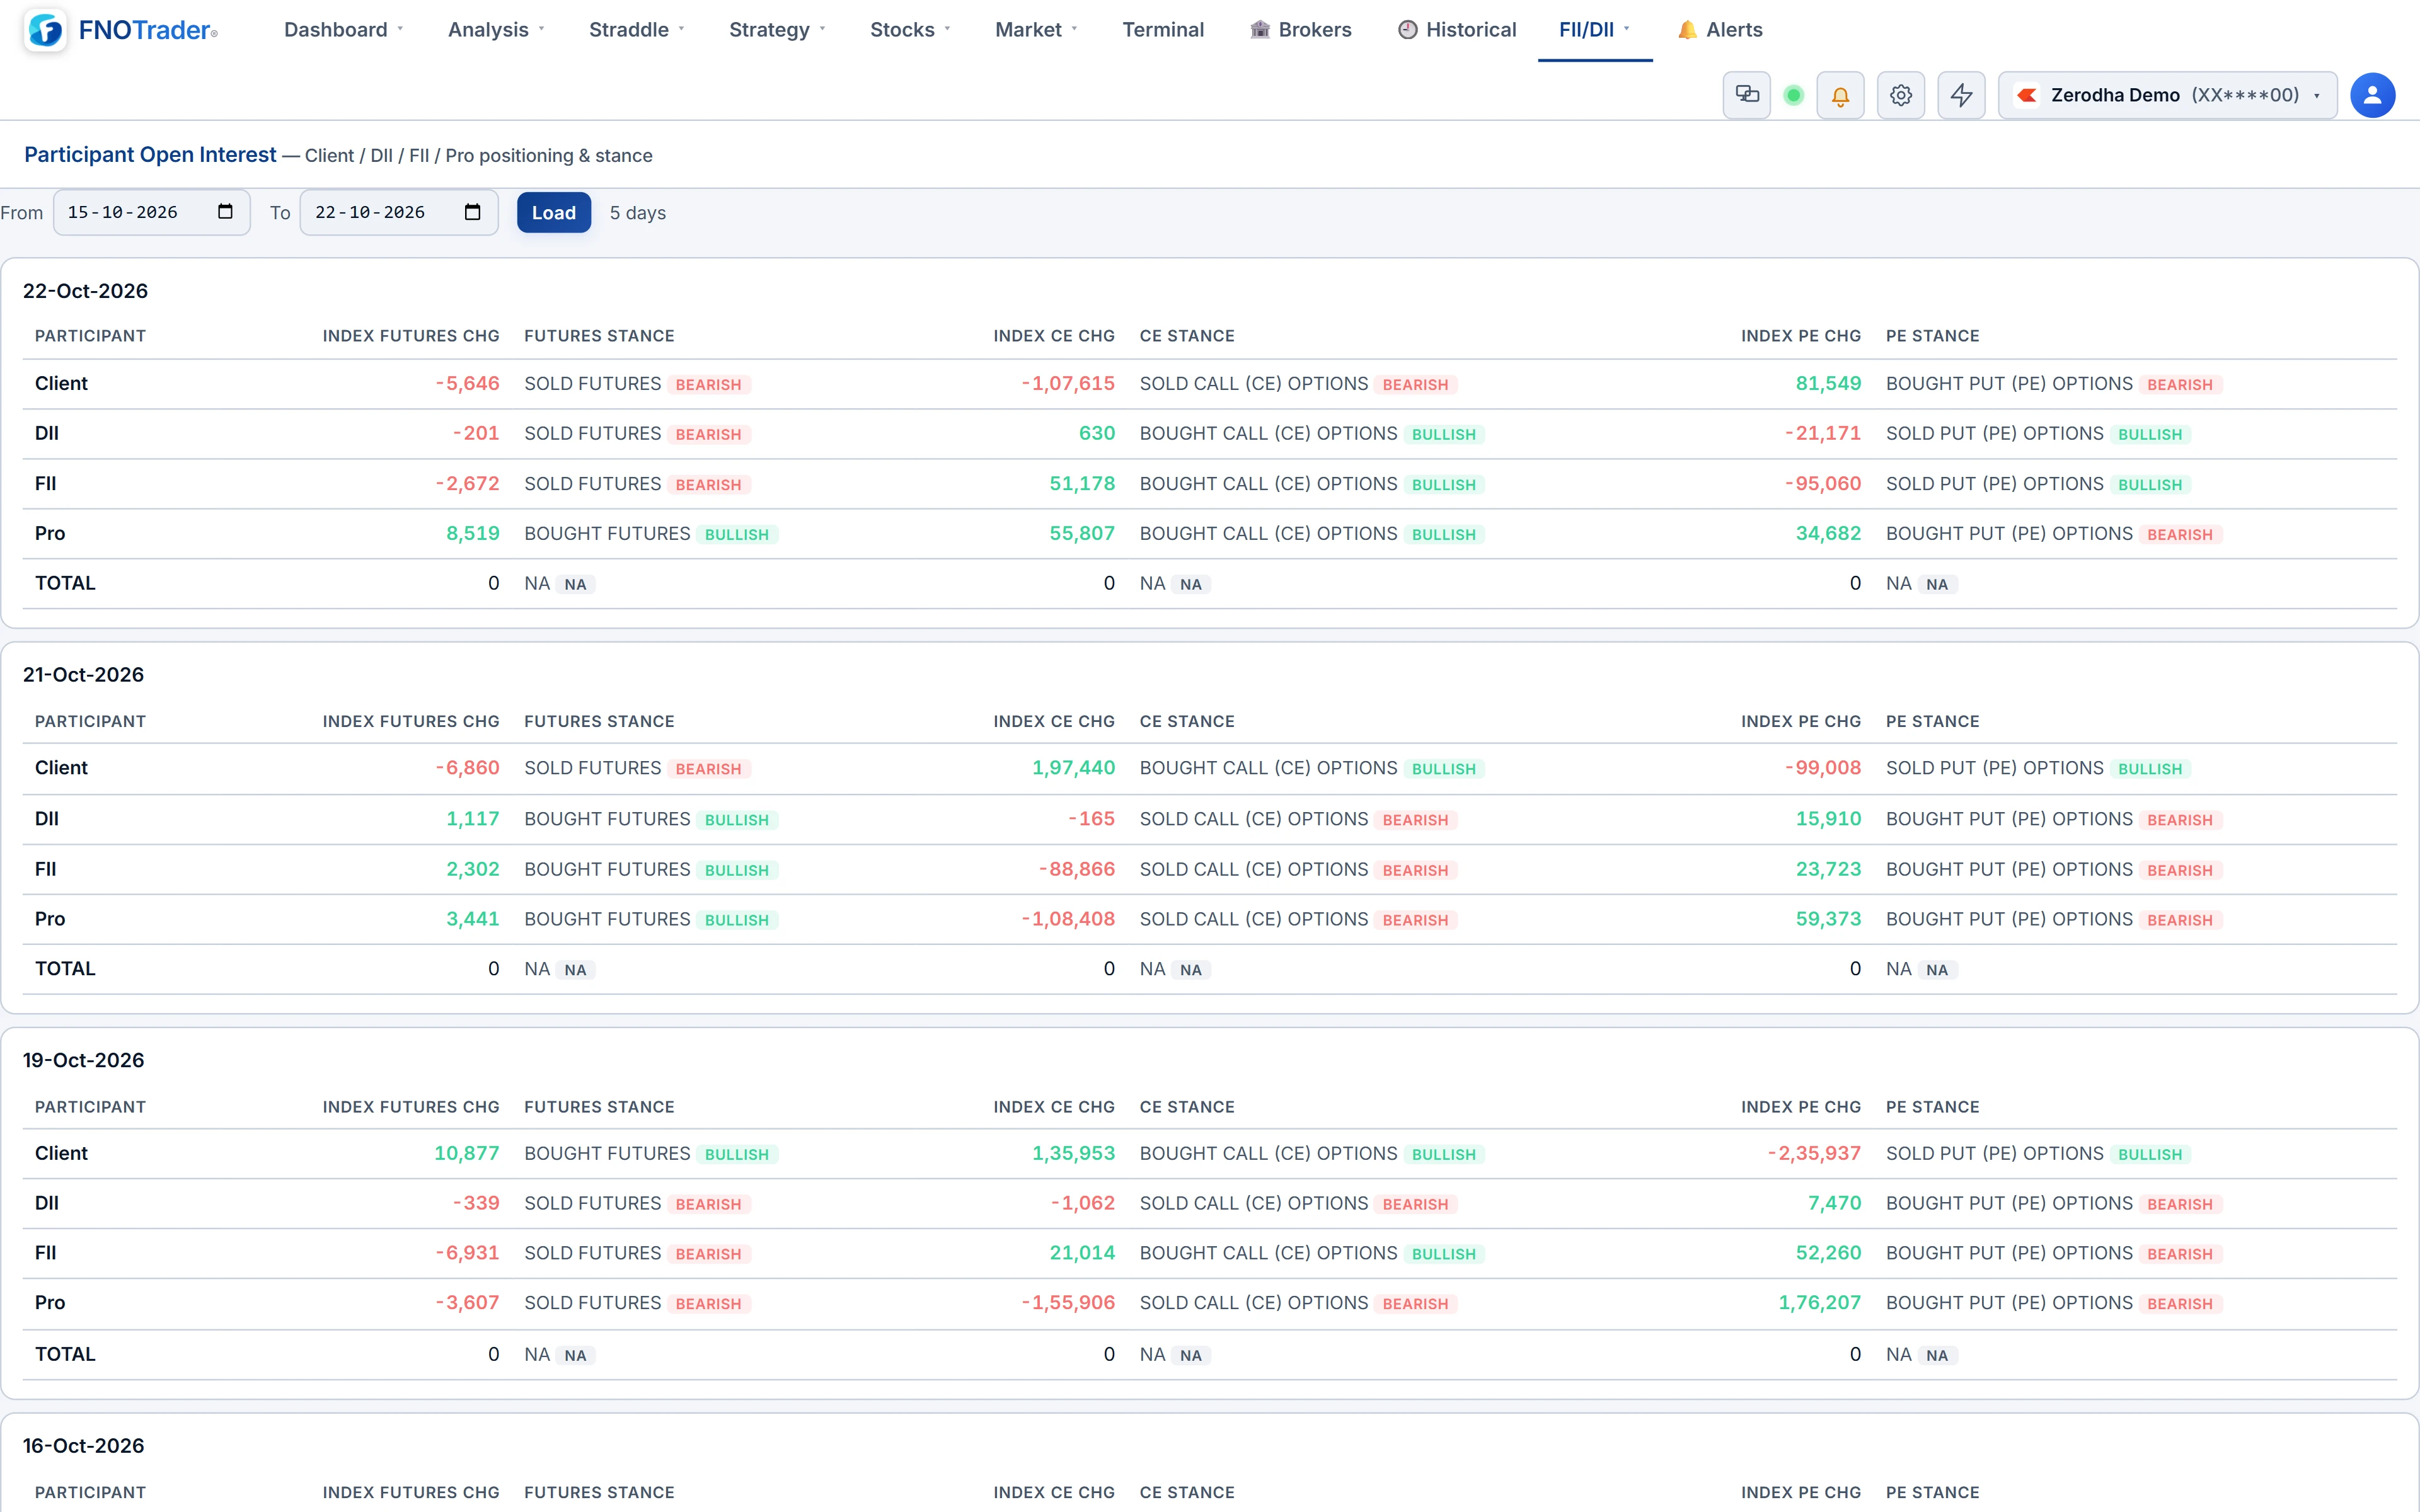
NSE splits F&O open interest by Client, DII, FII and Pro. This page shows each group's day-over-day change in net index position across futures, calls and puts, with a stance per cell: futures or calls net bought read bullish; puts net bought read bearish, puts net sold bullish.
Read the rows against each other. When FII and Pro lean one way on index futures and Client leans the other, that divergence is the story. Use it as a positional overlay over days; one session's change is noise.
MWPL and the ban outlook
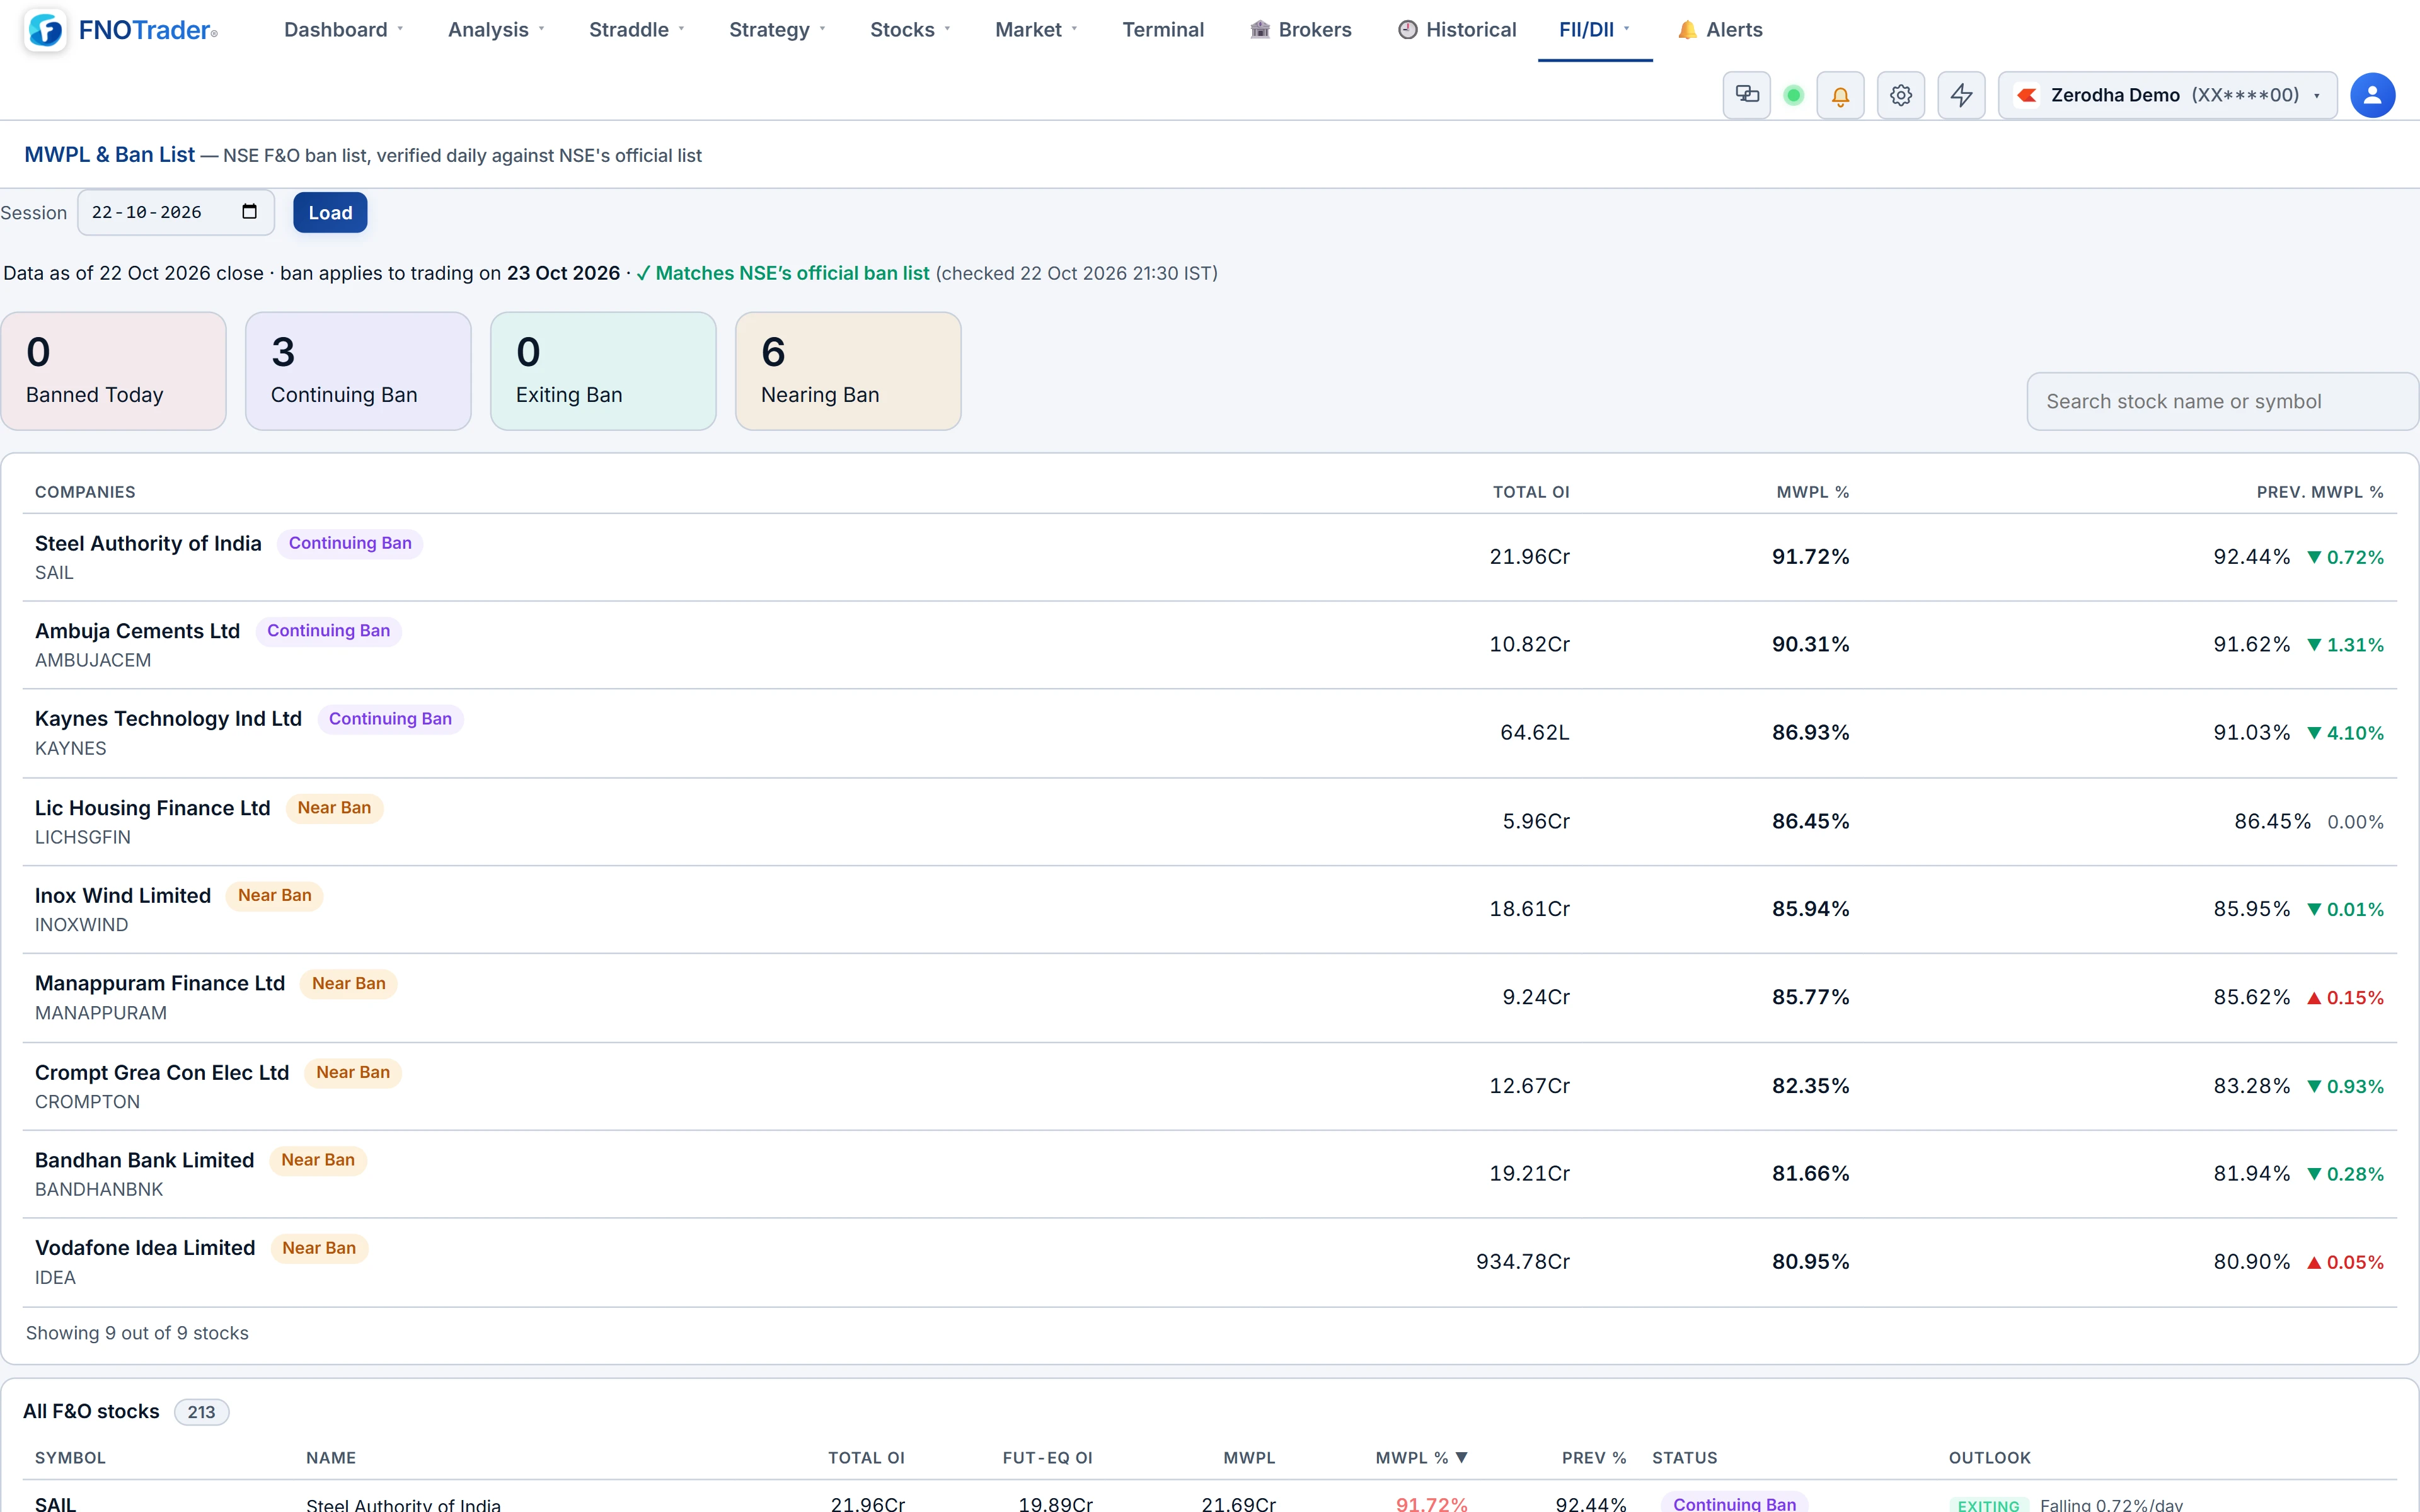
Every F&O stock has a market-wide position limit. When OI crosses 95% of it the stock enters the ban — no fresh positions, only reductions — and it leaves only when utilisation falls below 80%. The page shows OI, MWPL, MWPL % and the previous day's %, shaded amber from 80% and red from 95%, and projects an outlook from the day-over-day change:
- Not banned, rising: BAN IMMINENT if about two days or fewer to 95%; HIGH RISK within six days or at 88% and above; WATCH from 75%.
- Not banned, flat: HIGH RISK at 90% and above; WATCH at 80% and above.
- Banned: EXIT SOON if falling fast enough to clear 80% in three days or less, EXITING if slower, STUCK IN BAN if not falling.
Hypothetical: a stock at 91% that was at 88% yesterday is rising 3 points a day. (95 − 91) ÷ 3 = 1.3 days → BAN IMMINENT. A banned stock at 92% that was at 95% is falling 3 a day: (92 − 80) ÷ 3 = 4 days → EXITING. These are straight-line projections; one day of heavy unwinding or fresh OI changes them.
Dedicated sections list the current ban list, a ban watch of names closest to entry, and the exchange's possible entrants and exits.
FPI Sector Flows
Built from NSDL's fortnightly sector-wise FPI report. Pick a fortnight, an asset group (Equity, Debt, Hybrid, Mutual Funds, AIF) and ₹ crore or USD million. You get the net flow per sector for the latest and prior fortnight, a ranked bar chart from biggest inflow to biggest outflow, and AUC — assets under custody, the value of FPI holdings in the sector on that date. AUC is a snapshot, not a flow, and it rises with prices even when nobody buys.
It confirms or questions a sector's price strength over weeks. It updates twice a month, so it is no help for timing.
Where to find them
- Open Options Analytics → FII/DII.
- Choose the page, set a date or range, and press Load.
- On MWPL and Ban List, sort by MWPL % or search a symbol; a weekend date shows the session before it.
Before writing options on a stock near the ban, check its straddle and IV on Stocks ATM Straddle.
Common questions
When does a stock enter and exit the F&O ban?
It enters when market-wide open interest crosses 95% of its MWPL and exits only when utilisation falls back below 80%.
What does BAN IMMINENT mean on the MWPL page?
At the current day-over-day rise, the stock would reach 95% of MWPL in about two sessions or fewer. It is a straight-line projection.
What do Client, DII, FII and Pro mean in participant OI?
They are NSE's participant categories: retail and HNI clients, domestic institutions, foreign investors and proprietary trading desks.
How often is FPI sector data updated?
Fortnightly, from NSDL's sector-wise FPI report.
More on Options App
More in Options App · App: Options Analytics · Definitions: glossary · All: every article