What the page answers
Which stocks have expensive options right now, relative to their own price?
The at-the-money straddle — buying the ATM call and the ATM put — costs roughly what the market expects the stock to move, in either direction, by expiry. It is not a forecast; it is a price, set by people taking the other side. But it is the cleanest single number for "how much movement is being paid for".
Raw straddle prices cannot be compared across stocks. The Stocks ATM Straddle page puts every F&O underlying in one sortable table and expresses the straddle as a percentage of the price, which makes a ₹2,000 stock and a ₹200 stock directly comparable.
The columns, left to right
| Column | Meaning |
|---|---|
| EX, Expiry | NFO or BFO, and the nearest option expiry being shown |
| Spot, Chg, Chg% | Cash price and change from the previous close |
| RVOL | Today's volume divided by the 20-day average daily volume |
| Future, Chg, Chg% | Current-month futures price and change |
| ATM, CE, PE | The strike nearest spot and its call and put premiums |
| Straddle | ATM CE + ATM PE |
| Straddle %Spot | Straddle as a % of spot (or of the future — see the toggle) |
| ATM IV | Annualised implied volatility at the ATM strike |
| Max CE OI, CE %From | The strike with the most call OI, and its distance from price in % |
| Max PE OI, PE %From | The strike with the most put OI, and its distance from price in % |
| Lot | Contract lot size |
The % vs Spot / % vs Future toggle changes the base for all three percentage columns at once. Use the future when the basis is large — around dividends, for instance — because options are priced off the forward, not the cash price.
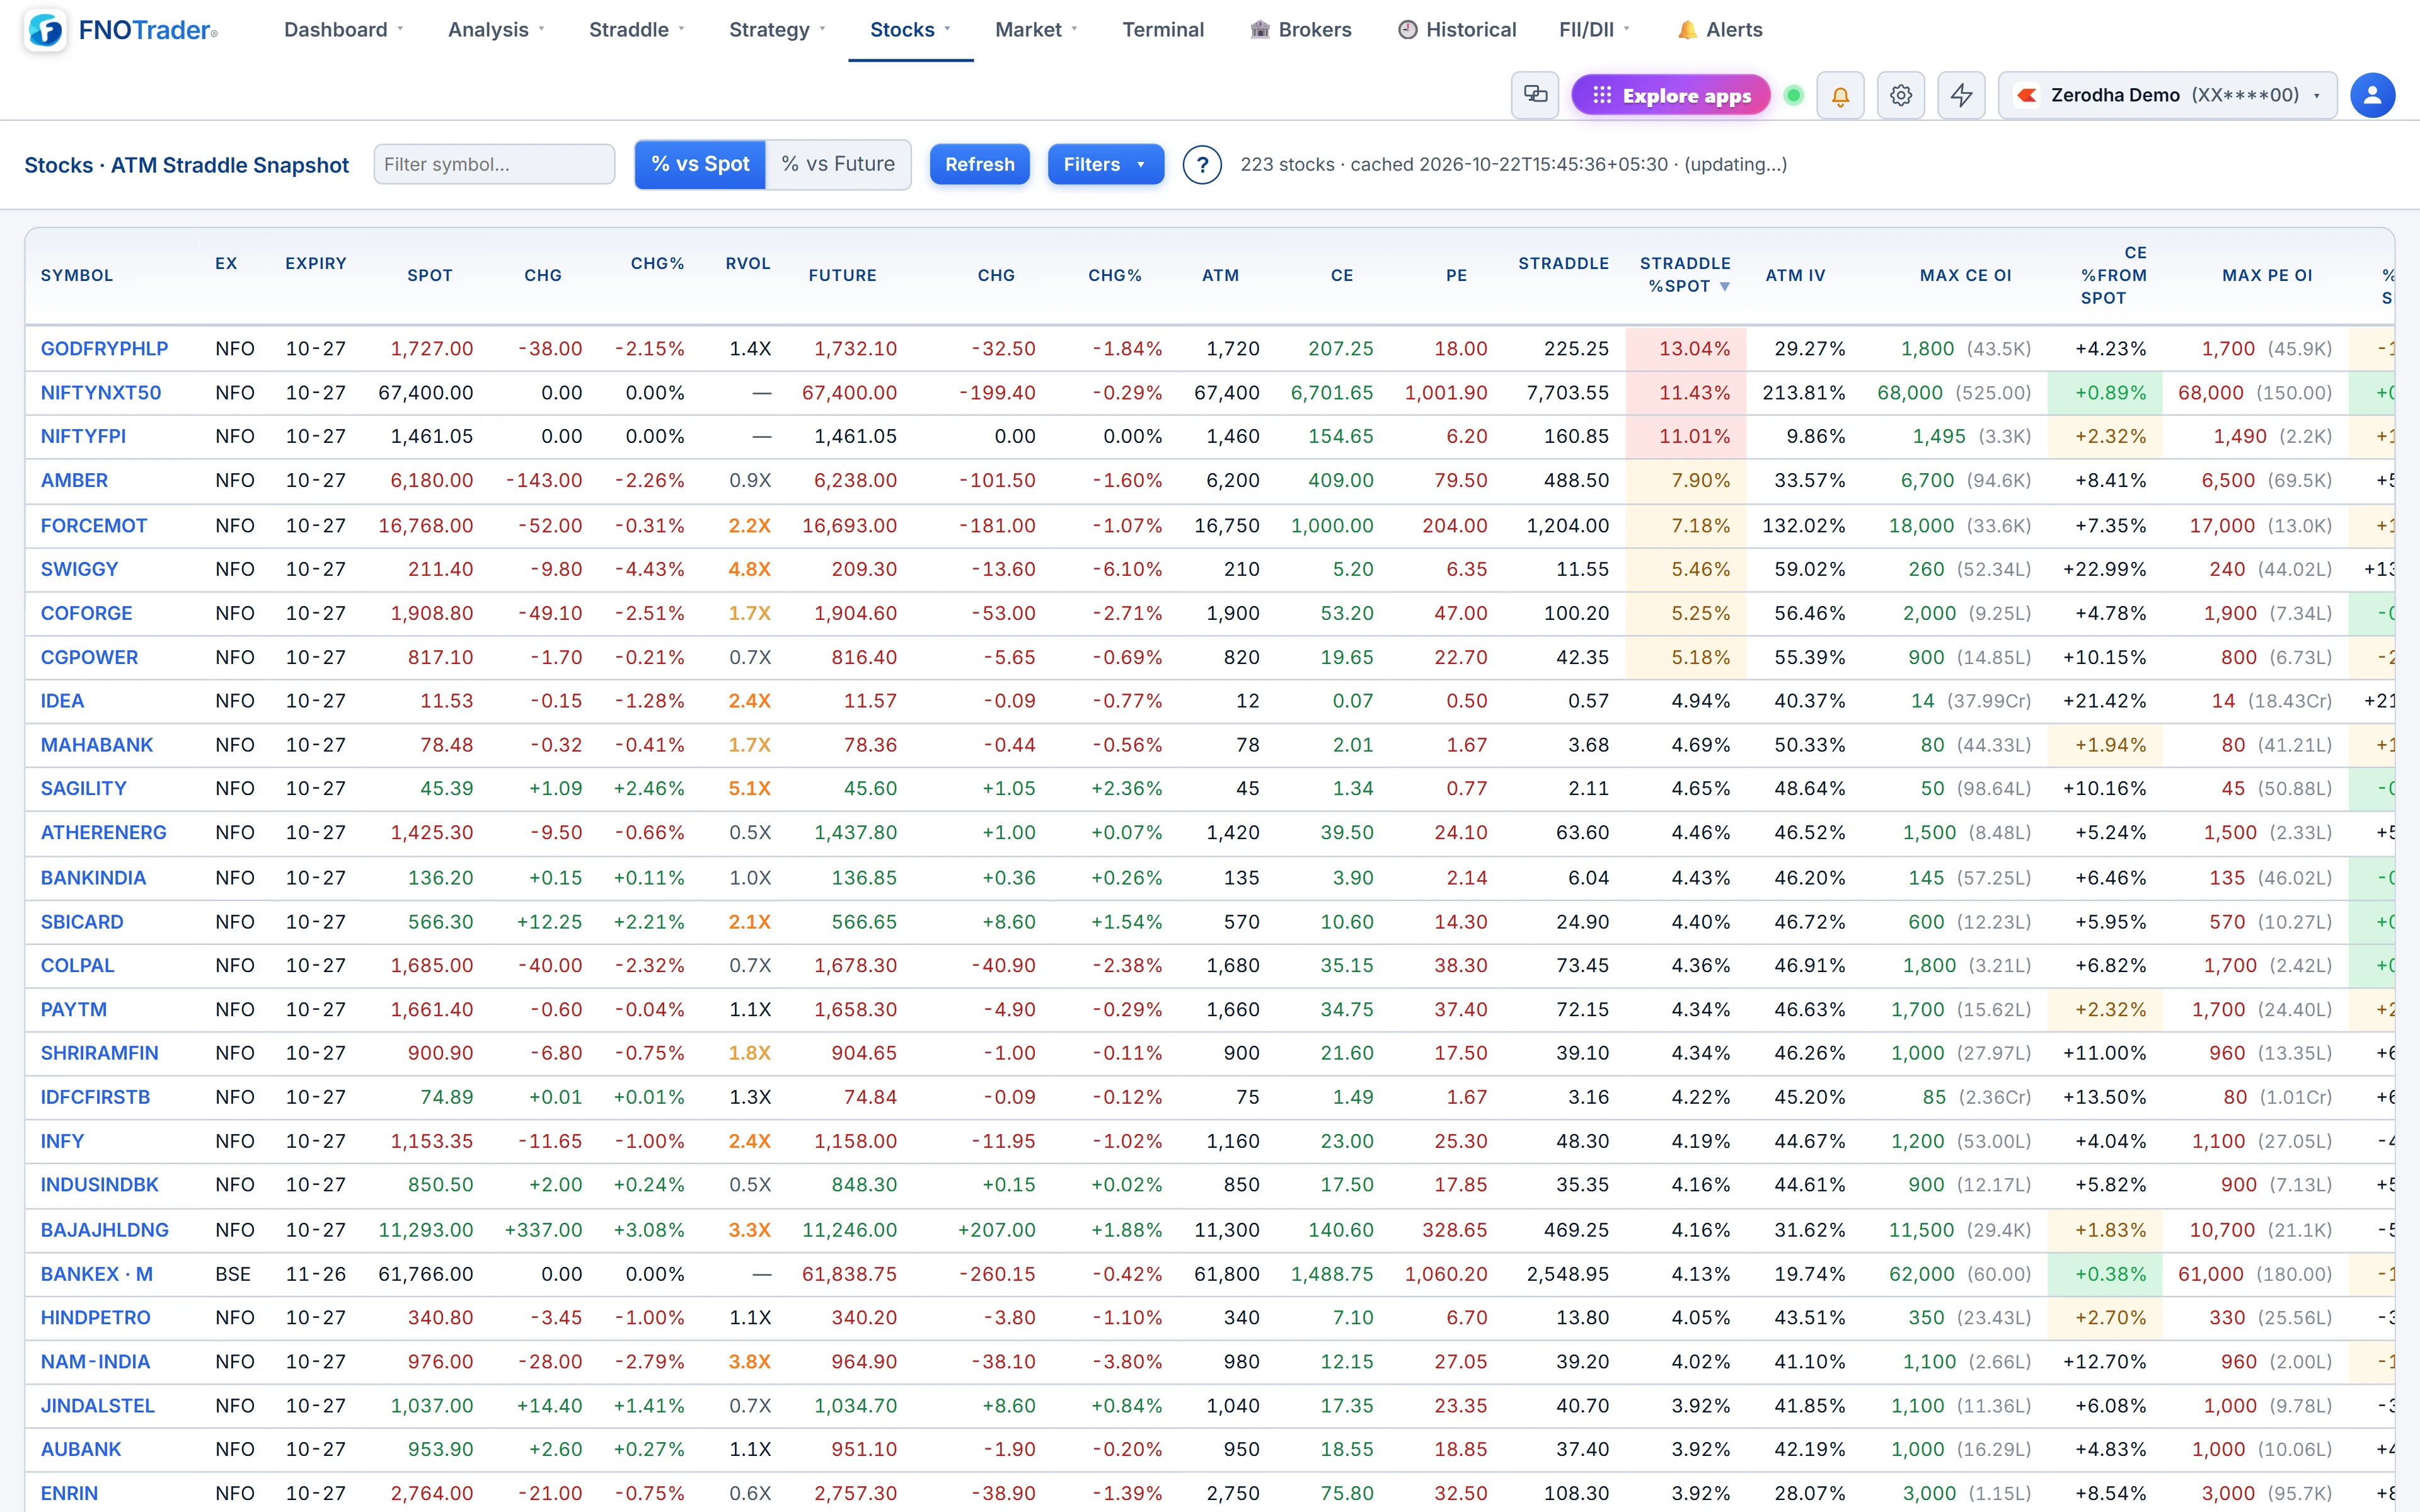
Reading the OI walls
The two OI columns answer a different question: where is open interest concentrated? The strike with the largest call OI is often read as a ceiling the writers are defending, the largest put OI as a floor. The page gives you the distance as a percentage, so "the call wall is 6% above" and "the call wall is 1% above" are easy to tell apart.
Read the two together with the straddle. If the straddle prices a 4% move and the call wall sits 2% away, the option market is pricing a move that would run straight through the most crowded call strike. If both walls sit well outside the straddle's range, writers are positioned for the expected move to hold. Neither is a signal on its own; for the full method see option chain analysis.
Worked example
Hypothetical numbers for one row:
- Spot ₹1,500, ATM strike 1,500, CE ₹32, PE ₹28 → straddle ₹60.
- Straddle %Spot = 60 ÷ 1,500 = 4.0%. Breakevens for a long straddle at expiry: 1,440 and 1,560.
- Lot 500 → one straddle costs 60 × 500 = ₹30,000 to buy, or collects that much to sell, before costs.
- Max CE OI at 1,600 → CE %From = (1,600 − 1,500) ÷ 1,500 = +6.7%. Max PE OI at 1,450 → PE %From = −3.3%.
A second stock showing 2.1% on the same expiry is being priced for roughly half the move. Sorting the column surfaces both ends of that range in one click.
Limits and common mistakes
- Comparing across expiries. A straddle shrinks as expiry approaches. Compare stocks on the same expiry, and expect every number to fall through expiry week.
- Forgetting events. A stock with results before expiry carries a fatter straddle for a reason. Check the events calendar before calling it expensive.
- Ignoring liquidity. A wide-spread ATM option makes the straddle number less reliable. Low RVOL and thin OI are your cue to treat it as indicative.
- Treating the walls as fixed. OI moves through the day; the walls can shift by a strike or two between the open and the close.
Filters and where to find it
The Filters button lets you stack rules on any numeric column — greater than, less than, equal, not equal, or between — for example Straddle % > 5 and RVOL > 1.5. Filters are saved in your browser, and the symbol box narrows the table by name.
- Open Options Analytics → Stocks → Stocks ATM Straddle.
- Choose % vs Spot or % vs Future.
- Click a header to sort, or add filters; press Refresh for a fresh load.
For how much movement the stock has actually been delivering versus what options imply, see Stock Volatility.
Common questions
How do I calculate the expected move from an ATM straddle?
Add the ATM call and put premiums and divide by the underlying price. A ₹60 straddle on a ₹1,500 stock prices roughly a 4% move by expiry.
Should I use spot or futures as the base?
Use the future when the basis is meaningful, because options are priced off the forward. The page has a % vs Spot / % vs Future toggle.
Which expiry does the page use?
The nearest option expiry for each underlying, shown in the Expiry column.
What does CE %From Spot mean?
The distance of the strike with the highest call open interest from the current price, in percent. Positive means the call wall is above price.
More on Options App
More in Options App · App: Options Analytics · Definitions: glossary · All: every article