What GEX measures
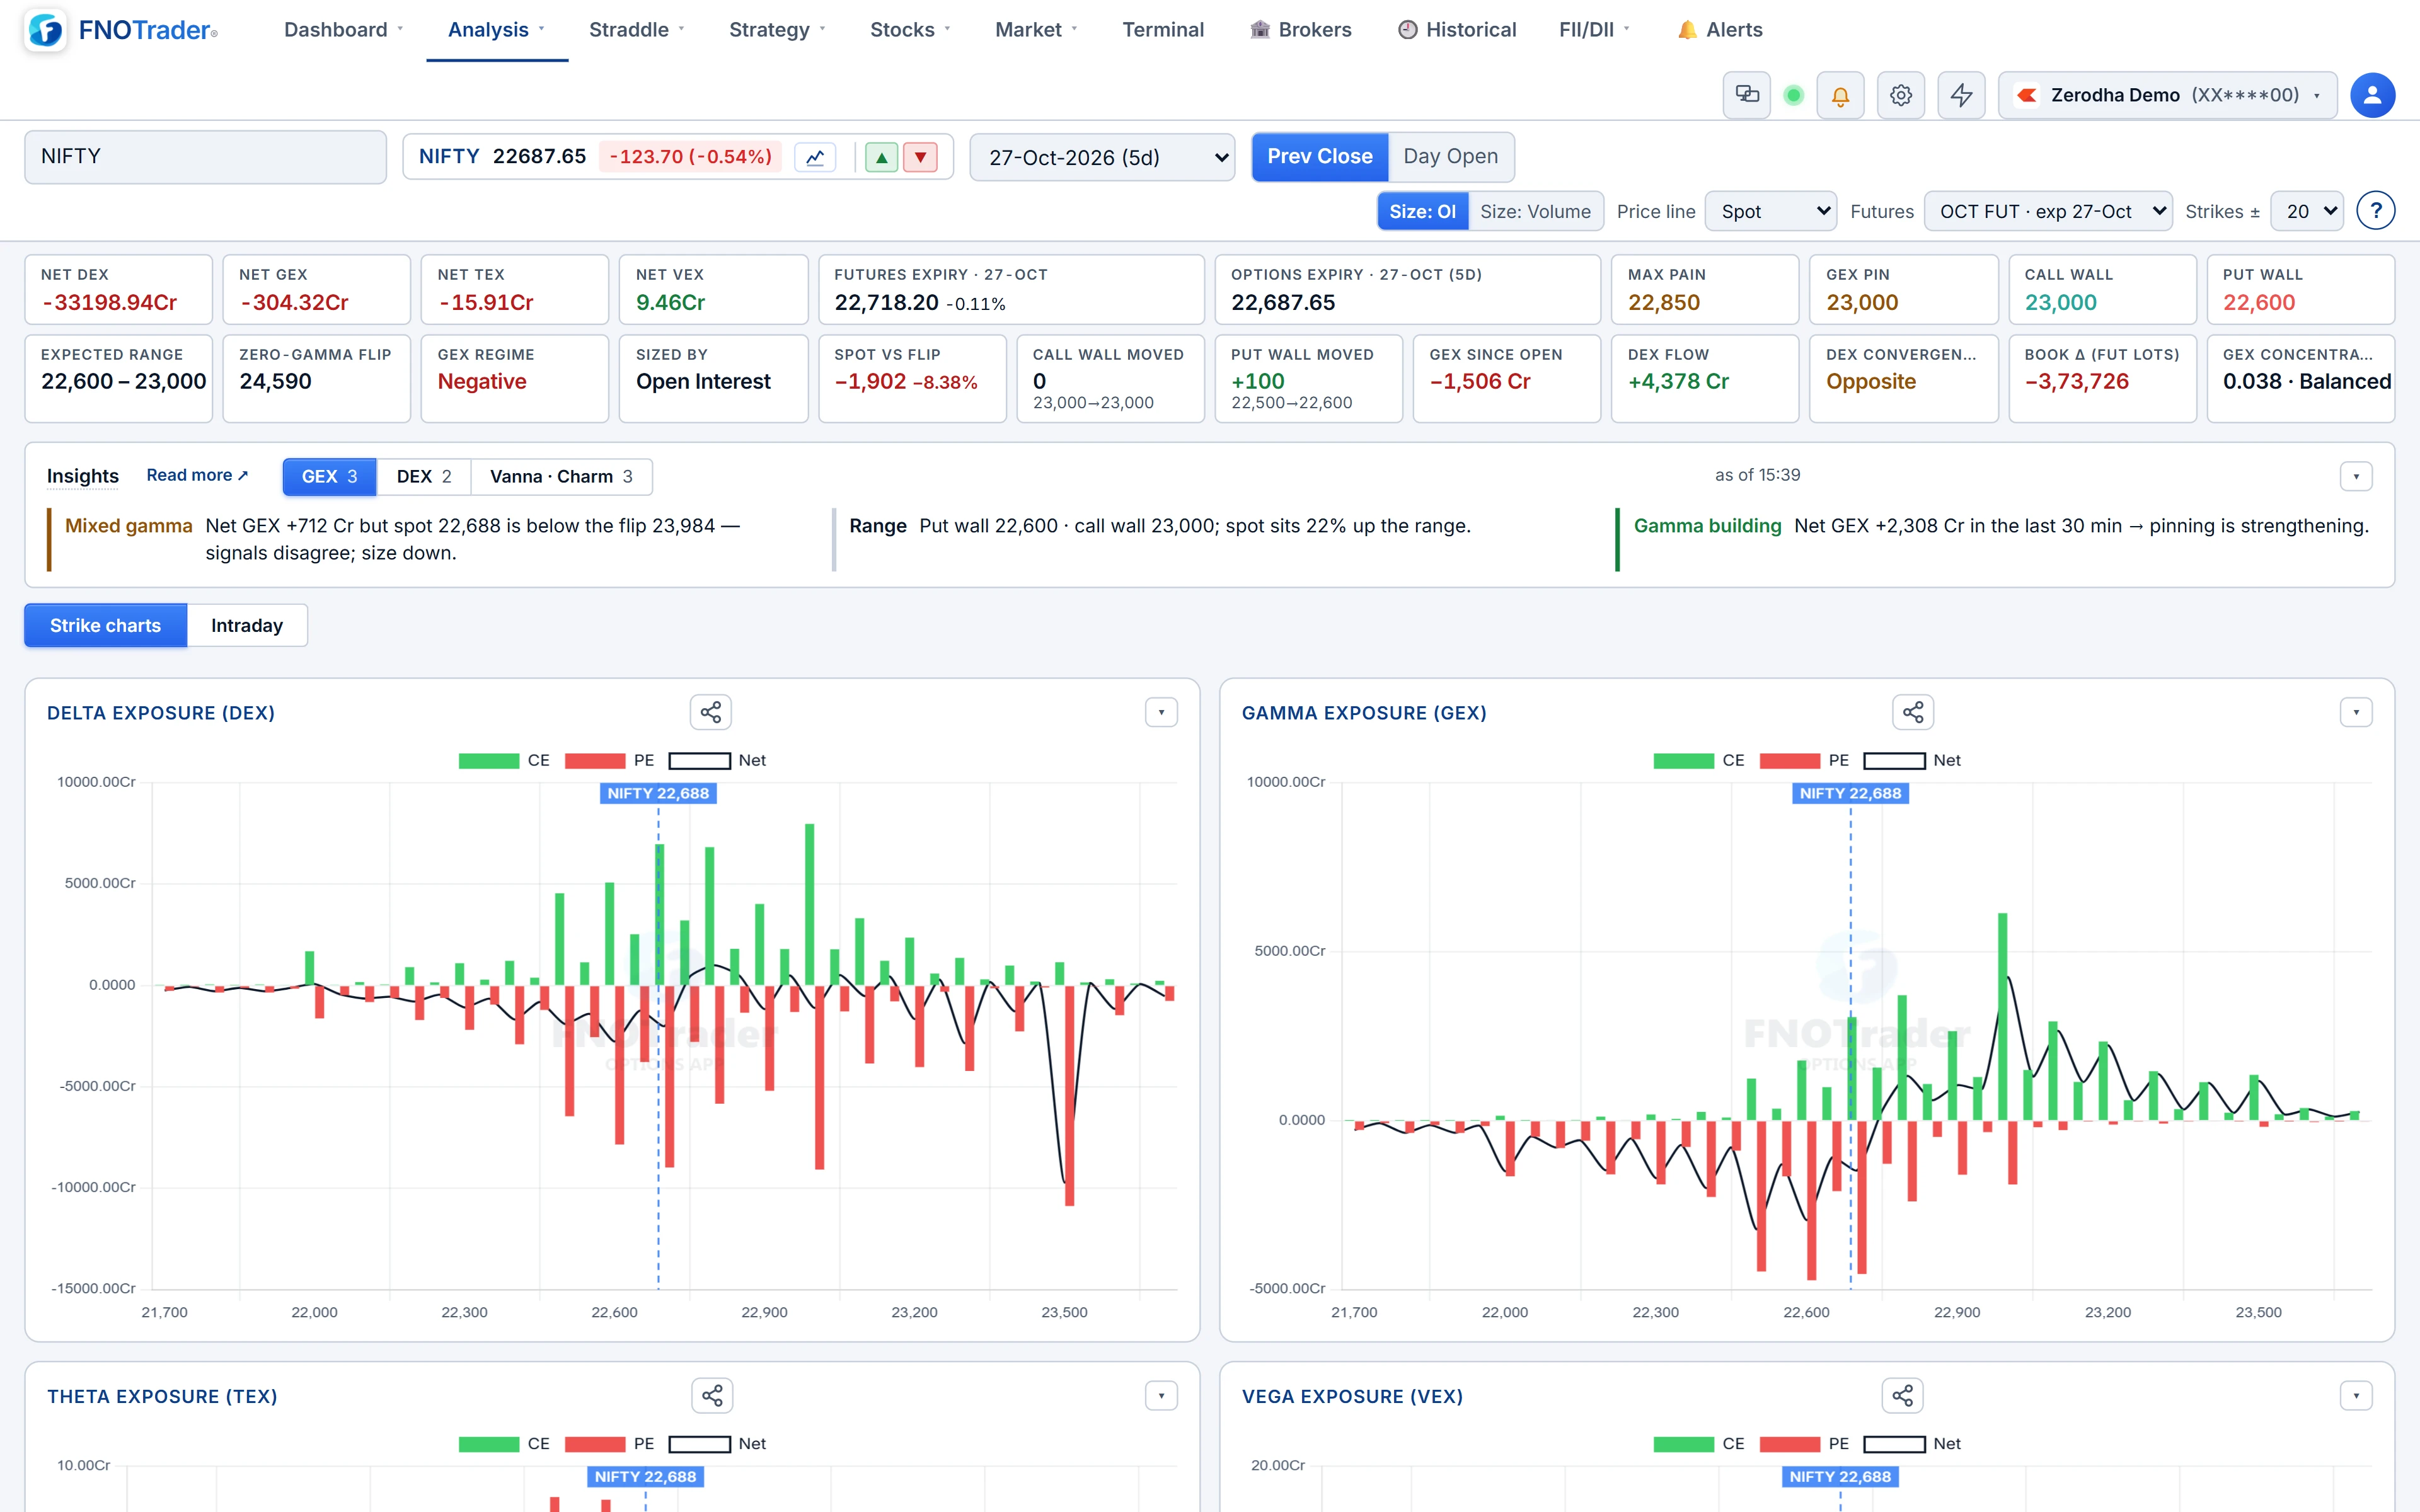
Gamma is how much an option's delta changes when the underlying moves. Gamma exposure scales that by open interest and price, so it reads as rupees of delta that would need re-hedging for a 1% move.
Per strike, the page computes
GEX = (ΓCE × OICE − ΓPE × OIPE) × S² × 0.01
where S is spot and OI is in units. Calls count positive and puts negative. Net GEX is the sum over strikes. Why S² × 0.01: a 1% move is 0.01S, which changes delta by Γ × 0.01S per unit, and that delta is worth S rupees.
The assumption. Open interest does not say who is long and who is short. The sign convention — calls positive, puts negative — describes hedging if option writers hold the other side of the book. That is broadly true for index options and not guaranteed. "Dealer positioning" on this page is that assumption applied, not something observed.
The levels it derives
| Level | How it is found |
|---|---|
| Zero-gamma flip | Add GEX strike by strike from the lowest strike up; the flip is where the running total crosses zero nearest spot, interpolated between strikes. If it never crosses, the regime-side gamma wall is shown and labelled as a wall. |
| Call wall / Put wall | Strike at or above spot with the largest call Γ×OI; strike at or below spot with the largest put Γ×OI. |
| Expected range | Put wall to call wall. |
| GEX pin | The strike with the largest combined call and put Γ×OI. |
| Max pain | The strike at which total intrinsic value paid to option holders is smallest. |
| Concentration | Sum of each strike's squared share of |GEX|: 0 is evenly spread, 1 is one strike. |
Under the assumption above, spot above the flip with positive net GEX is read as hedging that leans against moves; spot below it with negative net GEX as hedging that adds to them.
DEX, vanna and charm
- DEX = Σ Δ × OI × S. Puts carry negative delta, so net DEX is calls plus puts. Session flow applies the same formula to the change in OI since the first point of the day, isolating today's new positions.
- VEX (vanna exposure) = Σ vanna × 0.01 × OI × S: how much book delta shifts for a one-point IV change.
- CEX (charm exposure) = Σ charm × OI × S per calendar day: how much book delta drifts from time passing alone.
Vanna and charm are computed with Black-76. For delta hedging itself, see delta hedging explained.
A worked example
Hypothetical, two strikes only, spot 24,000. S² × 0.01 = 57,60,000.
- 24,100 CE: Γ 0.0010, OI 20,00,000. Γ×OI = 2,000. GEX = 2,000 × 57,60,000 = ₹115.2 crore, positive.
- 23,900 PE: Γ 0.0009, OI 25,00,000. Γ×OI = 2,250. GEX = −₹129.6 crore.
- Net: −₹14.4 crore per 1% move. With strikes ordered low to high the running total goes −129.6, then −14.4; it never crosses zero, so there is no flip in this window and the page would show the wall instead.
The Intraday tab and the Playbook
The Strike charts tab shows positioning now. The Intraday tab recomputes the whole chain every 1 to 15 minutes and plots Net GEX, Net DEX with session flow, and VEX/CEX through the session, with a strike profile and the underlying drawn with the flip and walls as they stood at each point. Pick a recent date to replay a past session.
The Insights card turns the numbers into one-line reads, and a Playbook groups eight named setups — such as a pinned day, a trend day, short covering and expiry-day pinning — each defined by explicit conditions you can inspect. The page also tracks one rule-based paper position per day from its morning regime read; nothing is sent to a broker. These are descriptions of positioning, not trading signals.
Limits
- The whole method depends on the writer-holds-the-other-side assumption.
- Strip values use the Strikes ± window and the Size setting (OI or volume); the Intraday tab uses the whole chain weighted by OI, so the same measure can differ.
- Gamma comes from the feed; deep in-the-money legs without one use a Black-76 delta from price.
Where to find it
- Options Analytics › Analysis › Greeks Exposure.
- Set Size (OI or Volume), Price line (Spot, Future or Synth.Fut) and Strikes ±.
- Switch between Strike charts and Intraday.
For a configurable multi-panel view, see the GEX Dashboard.
Common questions
How is gamma exposure calculated?
Per strike, call gamma × call OI minus put gamma × put OI, multiplied by spot squared × 0.01. The result is rupees of delta hedging per 1% move.
What is the zero-gamma flip?
The price where the running sum of GEX, added from the lowest strike up, crosses zero nearest spot. Above and below it the implied hedging behaviour changes sign.
Is GEX the same as actual dealer positions?
No. OI does not reveal who is long or short. GEX assumes option writers hold the other side of the book, which is broadly true for index options but not guaranteed.
What is the difference between max pain and GEX pin?
Max pain is the strike where option holders collect the least intrinsic value at expiry. GEX pin is the strike with the most combined gamma × OI.
Can I replay GEX for a past day?
Yes. The Intraday tab takes a recent date and rebuilds the session's GEX, DEX, flip and walls.
More on Options App
More in Options App · App: Options Analytics · Definitions: glossary · All: every article