Four pages, one layout
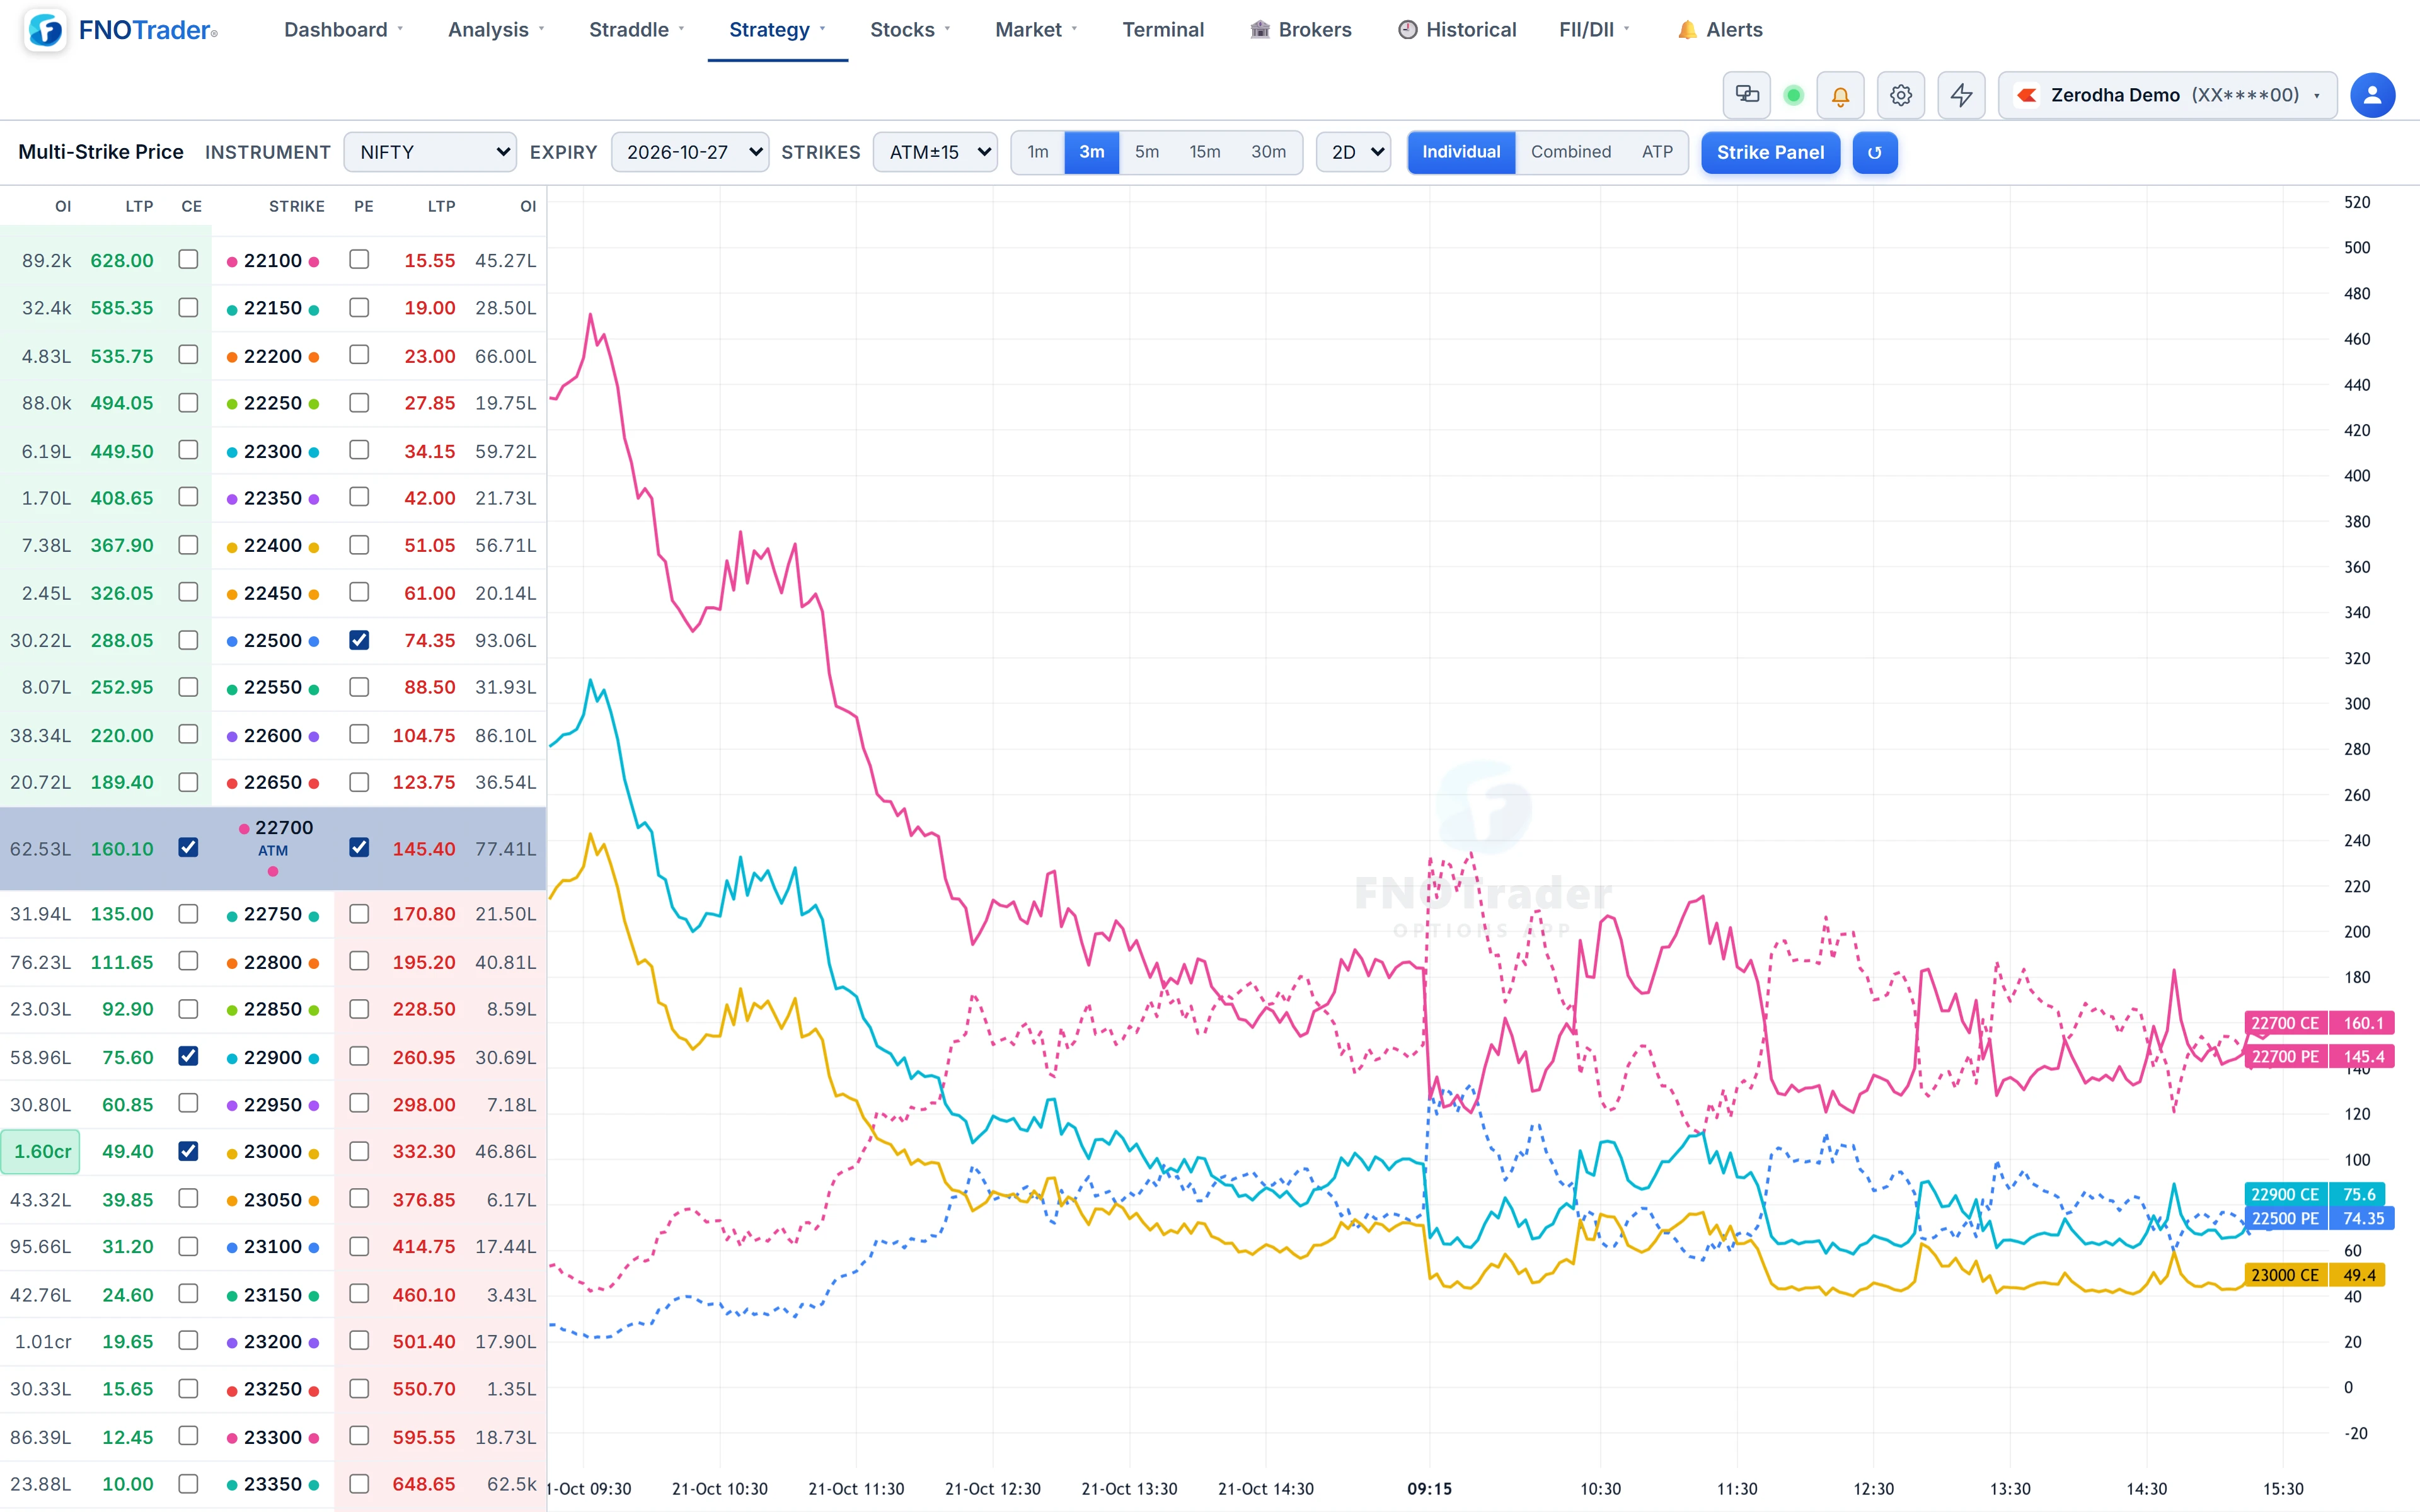
Multi-Strike Price, OI, PCR and IV share the same layout: a strike panel on the left, a chart on the right, one line for each strike you tick.
Instruments are NIFTY, BANKNIFTY, FINNIFTY, MIDCPNIFTY, SENSEX, BANKEX and the MCX contracts crude oil, natural gas, gold and silver, each with its own expiry selector.
The strike panel lists ATM ±5, 10, 15 (default), 20 or 30 strikes, showing OI and LTP per side, tinting ITM strikes and marking the highest-OI strike as the wall. Tick as many strikes as you like. Each keeps its colour on the chart; calls are solid lines and puts dashed.
What each page plots
| Page | One line per selected leg showing |
|---|---|
| Price | The premium. Toggles add Combined (the sum of all selected legs) and ATP, the volume-weighted average price of the combined premium. |
| OI | Open interest in lakhs, or OI change since the first bar on screen. |
| PCR | For each selected strike, put OI ÷ call OI; with more than one strike, a thick grey line for the combined PCR. |
| IV | Implied volatility of the call at each selected strike. |
Interval is 1, 3 (default), 5, 15 or 30 minutes; period is 1, 2 (default) or 5 trading days. Live ticks update the last bar.
What each one is good for
Price with Combined is a quick way to watch a custom structure — two strikes of a strangle, or a spread's legs — and ATP shows whether the combined premium is above or below its average traded value for the period, a common reference for sellers.
OI answers where new positions are going. When the wall migrates, you see one strike's line rise as its neighbour's falls.
PCR per strike shows where put writing dominates at a specific level, which a whole-chain PCR averages away.
IV across strikes shows whether a move in volatility is broad or concentrated. If one OTM strike's IV jumps while the rest are flat, that is demand for that specific strike.
A practical routine is to start on the OI page with the ATM strike and the two highest-OI strikes on each side, then switch to Price with the same strikes ticked. The strike whose OI line moves first is usually the one whose premium is worth watching.
A worked example on the PCR page
Hypothetical: three strikes ticked. 24,000 has PE OI 42 lakh and CE OI 18 lakh: PCR 2.33. 24,100 has 30 and 28: PCR 1.07. 24,200 has 12 and 45: PCR 0.27.
Combined: puts 42 + 30 + 12 = 84 lakh, calls 18 + 28 + 45 = 91 lakh, PCR 84 ÷ 91 = 0.92. The grey line says "roughly balanced"; the individual lines say heavy put writing at 24,000 and heavy call writing at 24,200 — a range, not balance. That is the gap this page exists to show.
Common mistakes
- OI change baseline. On the default 2-day period, OI change is measured from the first bar of the previous session, not today's open. Switch to 1 day for today's change only.
- Colours on the PCR page follow the order you selected strikes, not the panel dots; use the line labels on the price axis.
- Lines are not normalised. A ₹300 ITM premium and a ₹20 OTM premium on one axis make the cheap one look flat. Compare strikes of similar price, or use the OI and IV pages.
Where to find them
- In Options Analytics, open Strategy → Multi-Strike Price (or OI, PCR, IV).
- Choose the instrument and expiry, then tick strikes in the panel.
- Set interval and period. For totals across a strike range instead, use the Composite chart.
Common questions
Can I plot several option strikes on one chart?
Yes. Each multi-strike page draws one line per strike you tick, with calls solid and puts dashed.
What is ATP on the multi-strike price chart?
The volume-weighted average price of the combined premium of the selected legs over the period, useful as a reference for a multi-leg position.
How is PCR per strike calculated?
Put open interest divided by call open interest at that strike, for every bar. The grey line combines all selected strikes.
Which instruments are supported?
NIFTY, BANKNIFTY, FINNIFTY, MIDCPNIFTY, SENSEX, BANKEX, and MCX crude oil, natural gas, gold and silver.
Is there a limit on how many strikes I can compare?
No fixed limit. In practice four to six lines is the most a chart stays readable; tick the ATM strike, the wall strikes and the one you are trading.
More on Options App
More in Options App · App: Options Analytics · Definitions: glossary · All: every article