What the chart is
Four panes, one shared time axis, all built from the strikes around ATM.
It is a context page. It does not find a trade; it tells you whether the options market's positioning agrees with what price is doing right now, which is often the difference between a move that extends and one that fades.
The four panes
| Pane | What is plotted |
|---|---|
| Cumulative premium | Two lines: the sum of call prices (CE Σ) and the sum of put prices (PE Σ) across the selected strikes. |
| Cumulative OI | Total call OI against total put OI across the same strikes. |
| PCR | Put OI ÷ call OI for each bar. |
| Volume delta | A running total of buyer-classified minus seller-classified volume, for calls and for puts. |
The volume pane classes each trade as a buy or sell by comparing it with the previous print, the same method explained in options flow. It is volume, not delta-weighted, and it accumulates from the first bar on screen.
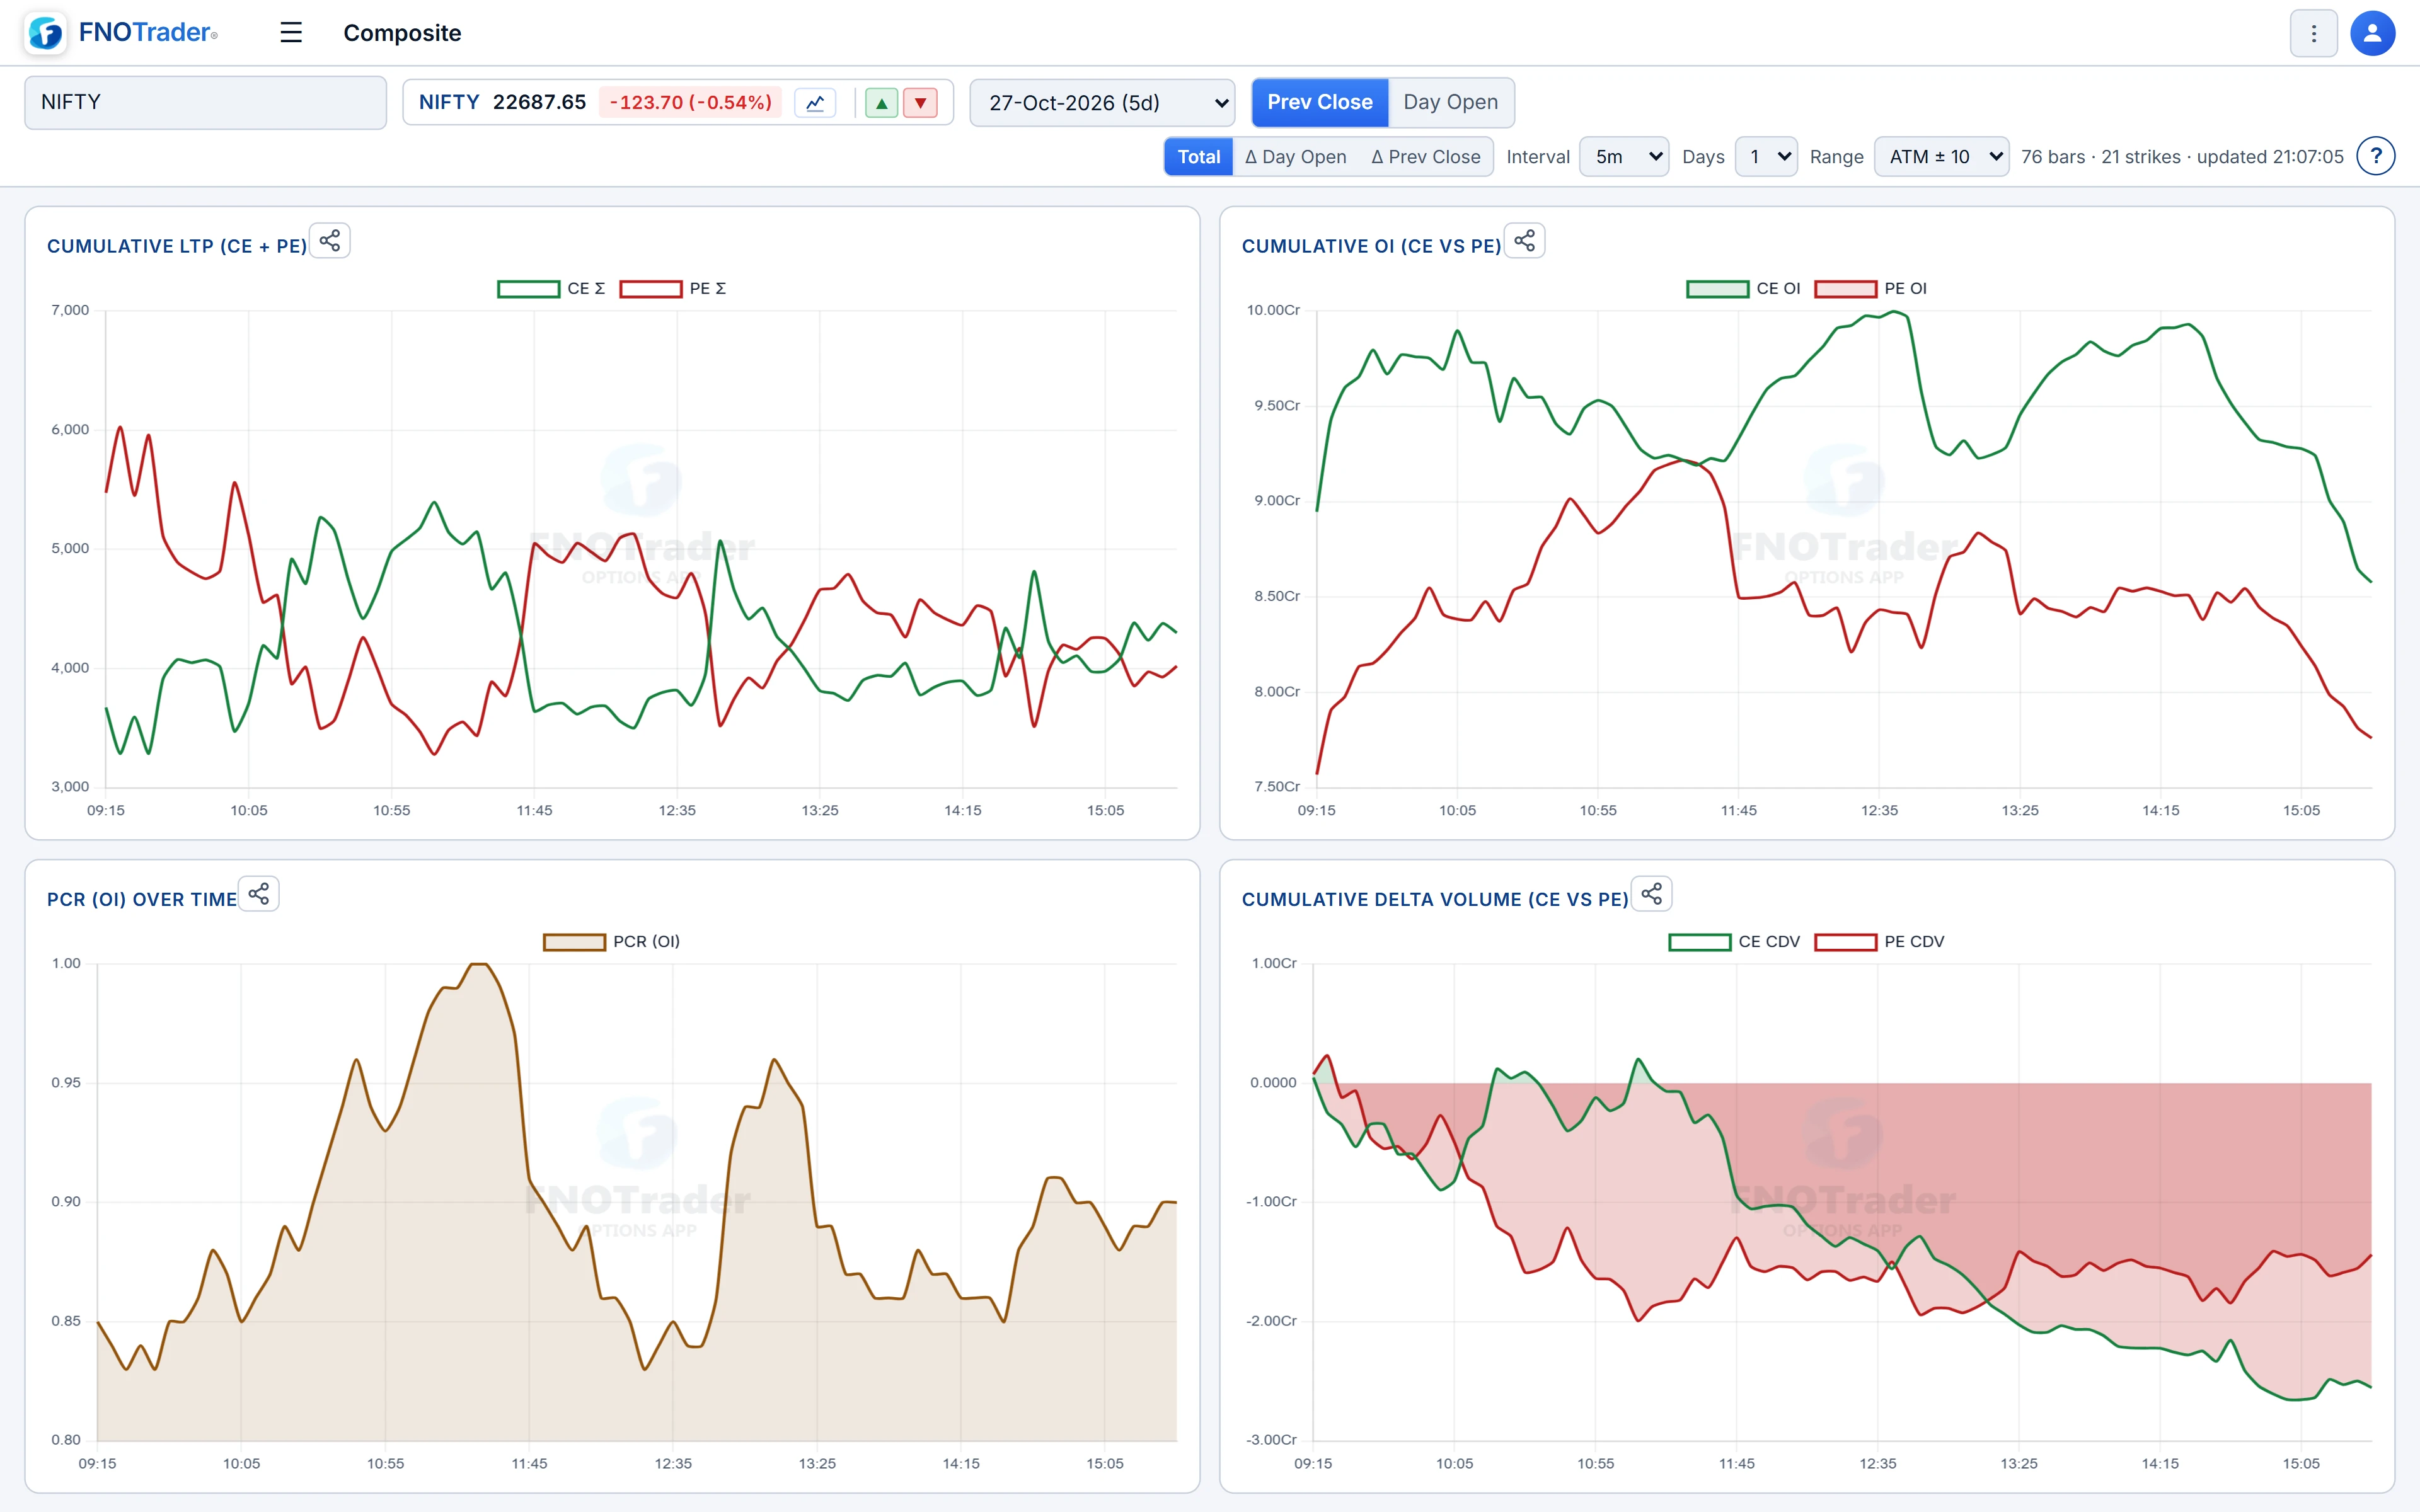
The settings and what each changes
| Setting | Options |
|---|---|
| Mode | Total (raw values), Δ Day Open (each value minus today's first bar), Δ Prev Close (minus the previous session's last bar). |
| Interval | 1, 2, 3, 5 (default), 10, 15, 20 or 30 minutes. |
| Days | 1 or 2. |
| Range | ATM ±10 or ±20 strikes. |
The Δ modes are usually the more readable ones. Raw summed premium mostly reflects how many strikes you included; the change since the open shows which side has gained value today.
The chart is built when you open the page or change a setting, rather than ticking live.
Agreement and divergence
A move the options market agrees with tends to look like this: on an up-move, CE Σ rises and PE Σ falls, put OI builds faster than call OI (PCR rising), and the call volume-delta line climbs. Every pane says the same thing.
Divergence is the warning. Price making a new high while PCR falls and call OI builds says writers are selling into the rally; a call volume-delta line rolling over while price still rises says buyers have stopped lifting offers. Neither is a reversal signal by itself, but each is a reason not to assume the move continues.
Read the panes in order of how hard they are to fake. Premium can jump on a handful of orders; open interest changes only when positions are actually opened or closed; and the volume-delta line shows which side was paying up to get filled. When OI and volume delta disagree with premium, give more weight to the first two.
A worked example in Δ Day Open mode
Hypothetical, ±10 strikes. At the first bar, total CE OI is 3.0 crore and PE OI 2.7 crore: PCR 0.90. By 12:00, CE OI 3.2 crore, PE OI 3.4 crore: PCR 1.06.
Δ Day Open for OI: calls +0.2 crore, puts +0.7 crore. Puts were added three and a half times as fast as calls. If price rose over the same period and CE Σ is up while PE Σ is down, every pane agrees. If instead CE Σ has gone flat for the last hour, the premium side is no longer confirming the OI side — look at the strikes driving it.
Limits
Summing across ten or twenty strikes smooths over what happens at any one of them. A sharp event at a single strike can be invisible here; use multi-strike charts to see which strike breaks from the pack. ATM is taken from spot (from the front-month future on MCX) when the chart is built, so a big intraday move shifts which strikes would be "around ATM" if you rebuilt it later.
Where to find it
- In Options Analytics, open Analysis → Composite.
- Choose the mode, interval, days and range.
- Change any setting to rebuild the chart with the latest bars.
Common questions
What is cumulative premium on the composite chart?
The sum of call prices and, separately, the sum of put prices across the selected strikes around ATM, per bar.
Is the volume delta pane weighted by option delta?
No. It is a running total of buyer-classified minus seller-classified volume, classified by comparing each print with the previous one.
Which mode should I use?
Delta Day Open is usually the clearest for intraday reading, because it shows what changed today rather than levels that depend on how many strikes are included.
Does the composite chart update live?
It is built when you open the page or change a setting. Change a setting or reload to bring it up to date.
How is PCR calculated on the composite chart?
For each bar, total put open interest divided by total call open interest across the strikes in the chosen range around ATM, not the whole chain. It can therefore differ from the chain's full-chain PCR.
More on Options App
More in Options App · App: Options Analytics · Definitions: glossary · All: every article