What it scans
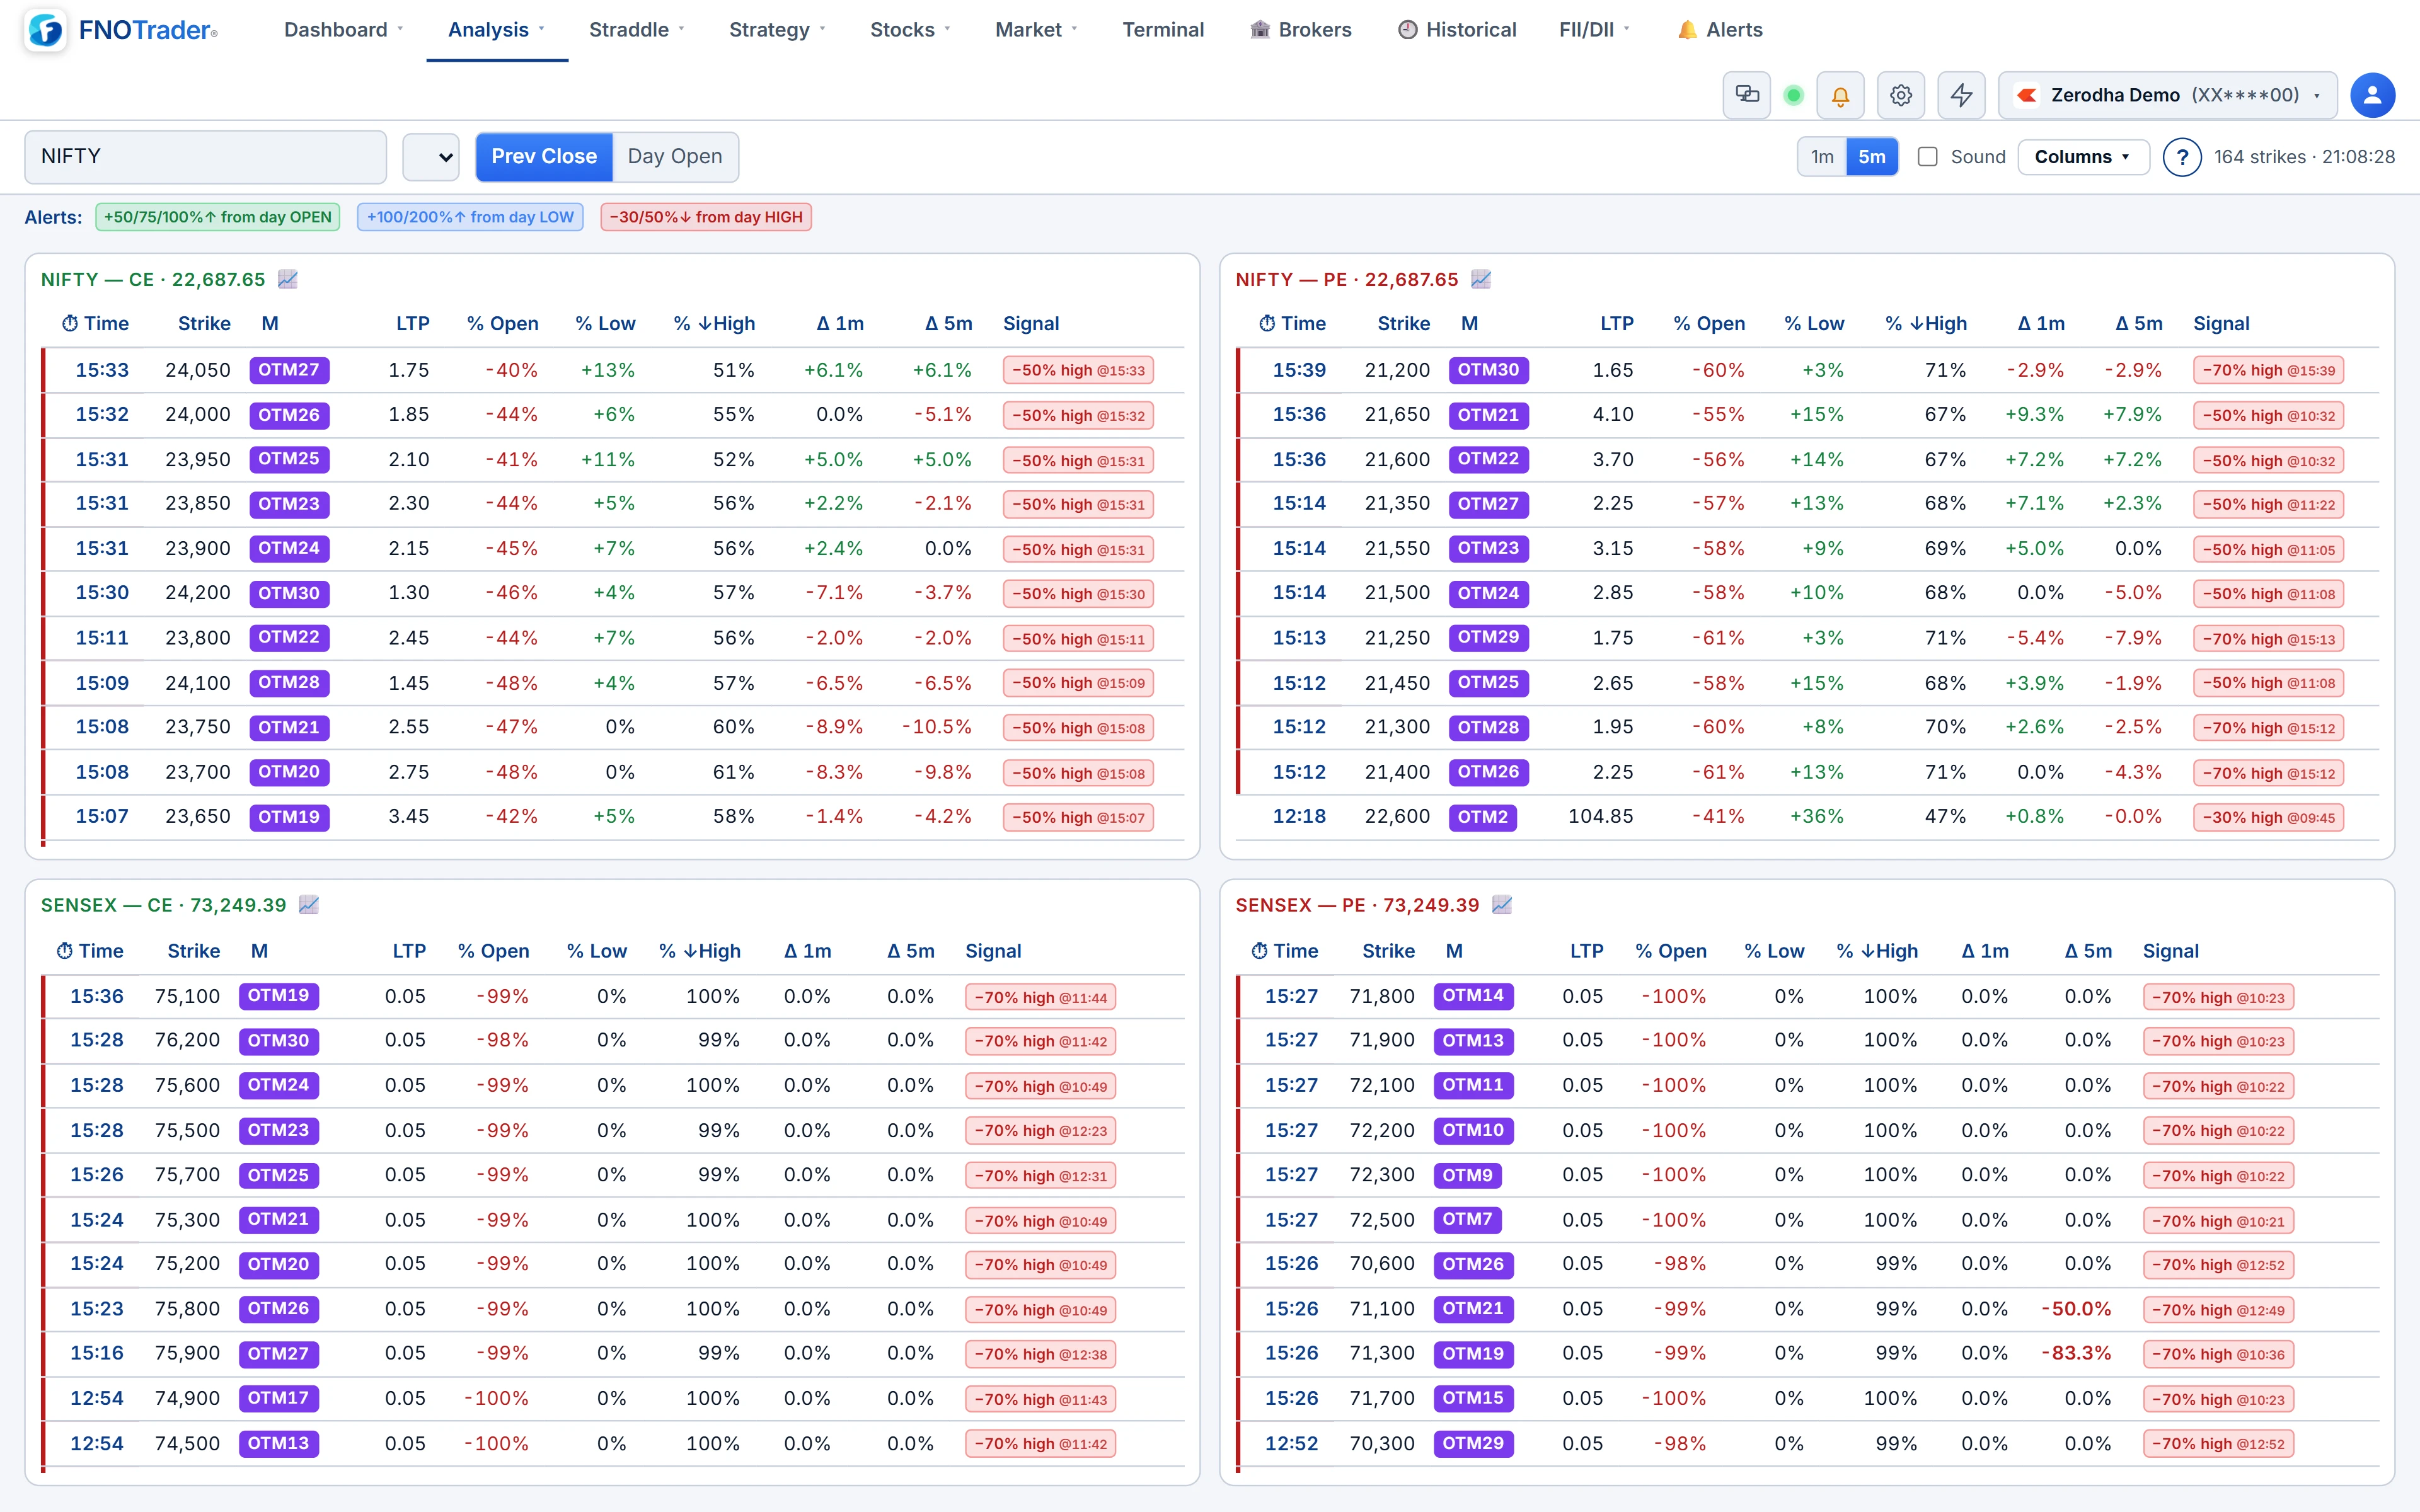
NIFTY and SENSEX, nearest weekly expiry, every strike from 10 in the money to 30 out of the money on each side, in four tables: NIFTY-CE, NIFTY-PE, SENSEX-CE and SENSEX-PE.
It rescans every 30 seconds and updates prices with each tick. A strike only appears once it has crossed at least one alert tier and has actually traded through a range during the day; strikes that have not moved at all are filtered out.
How the move is measured
- % Open — change from the close of the first one-minute bar of the day.
- % Low — how far the price is above the day's low.
- % ↓High — how far it has fallen from the day's high.
- Δ 1m / Δ 5m — change over the last one and five one-minute bars; a move of 15% or more either way is shown in bold.
Each tier records the minute it was first crossed, read off one-minute bars without looking ahead. The Time column shows the latest tier crossed, and rows sort with the freshest at the top.
Read % Open and % Low together. A strike up 300% from its low but only 40% from the open fell hard first and is recovering; one up 200% from both has gone one way all day. Those are different situations, and the tables show both numbers side by side for that reason.
The alert tiers
| Measure | Tiers |
|---|---|
| Up from open | +50%, +75%, +100%, +150%, +200% |
| Up from low | +100%, +200%, +300% |
| Down from high | −30%, −50%, −70% |
A green left edge marks a row up 100% or more from the open, or 200% or more from the low. A red edge marks one that has given back 50% or more from its high. The ATM row has an amber edge. Turn on Sound for a short beep on each new tier crossing, and rest the cursor on a row for about two seconds to see its candle chart with VWAP, volume and OI.
A worked example, and the arithmetic that matters
Hypothetical 24,600 CE: first one-minute close ₹4.20, day low ₹3.10, now ₹12.60.
% Open = (12.60 − 4.20) ÷ 4.20 = 200%. % Low = (12.60 − 3.10) ÷ 3.10 = 306%. It has crossed +200% from open and +300% from low, and the time stamps tell you when each happened.
Now the part people skip. With a NIFTY lot of 75 (check the current lot size), one lot at ₹12.60 costs 12.60 × 75 = ₹945. A 200% move on a cheap option is a lot of percentage and very few rupees; and the same option can lose 70% from its high in minutes. Size by the premium you are willing to lose, never by the percentage on the screen.
What this page is not
It is a record of what already moved, not a forecast of what will. A strike at +150% has, by definition, already made most of a move that may not continue; the down-from-high tiers exist because many of them reverse. Expiry-day OTM options are especially prone to sharp moves both ways, which expiry-day options explains.
For the same idea across every index, stock and MCX contract, with liquidity gates, use the Options Screener's momentum and gamma-burst scans.
Before 09:15 IST on a trading day, the tables wait for the session rather than show yesterday's moves.
Where to find it
- In Options Analytics, open Analysis → Option Multibaggers.
- Read the Time and Signal columns first: they tell you when, not just how much.
- Hover a row for its chart; turn on Sound if you want an audible cue.
Common questions
Which options does the multibagger scanner cover?
NIFTY and SENSEX on the nearest weekly expiry, from 10 strikes in the money to 30 out of the money on each side.
How is % Open calculated?
From the close of the day's first one-minute bar to the current price.
What are the alert tiers?
Up 50, 75, 100, 150 and 200% from the open; up 100, 200 and 300% from the low; and down 30, 50 and 70% from the high.
Is a 200% move in an option a good trade?
The page is education only. A large percentage on a cheap option is a small rupee amount, and these options can reverse just as fast. Size by premium at risk.
Why does a strike appear and then turn red?
Red marks a strike that has fallen 50% or more from its day high. Many fast movers retrace, and the down-from-high tiers exist to make that visible.
More on Options App
More in Options App · App: Options Analytics · Definitions: glossary · All: every article