What the ETF page is for
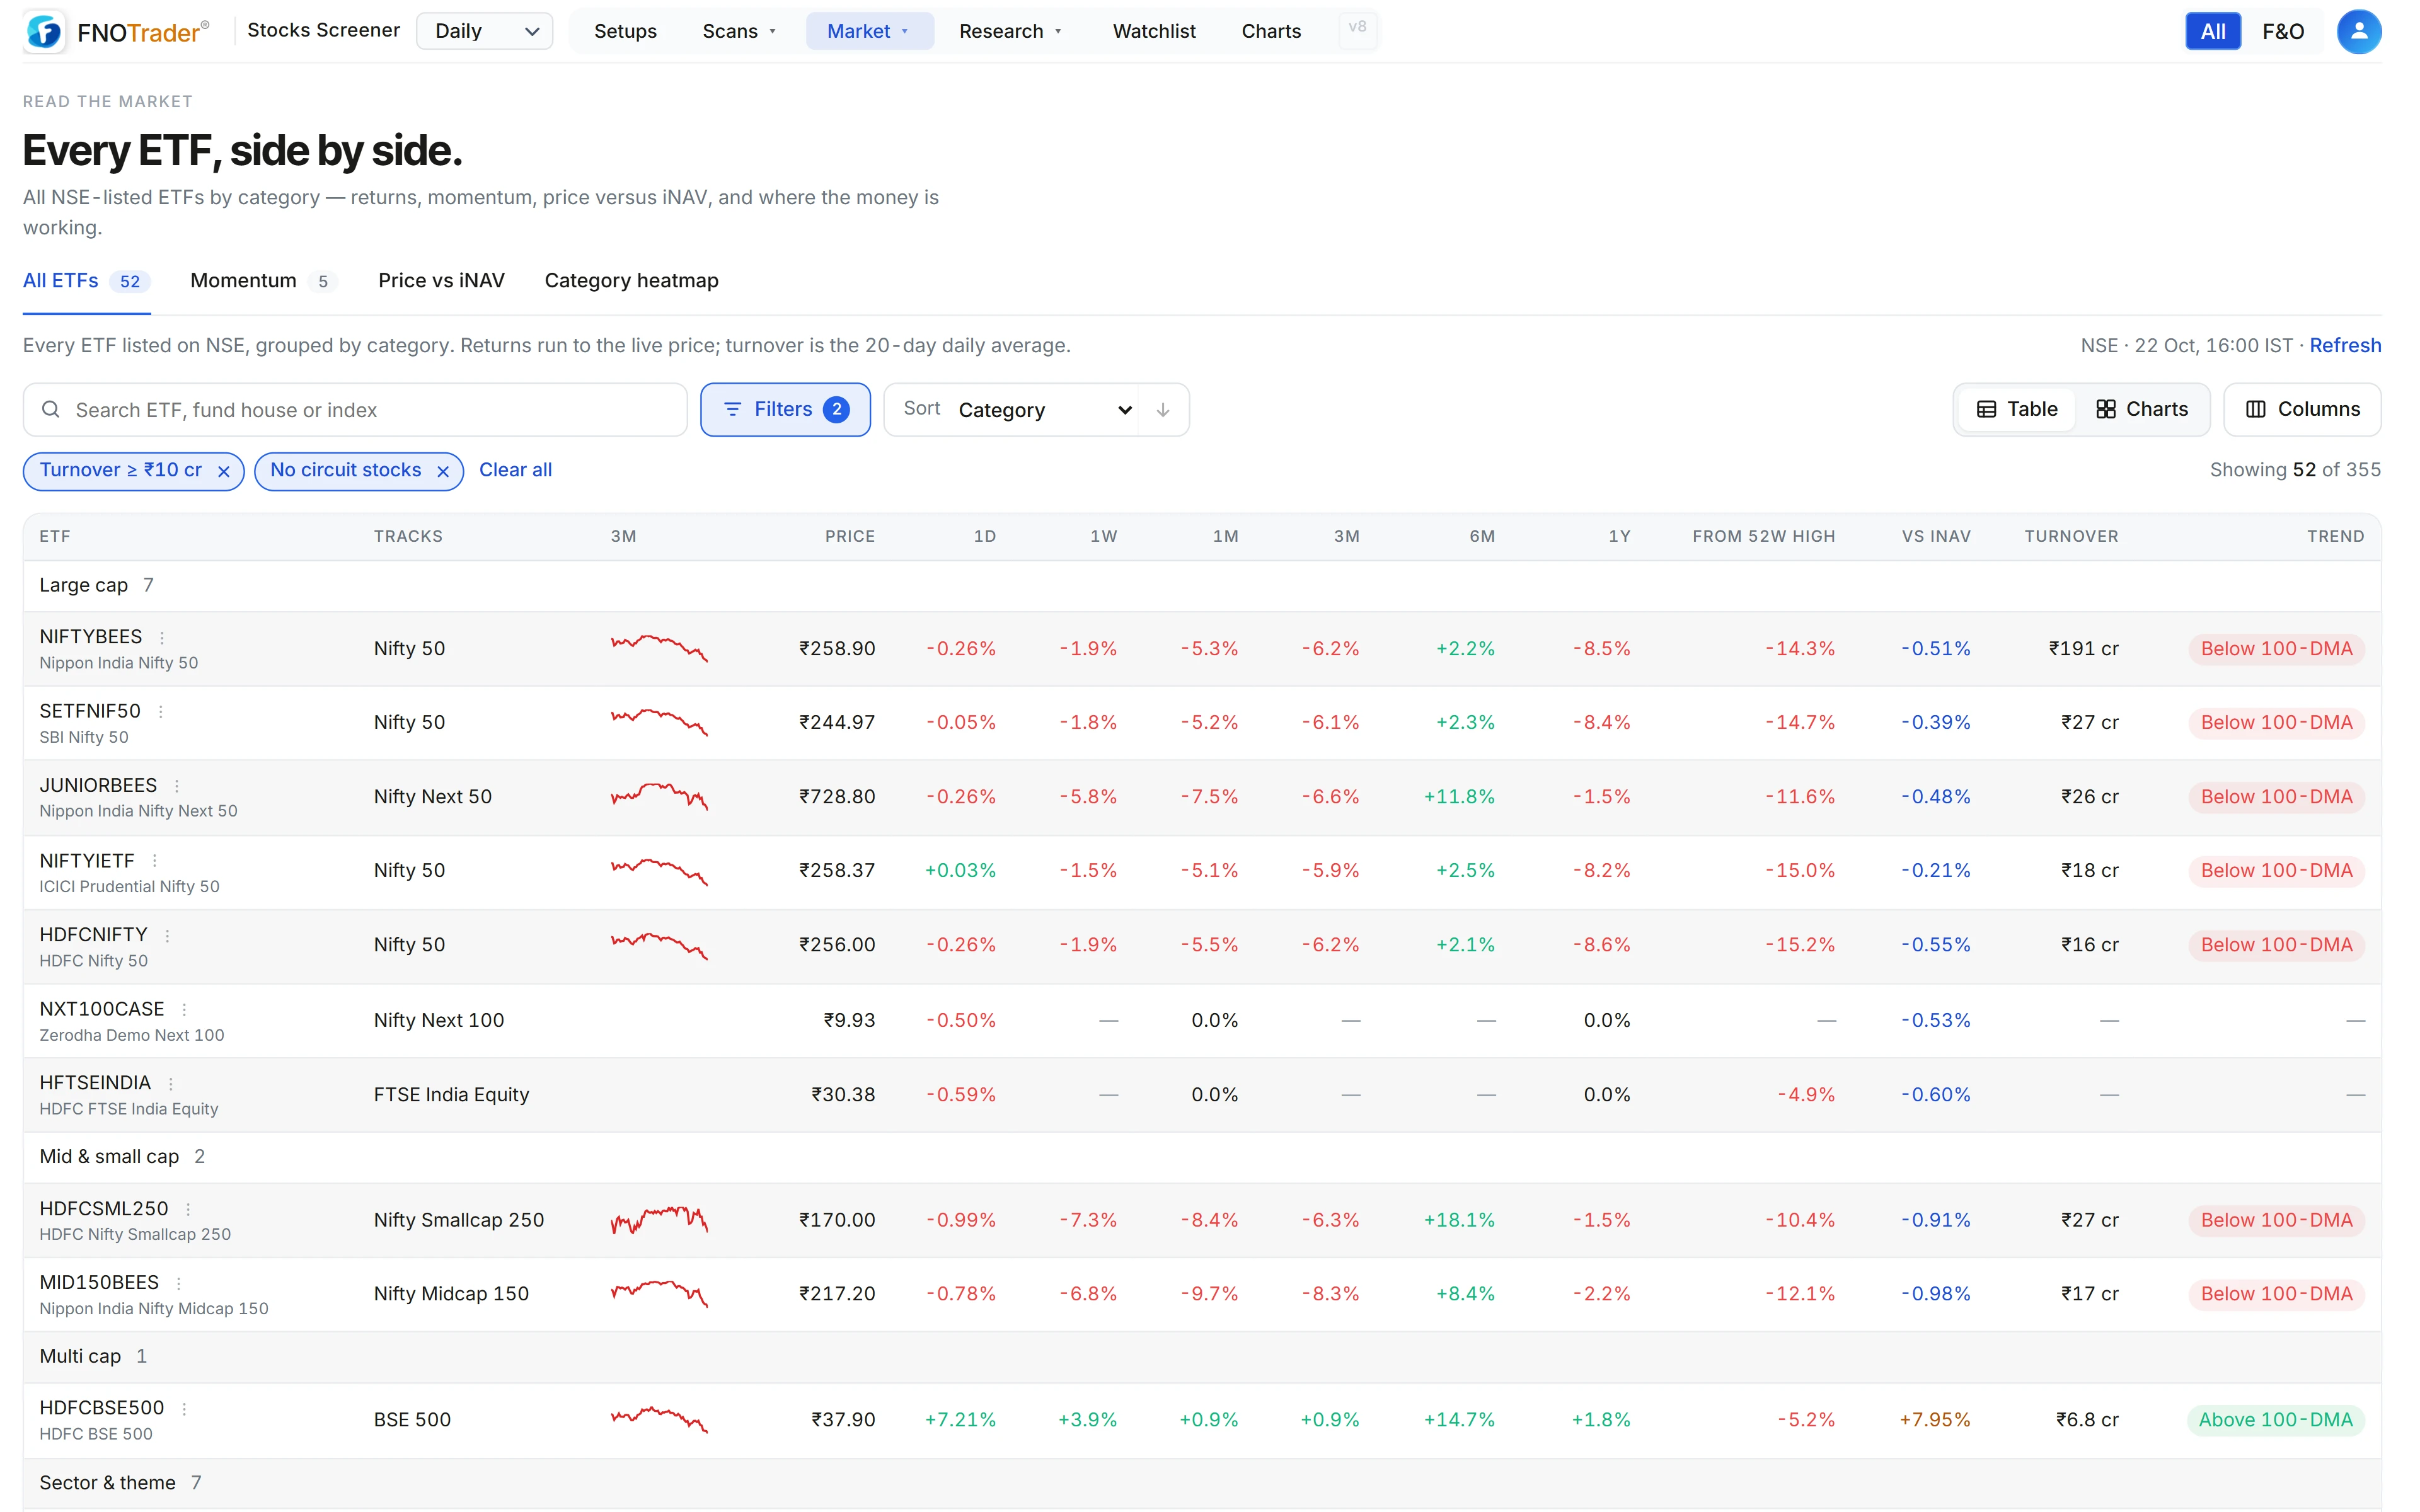
The ETF page is a screener for every exchange-traded fund listed on NSE, grouped into categories: Large cap, Mid & small cap, Multi cap, Factor, Sector & theme, International, Gold, Silver, Gilt & bond, Liquid & overnight, and Hybrid.
It answers three practical questions: which ETFs have been moving, which ones are liquid enough to matter, and whether the market price is close to the value of the holdings. ETFs are kept on this page, charts and watchlists, and out of the stock scans.
The four tabs
| Tab | What it shows |
|---|---|
| All ETFs | Every ETF with price, day change, returns over 1W, 1M, 3M, 6M and 1Y, distance from the 52-week high, 20-day average turnover and price vs iNAV. Table or chart view. |
| Momentum | ETFs ranked by momentum, with their eligibility shown. |
| Price vs iNAV | Every ETF sorted by the size of its premium or discount. |
| Category heatmap | The median return of each category over six timeframes. |
Returns run to the live price; turnover is the 20-day daily average. In market hours the snapshot refreshes about every minute.
How the momentum ranking works
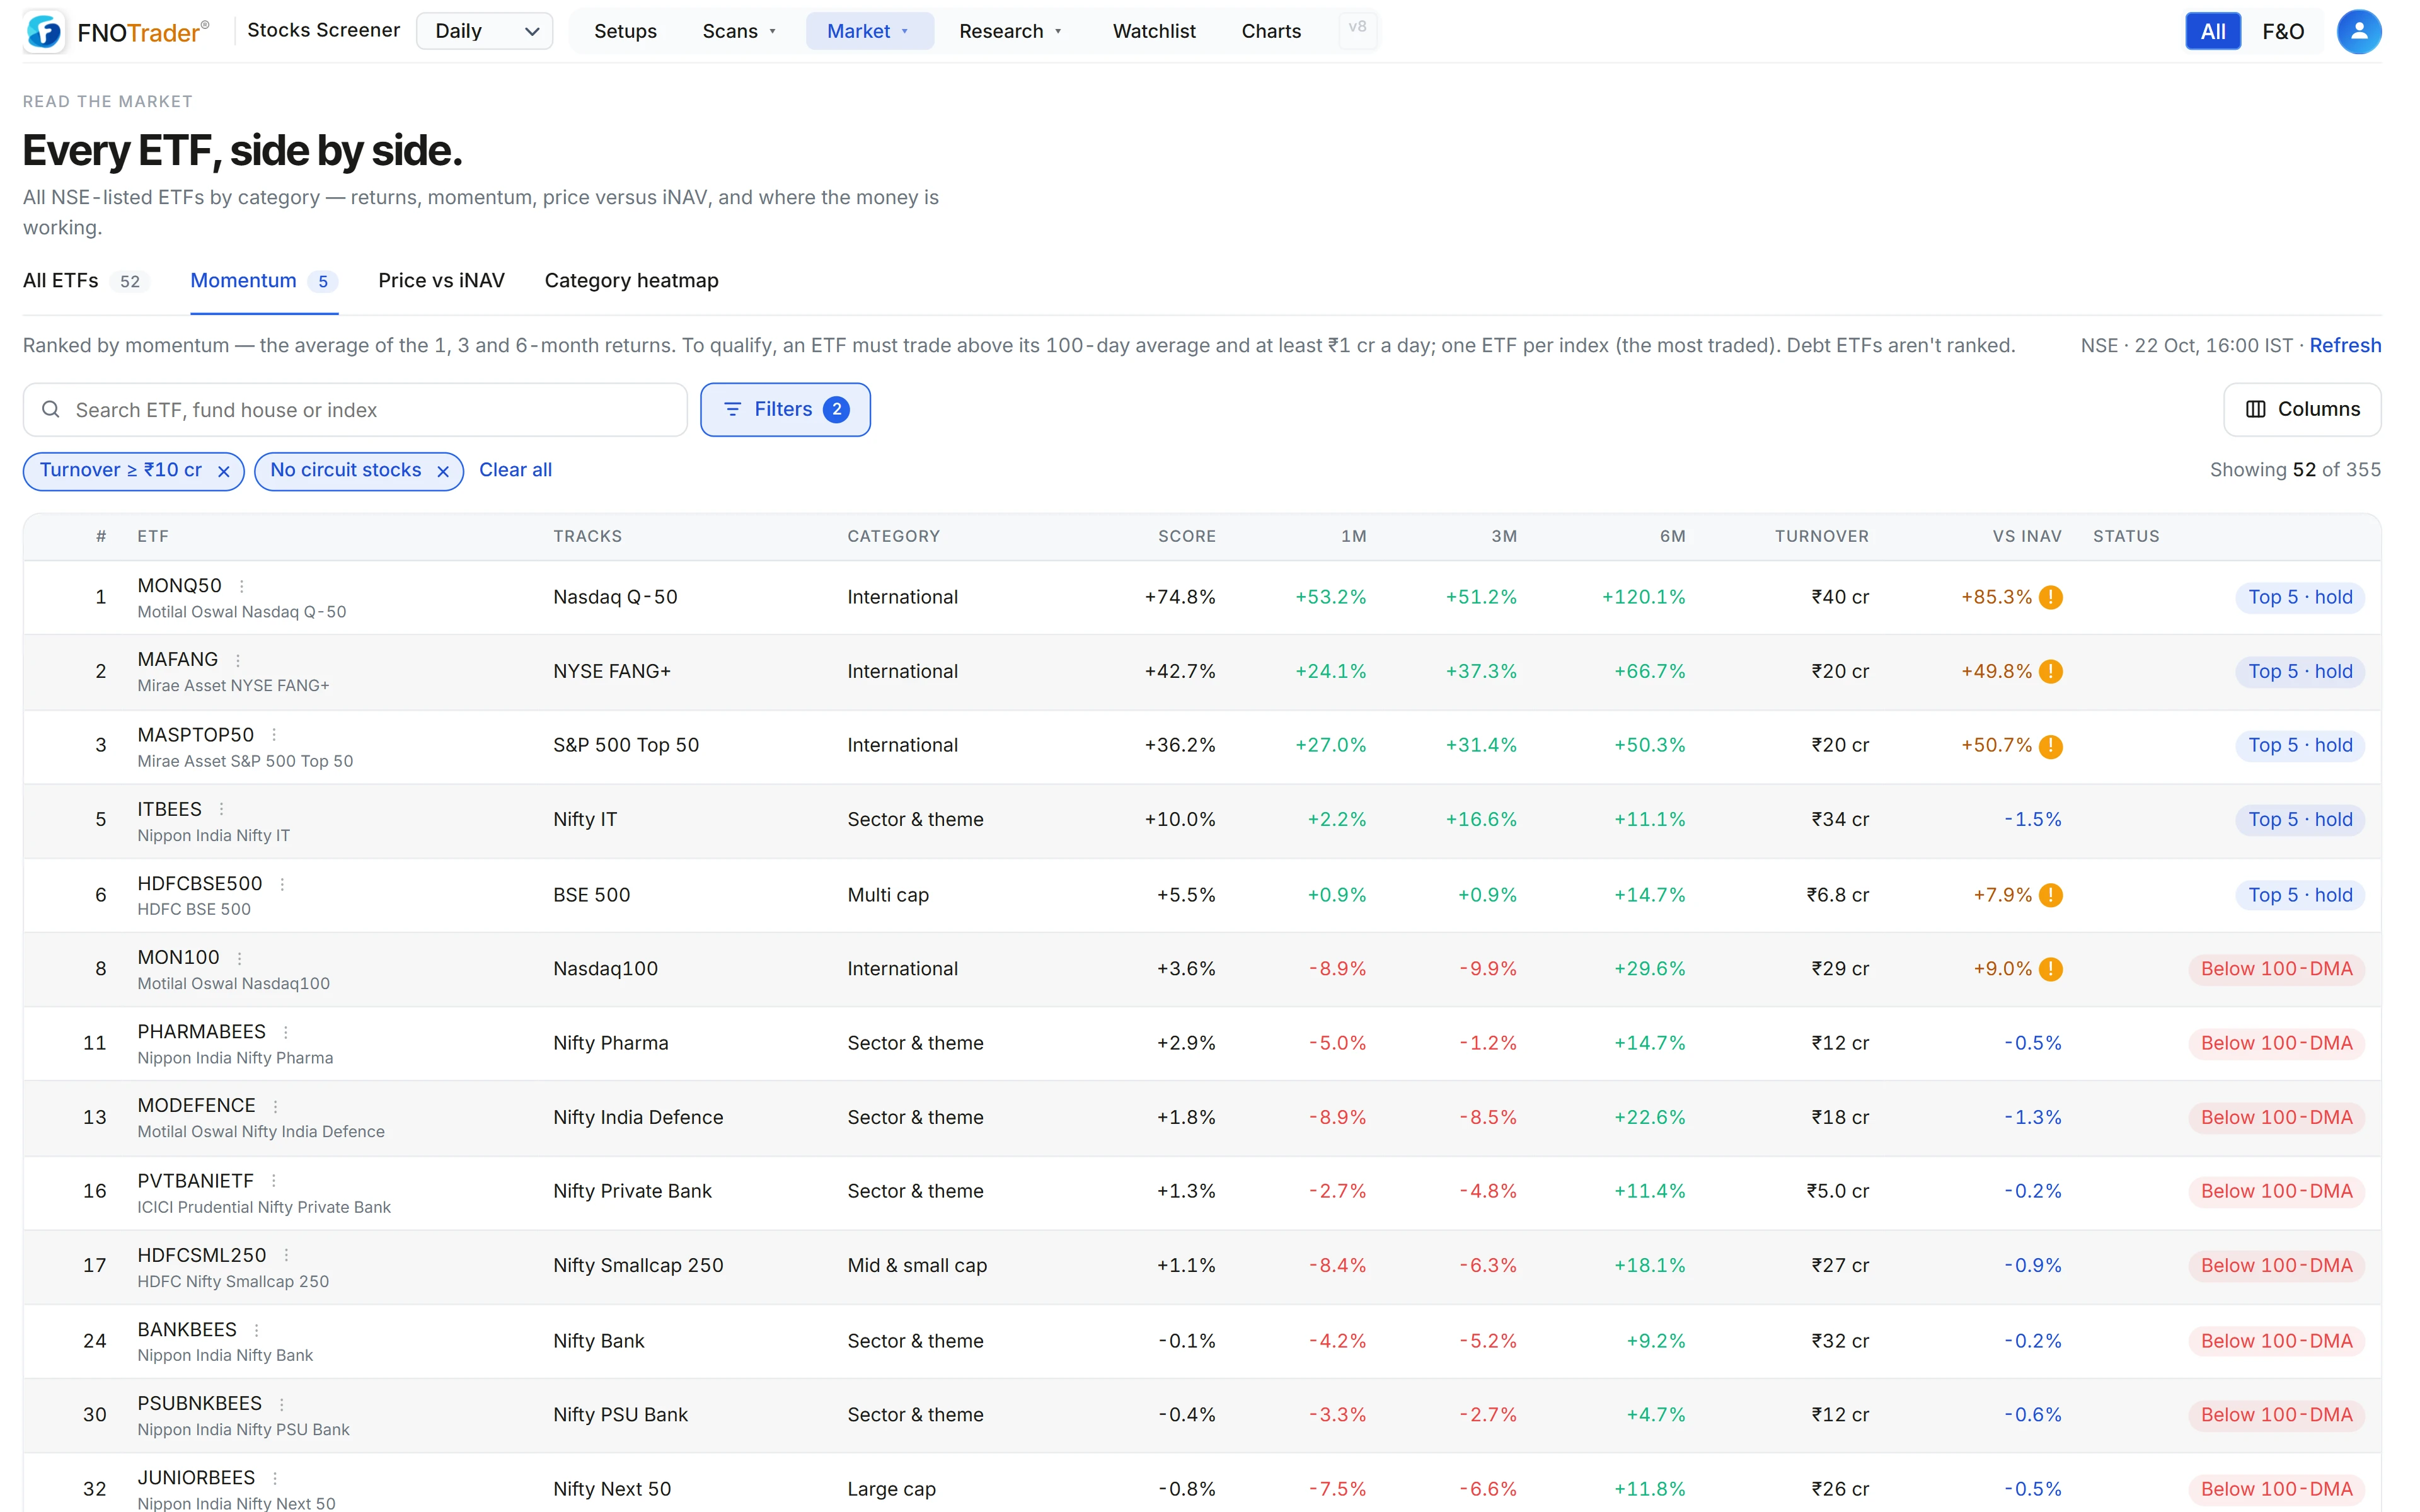
Momentum score = the average of the 1-month, 3-month and 6-month returns. To qualify an ETF must:
- trade above its 100-day moving average;
- trade at least ₹1 crore a day on a 20-day average;
- be the most traded ETF on its underlying index — only one copy of each index is ranked, so twenty Nifty 50 ETFs do not crowd the list;
- not be a debt ETF — gilt, bond, liquid and overnight funds are not ranked, because their returns are not momentum in any useful sense.
ETFs that qualify rank first; others on the list show why they missed (below the 100-day average, or under the turnover floor).
A worked example
Made-up numbers. An ETF returned +3% over 1 month, +6% over 3 months and +12% over 6 months. Score = (3 + 6 + 12) ÷ 3 = 7.0%.
Three ETFs track the same index with 20-day turnover of ₹40 crore, ₹5 crore and ₹0.6 crore. Only the ₹40 crore one is ranked.
Now the price. It last traded at ₹102.40 and its iNAV is ₹100.00. Premium = (102.40 ÷ 100.00 − 1) × 100 = +2.4%. Buying here pays 2.4% more than the holdings are worth, and if that premium closes, the return you see on the underlying is not the return you get.
Reading premium and discount
iNAV is the indicative net asset value the fund house publishes through the day. Above it is a premium, below it a discount. The page colours premiums amber and discounts blue rather than green and red, because a premium is not a gain — it is a cost.
Small gaps are normal. Large, persistent premiums usually mean the fund could not create new units — common for international ETFs when overseas investment limits are reached. On the Momentum tab an ETF trading 3% or more away from iNAV is flagged, since part of its return may be premium rather than the underlying.
Limits and common mistakes
- Momentum is backward-looking. The ranking shows what has been strong; it does not say an ETF will stay strong.
- Category medians use liquid ETFs where there are enough of them, so a thinly traded outlier does not set the colour.
- iNAV can lag for international and commodity ETFs whose underlying markets are shut during Indian hours.
- Turnover is not the same as tight spreads. Check the order book of a small ETF before placing an order.
For the same 1/3/6-month momentum idea applied to sectors, see sector rotation in the app.
Where to find it
- Open the Stocks Scanner and choose Market → ETFs.
- Pick a tab; use Filters for a category or “Liquid only” (₹1 crore a day or more).
- Search by ETF name, fund house or the index it tracks.
- Click a row for its chart and details.
Common questions
What is iNAV in an ETF?
The indicative net asset value — an intraday estimate of what the ETF's holdings are worth per unit. Comparing the market price with it shows whether you are paying a premium or getting a discount.
Why do some ETFs trade at a big premium to iNAV?
Usually because new units cannot be created fast enough, which is common for international ETFs when overseas investment limits are reached. The premium can shrink suddenly, which hurts buyers who paid it.
How is ETF momentum calculated on FNOTrader?
As the average of the 1, 3 and 6-month returns. Only ETFs above their 100-day average with at least ₹1 crore of daily turnover qualify, one per underlying index, and debt ETFs are excluded.
Which Nifty 50 ETF is shown in the momentum list?
Only the most traded ETF on each index is ranked, based on 20-day average turnover, so the list shows one Nifty 50 ETF rather than every copy.
Are liquid and gilt ETFs included?
They are listed on the All ETFs tab and in the category heatmap, but they are not ranked on momentum.
More on Stocks App
More in Stocks App · App: Stocks Scanner · Definitions: glossary · All: every article