Two pages, one job
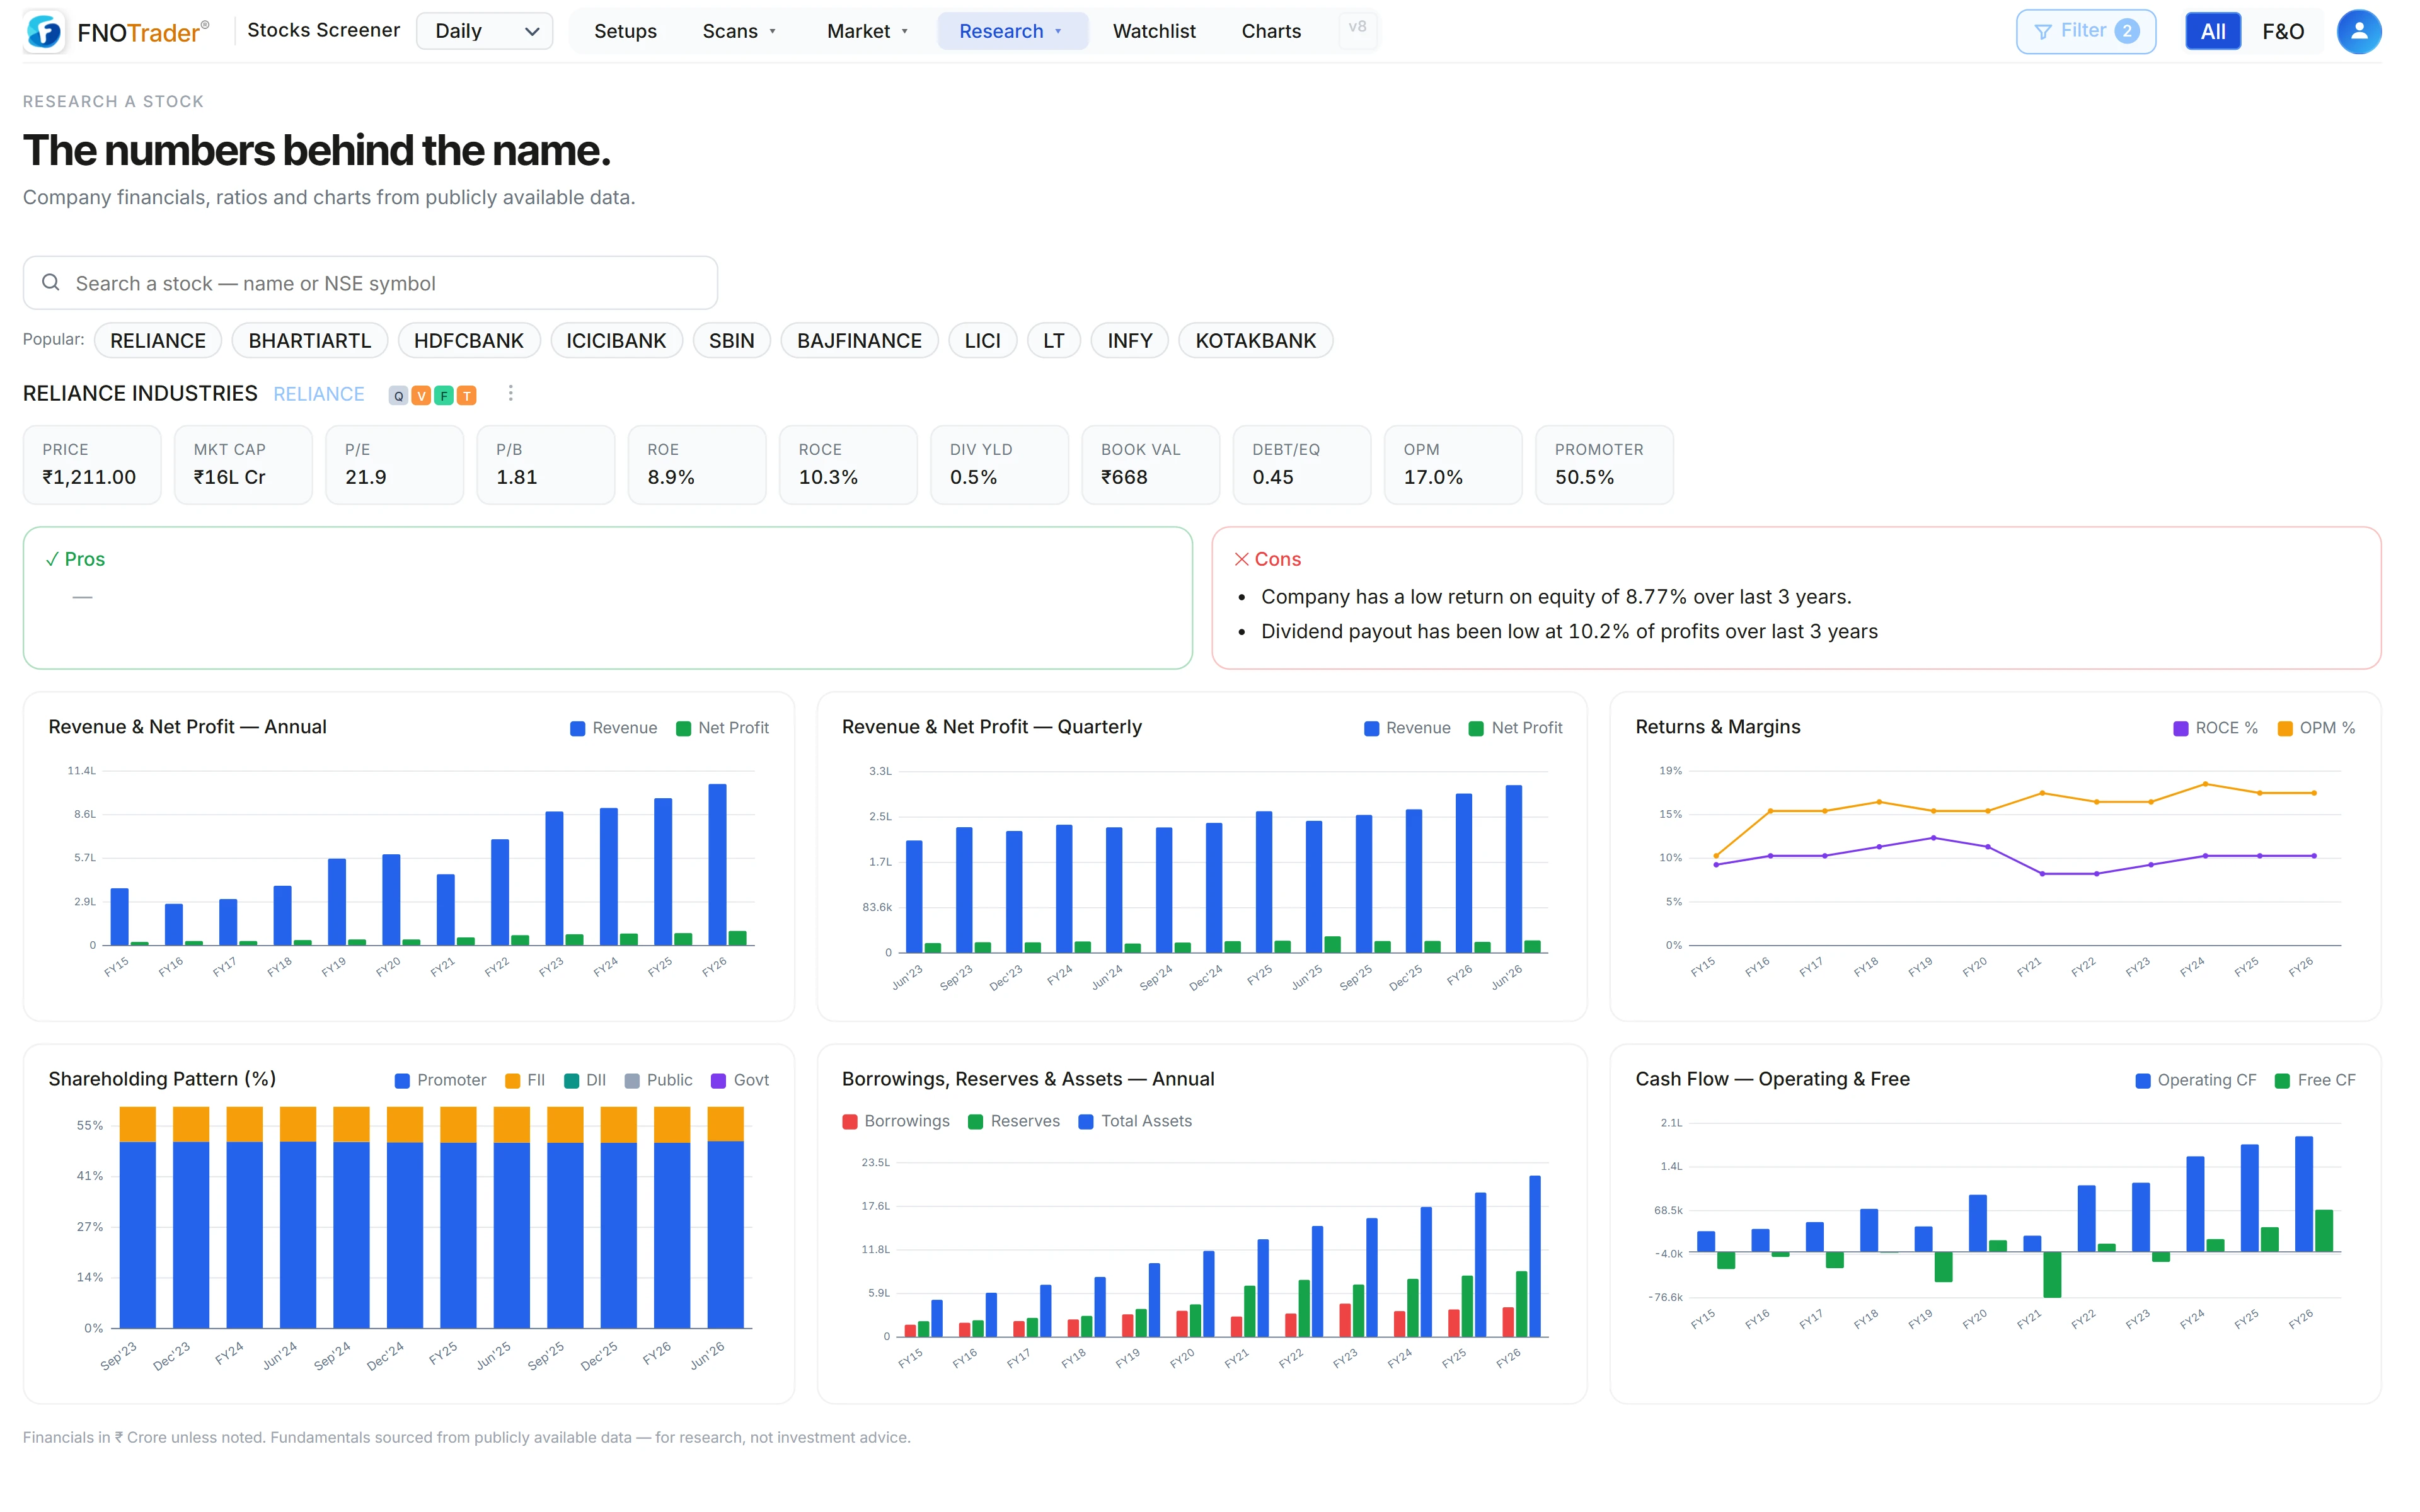
The Fundamentals page is the company file: search any stock and see price, market cap, ROCE, dividend yield, book value, debt/equity and promoter holding, with charts of annual and quarterly revenue and profit, ROCE and operating margin, shareholding pattern, borrowings against reserves and assets, and operating and free cash flow.
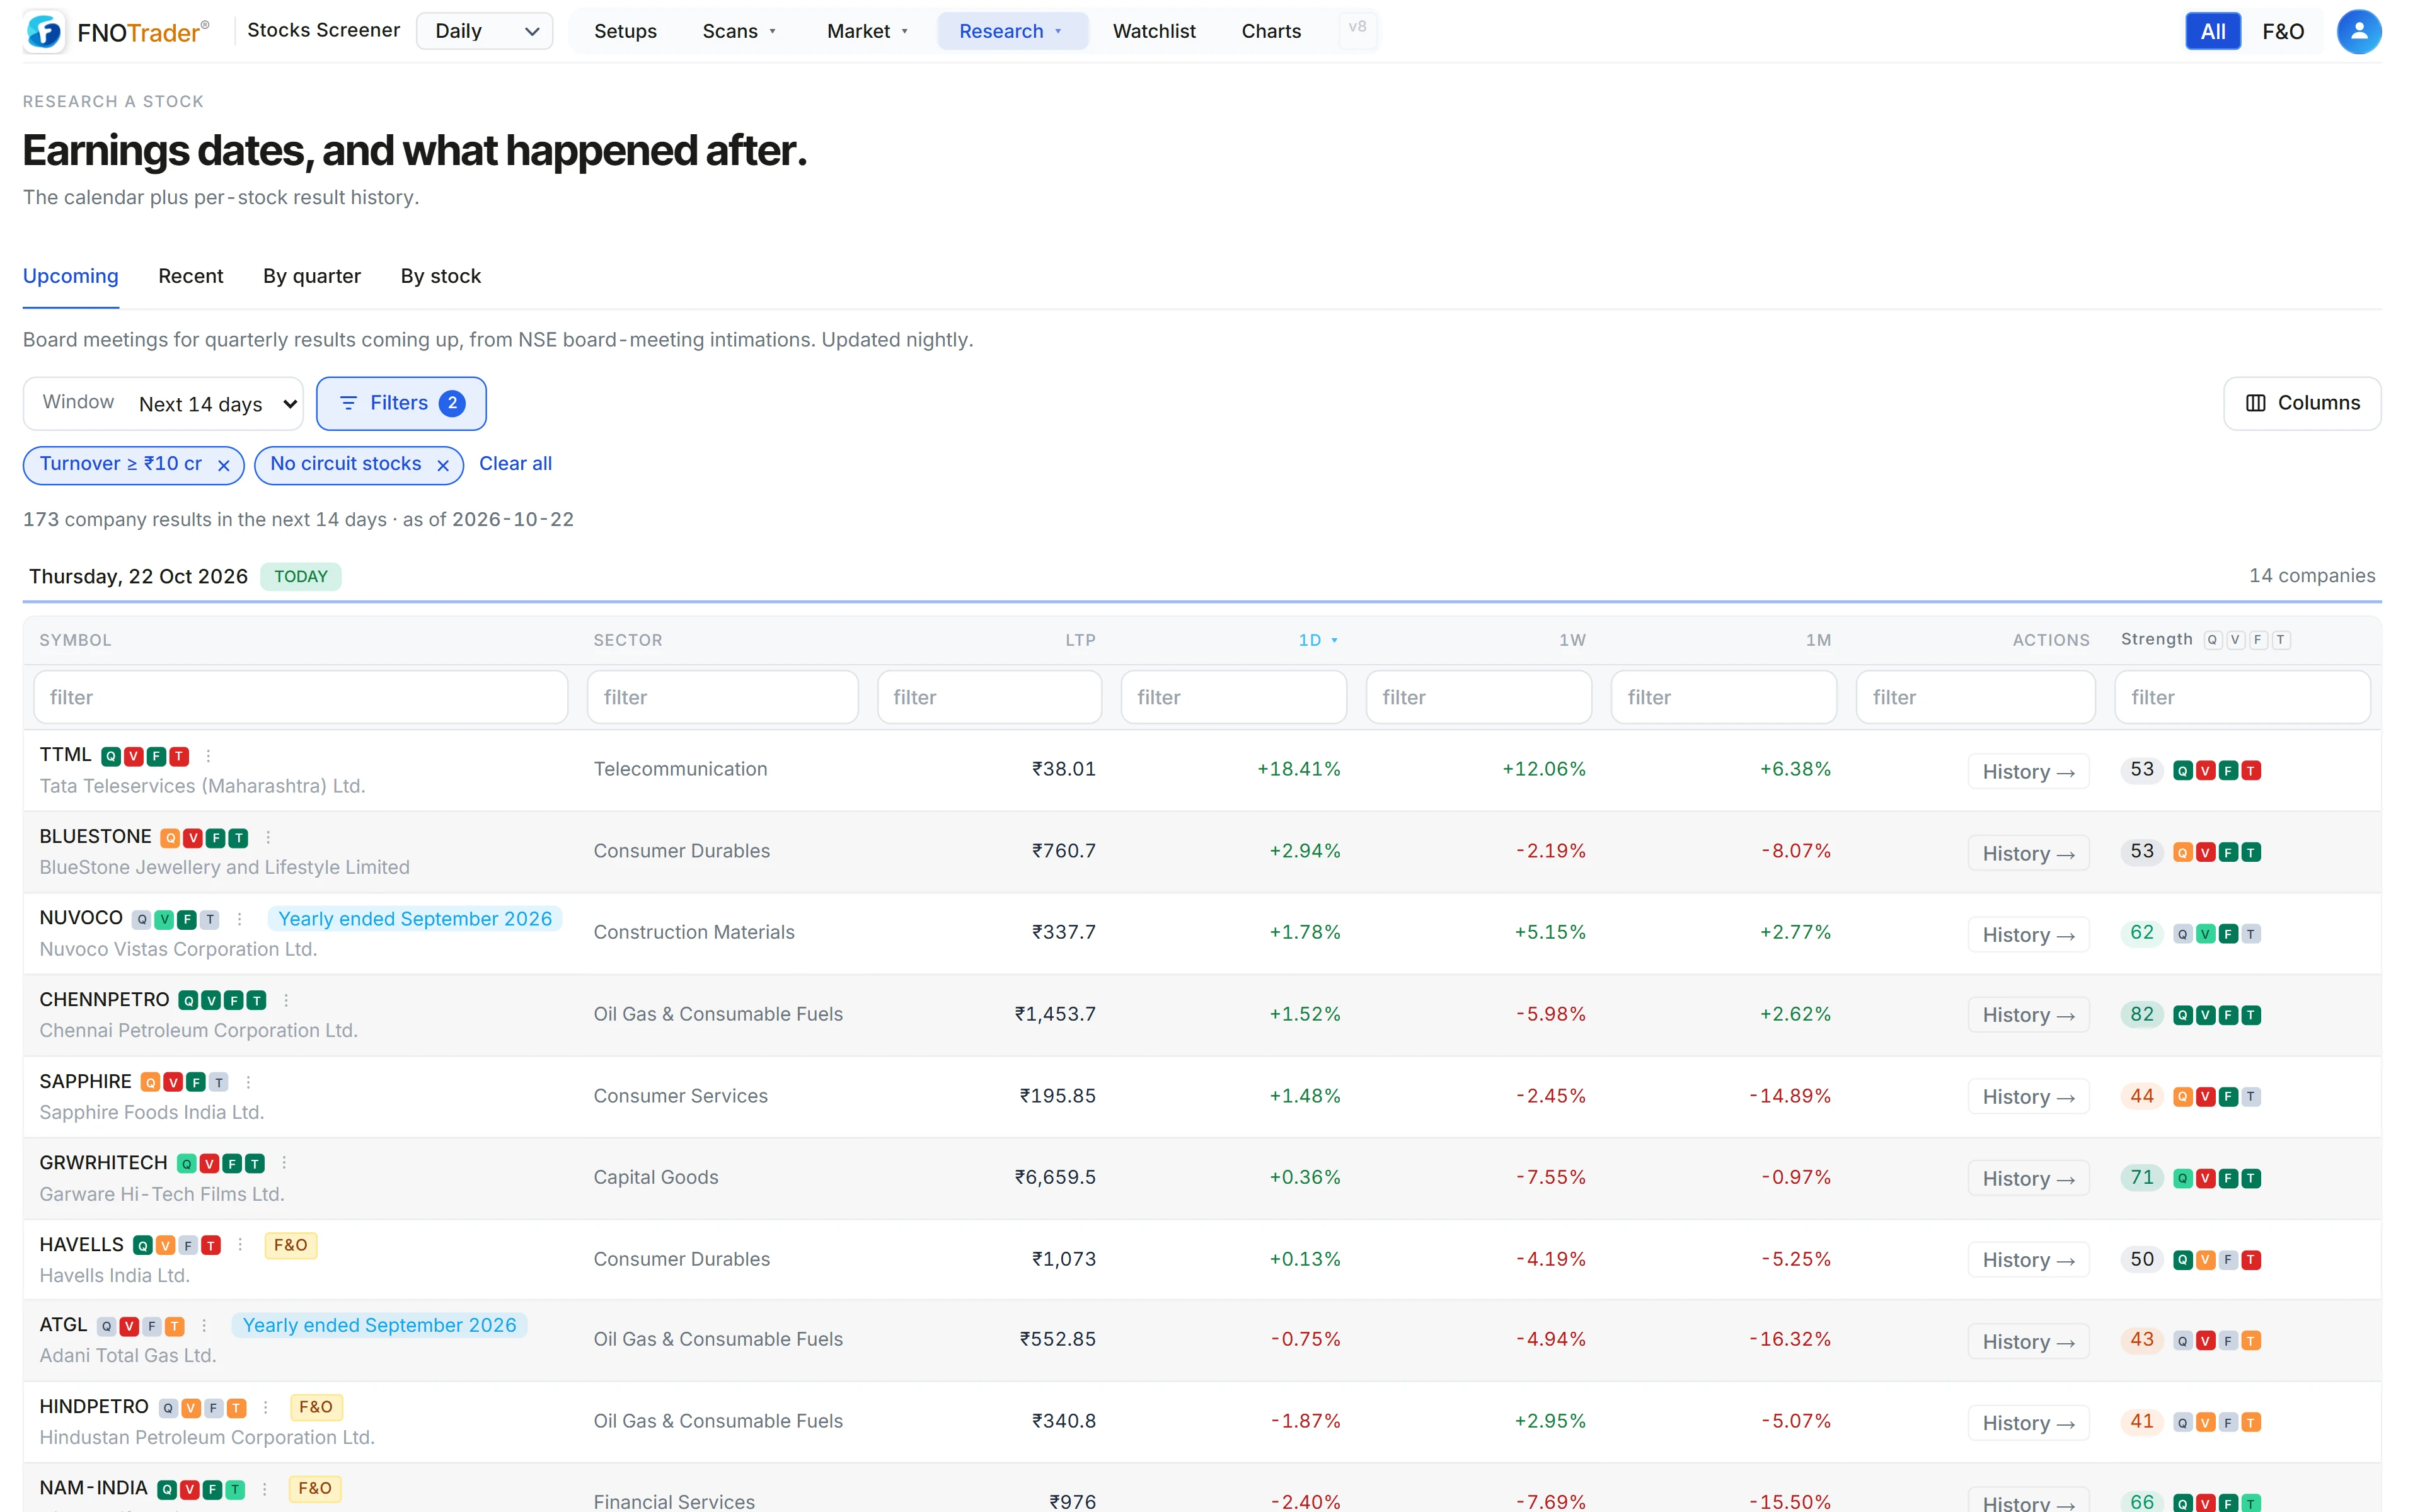
The Earnings calendar is the event view: who reports when, what they reported, and what the market did with it. Most research questions about results need both — the calendar tells you what happened this quarter, the fundamentals tell you whether it fits the longer pattern.
The four Earnings views
| View | What it shows |
|---|---|
| Upcoming | Board meetings for quarterly results from NSE intimations, grouped by date. Default next 14 days, up to 60. |
| Recent | The latest filings with verdict, growth and reaction. Default last 90 days, up to a year. |
| By quarter | Every stock that reported in a quarter, ranked by the move from the filing-day close to today. |
| By stock | One company’s result dates and how the price moved after each, with the parsed filing. |
For a stock with no announced date yet, the next date is estimated from the median gap between its last few filings and marked as an estimate, with lower confidence when there are fewer filings to go on.
Verdicts and the reaction rule
Each result gets a verdict against the same quarter a year earlier:
- Strong — sales up 20%+ and profit up 25%+
- Good — sales up 8%+ and profit up 10%+
- Turnaround — a profit after a year-ago loss
- Loss — a loss after a year-ago profit
- Weak — sales and profit both down, or profit down 20%+
- Mixed — everything in between
The reaction depends on when the result came out. Filed during market hours (before 15:30 IST): that session’s close against the previous close. Filed after the close or on a holiday: the next session’s close against the filing day’s close. The reaction is also shown relative to Nifty 50 over the same window, so a +2% reaction on a +2% market day reads as zero.
A worked example
Made-up filing at 17:10 IST on a Tuesday. Tuesday close ₹400, Wednesday close ₹428. Nifty 50 went from 24,000 to 24,240 over the same window.
- Reaction = 428 ÷ 400 − 1 = +7.0% (measured on Wednesday, because the filing came after the close)
- Nifty = 24,240 ÷ 24,000 − 1 = +1.0%
- Relative reaction = 7.0 − 1.0 = +6.0%
If the same filing had come at 11:00 on Tuesday, Tuesday’s own move would be the reaction. Getting this wrong is the most common way people misread how the market took a result.
Peer comparison
From any result you can open Peers: the same-industry companies (the largest 40 by market cap) with their latest result from the last 120 days, verdict, growth and price reaction. It answers the question that matters in a results season — was this company strong, or was the whole industry strong? If every peer printed Strong and reacted +5%, a Strong at +2% is the weak one.
Limits
- Fundamentals refresh weekly. A quarter parsed from a fresh NSE filing is added to the result view before the weekly refresh catches up.
- Estimated dates are estimates. Companies change their schedule; trust only the announced dates.
- Verdicts use year-on-year numbers only. Seasonal businesses need the quarter-on-quarter view too, which is in the result detail.
- Reaction says what the market did, not what it should have done.
Where to find it
- Open the Stocks Scanner.
- Choose Research → Earnings for the calendar, or Research → Fundamentals for the company file.
- In Earnings, pick Upcoming, Recent, By quarter or By stock; open a filing for detail and Peers.
- Result-day markers can be switched on in the Research Desk chart.
Screening many stocks on these numbers at once is covered in the stock screener guide.
Common questions
Where can I see the upcoming quarterly results calendar for NSE stocks?
Research → Earnings → Upcoming in the Stocks Scanner lists result board meetings from NSE intimations, grouped by date, for the next 14 days by default and up to 60.
How is the result-day price reaction measured?
For a filing during market hours, that session's close against the previous close. For a filing after 15:30 IST or on a holiday, the next session's close against the filing-day close. It is also shown relative to Nifty 50.
What does a Strong result verdict mean?
Sales up 20% or more and profit up 25% or more against the same quarter a year earlier.
How is the next result date estimated?
If no board meeting has been announced, it is the last filing date plus the median gap between recent filings, labelled as an estimate.
Can I compare a company's results with its peers?
Yes. Peers shows same-industry companies' latest results from the last 120 days with verdict, growth and price reaction.
More on Stocks App
More in Stocks App · App: Stocks Scanner · Definitions: glossary · All: every article