What the Industry page measures
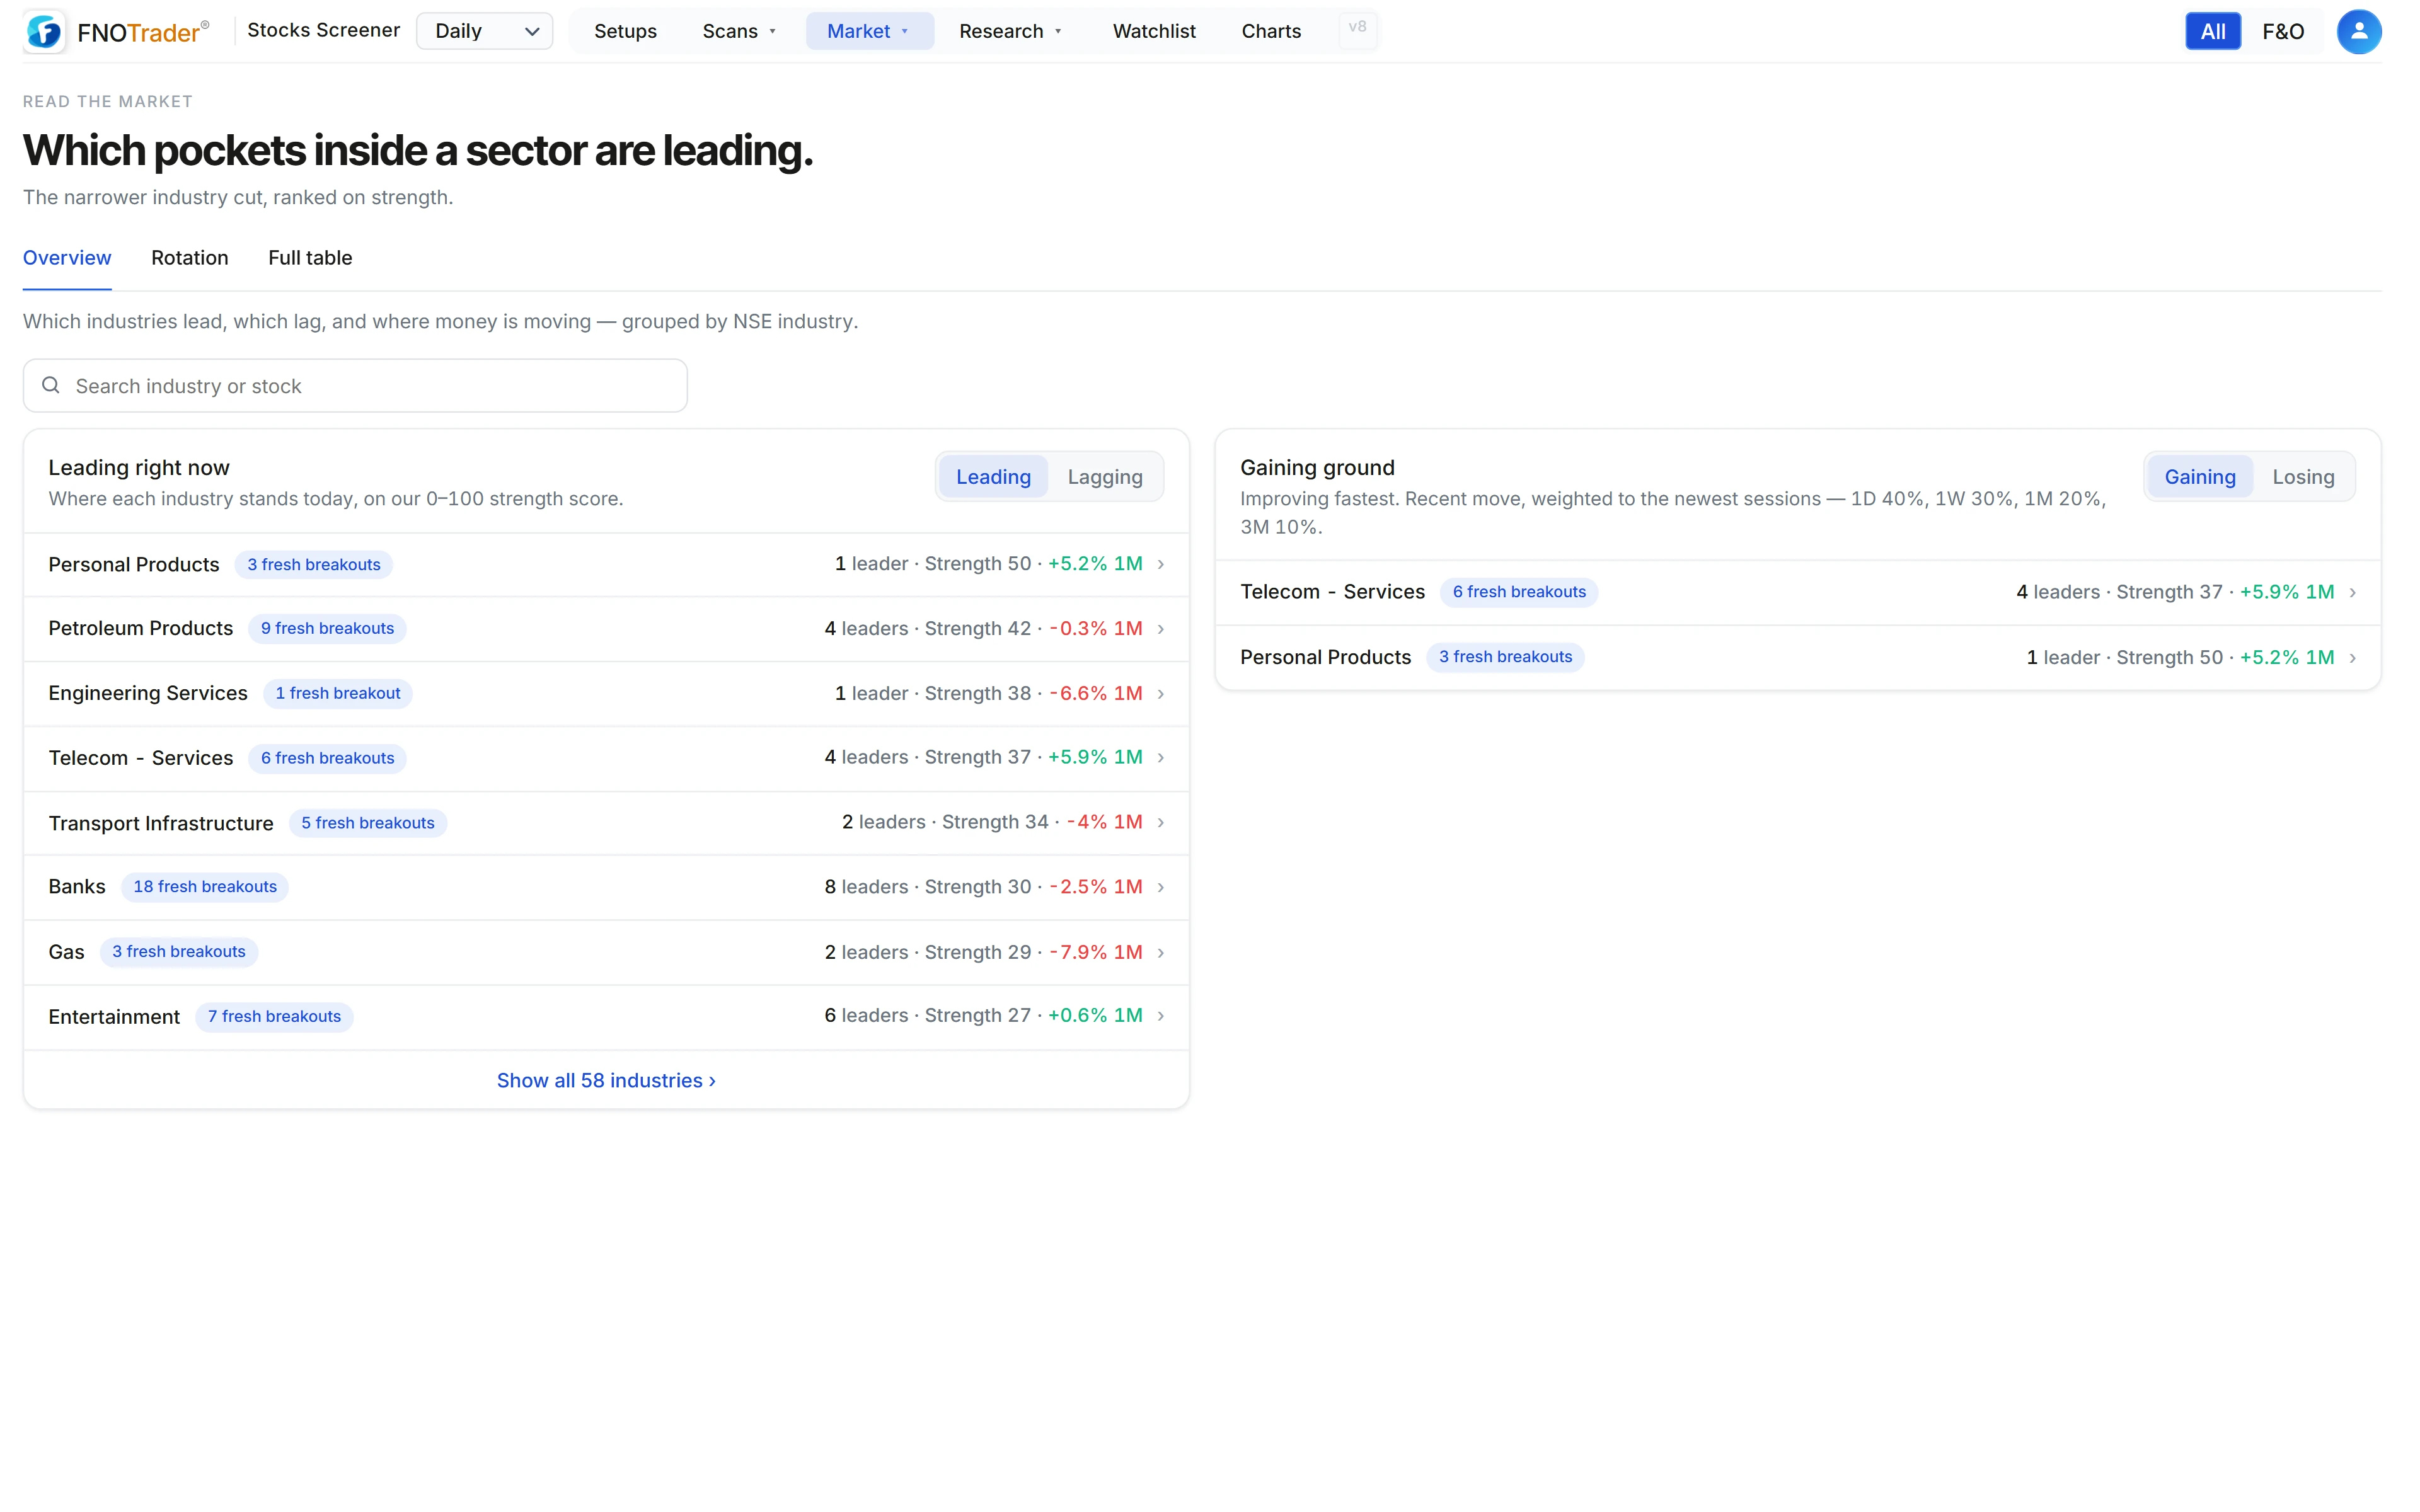
The Industry page groups stocks at NSE’s Industry level — Food Products, Auto Components, Pharmaceuticals and so on — and asks how many of each group’s stocks are behaving like leaders right now.
It is a different lens from Movers. Movers ranks groups by average return. Industry ranks them by how many members carry strength signals: near a 52-week high, at a multi-year high, high relative strength, or in a breakout pattern. Return says how far a group went; strength says how many of its stocks are in a position to keep going.
How the strength score is calculated
For each industry, the share of its stocks carrying each signal is combined:
| Weight | Signal |
|---|---|
| 30% | Share near or breaking a 52-week high |
| 25% | Share at an all-time or multi-year high |
| 25% | Share that are relative-strength leaders (RS 75 or higher, short-term or long-term, whichever share is larger) |
| 20% | Share in any breakout-type setup (flat base, VCP, bull flag, high tight flag and similar) |
The result is a 0–100 number. An industry where most stocks are basing below their highs scores low even if it bounced last week; an industry full of names pressing new highs scores high.
A worked example
A made-up industry of 20 stocks:
- 6 near or at a 52-week high → 30%
- 2 at an all-time or multi-year high → 10%
- 8 short-term RS leaders (40%), 5 long-term (25%) → the larger, 40%, is used
- 9 in a breakout-type setup → 45%
Score = 0.30 × 30 + 0.25 × 10 + 0.25 × 40 + 0.20 × 45 = 9 + 2.5 + 10 + 9 = 30.5, shown as 31. Respectable participation, but few names at long-term highs — the score tells you the group is improving rather than leading.
Gaining ground and losing ground
The second panel ranks industries by recent movement, weighted towards the newest sessions: 40% of the 1-day average return, 30% of 1-week, 20% of 1-month and 10% of 3-month.
With 1D +1.0%, 1W +3.0%, 1M +2.0% and 3M −4.0%, the value is 0.4 + 0.9 + 0.4 − 0.4 = +1.3: an industry still down over the quarter but turning sharply this week. Toggle the panel to see the fastest decliners instead.
The Full table splits industries into “money flowing in” and “money flowing out” by the same number, with strength, breakout count, RS leaders and returns from 1D to 6M. Be clear about what this is: a price-based measure of recent movement, not a record of actual buying and selling.
The industry rotation graph
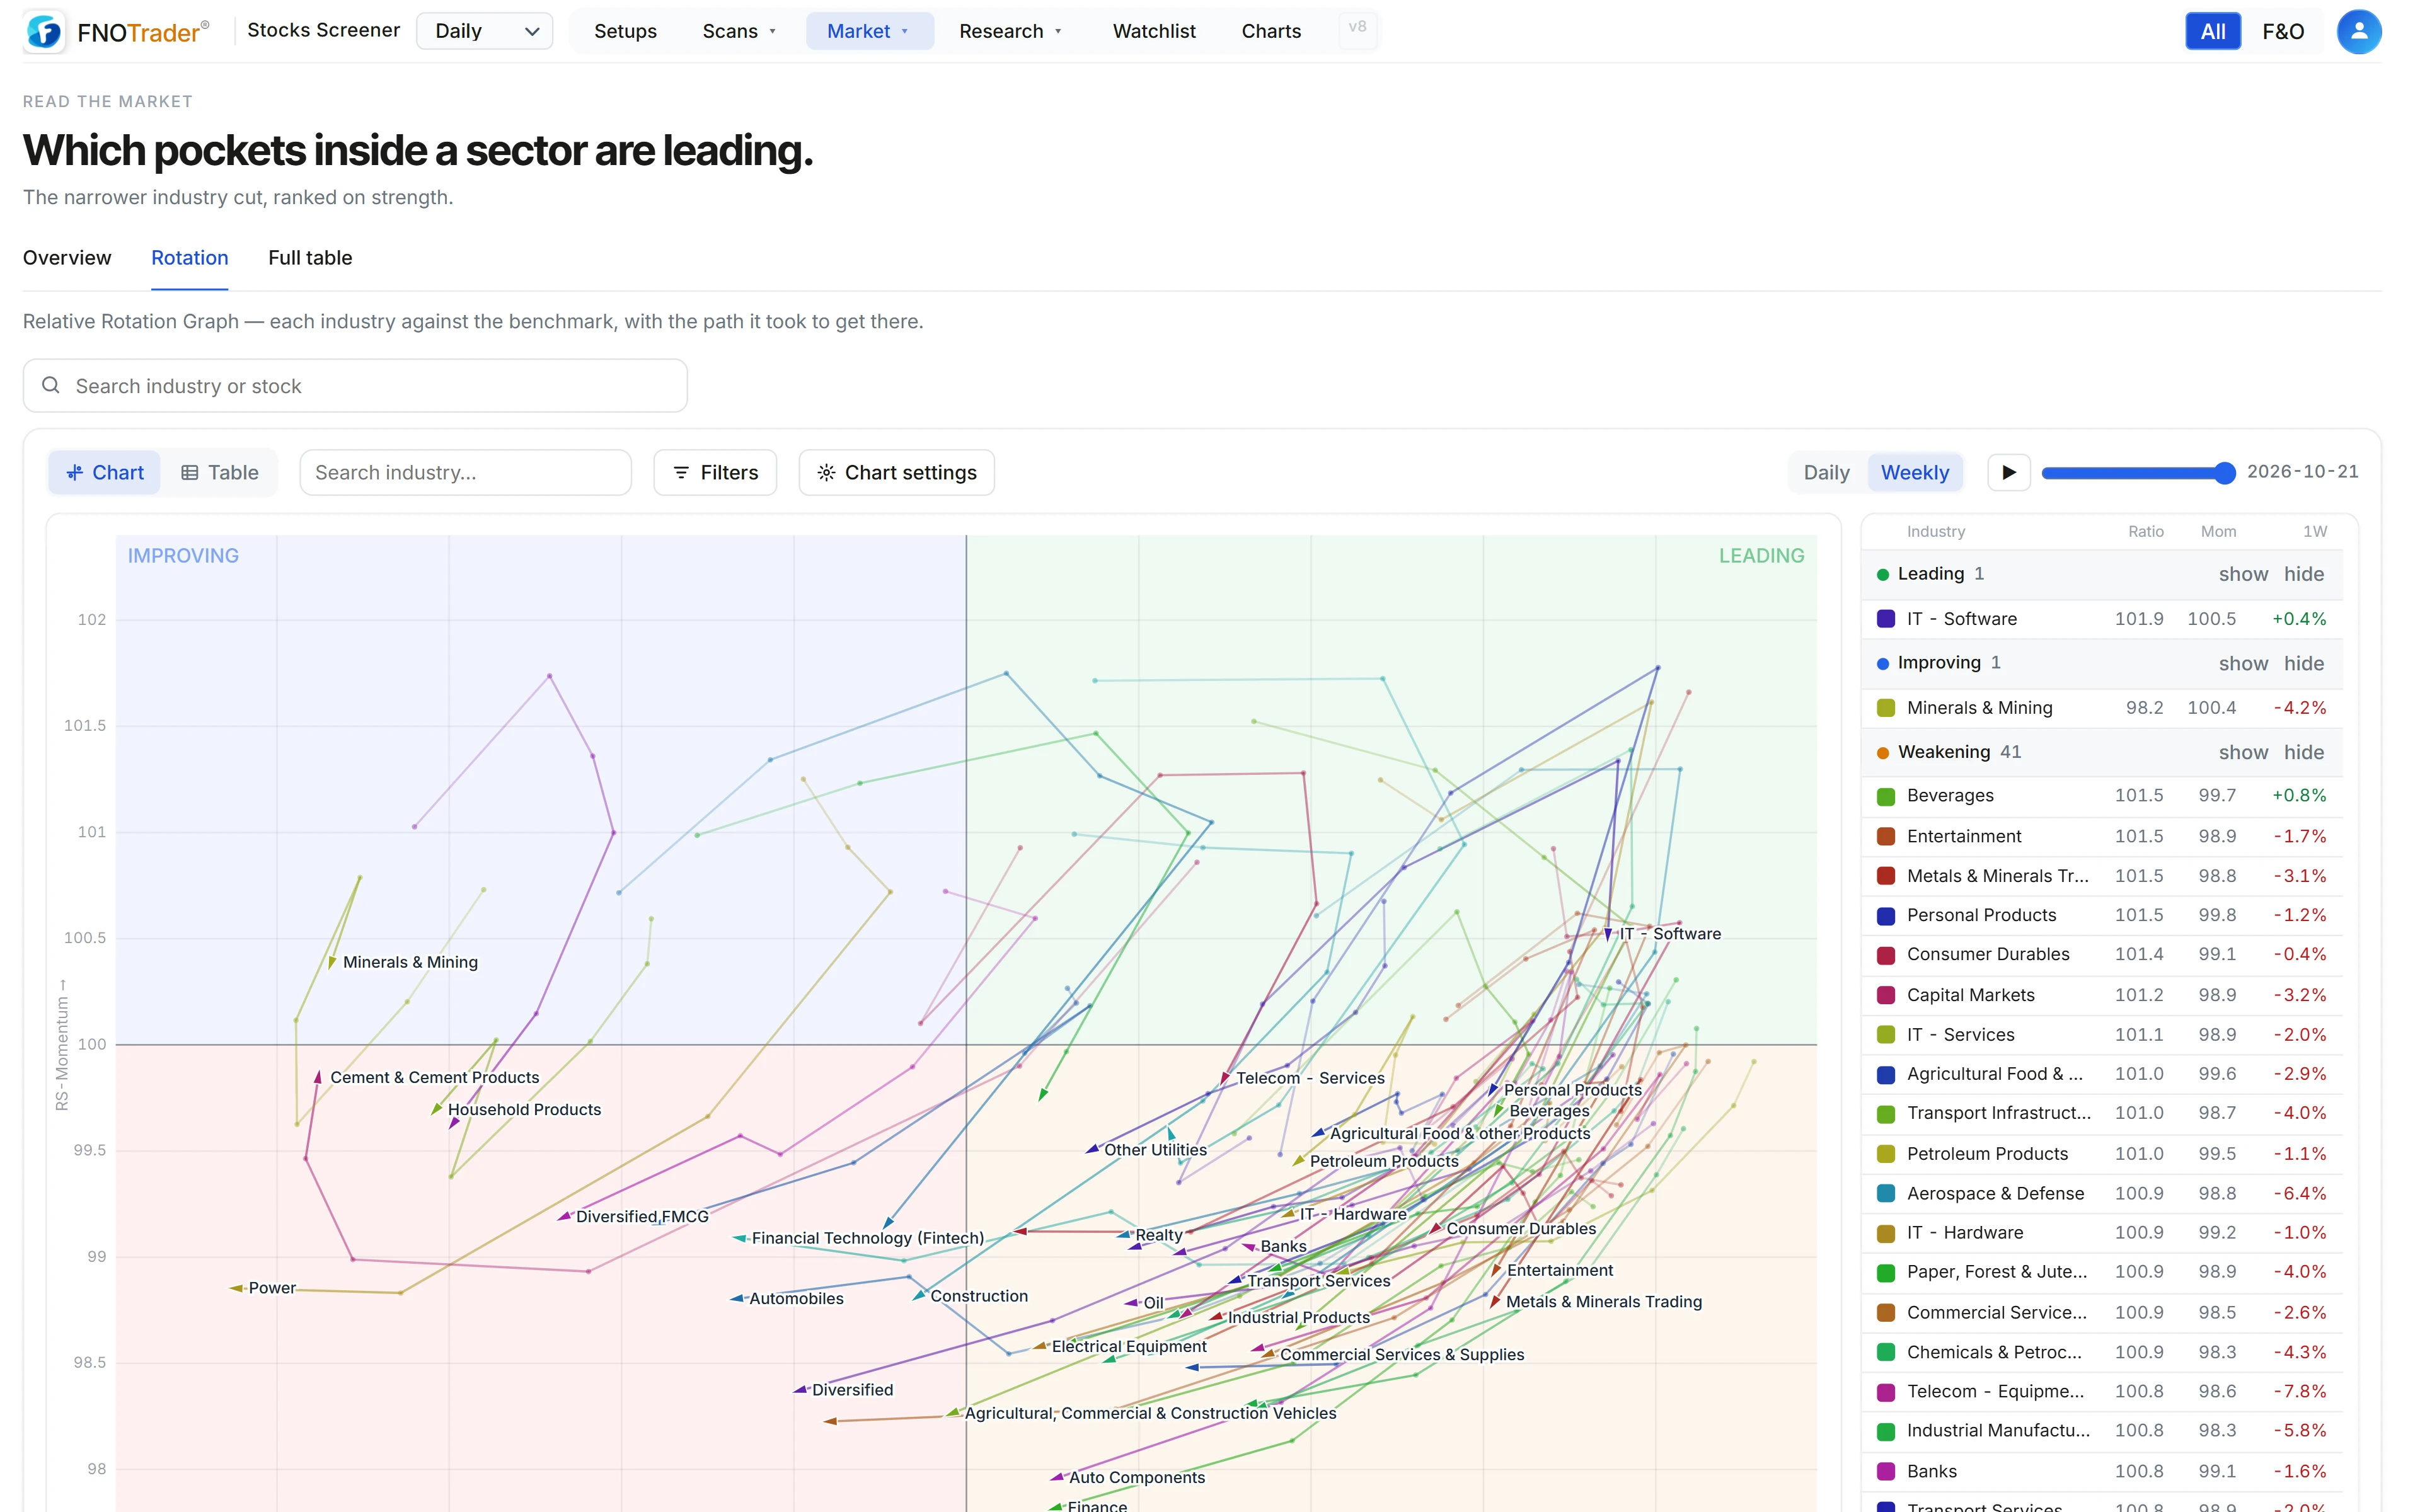
The Rotation view draws a Relative Rotation Graph for industries. NSE has no index for most industries, so each one is built as an equal-weight composite of its own stocks’ daily returns, then run through the same RS-Ratio and RS-Momentum maths as the sector graph against Nifty 50, Nifty 500 or Nifty 100. Industries with fewer than three members are left off. Tails are on by default here.
The quadrants and controls are explained in reading sector rotation in the app.
Limits and common mistakes
- Small industries swing. With five stocks, one breakout moves the score by several points. Check the stock count under the name.
- The score lags a sudden turn. Stocks need to reach highs before they count, so a sharp rebound from lows shows up in Gaining ground first.
- Signals depend on the daily scan. Setups are recognised on settled daily bars, so the score reflects the last scan, not the last tick.
- A high score describes participation. It is not a statement that the industry will outperform.
Where to find it
- Open the Stocks Scanner and choose Market → Industry.
- Overview shows Leading/Lagging and Gaining/Losing ground; tap an industry for its stocks.
- Switch to Rotation for the RRG or Full table for every column.
- Type a stock symbol in the search box to highlight the industry it belongs to.
Common questions
How do I find the strongest industries in the Indian stock market?
Use Market → Industry in the Stocks Scanner. Each NSE industry gets a 0–100 strength score based on how many of its stocks are near 52-week or multi-year highs, are relative-strength leaders, or are in breakout setups.
What does 'money flowing in' mean on the Industry page?
It is a weighted recent-return measure (1D 40%, 1W 30%, 1M 20%, 3M 10%). Positive values are listed as flowing in. It is based on price, not on actual buy and sell volumes.
How is an industry RRG built when there is no industry index?
Each industry is turned into an equal-weight composite of its member stocks' daily returns, and that composite is compared with the benchmark using the same RS-Ratio and RS-Momentum maths as the sector graph.
Why does a small industry jump around in the ranking?
Its score is a share of its stocks, so with only a few members a single breakout changes the share a lot. Check the stock count before reading much into it.
More on Stocks App
More in Stocks App · App: Stocks Scanner · Definitions: glossary · All: every article