Four lists, one market
Each scan is a separate list, re-run every five minutes from 09:15 to 15:30 IST on live prices for every stock in the scan. Reference levels — previous day's high, 20-day and 52-week highs, average volume — are built once each morning from prior sessions.
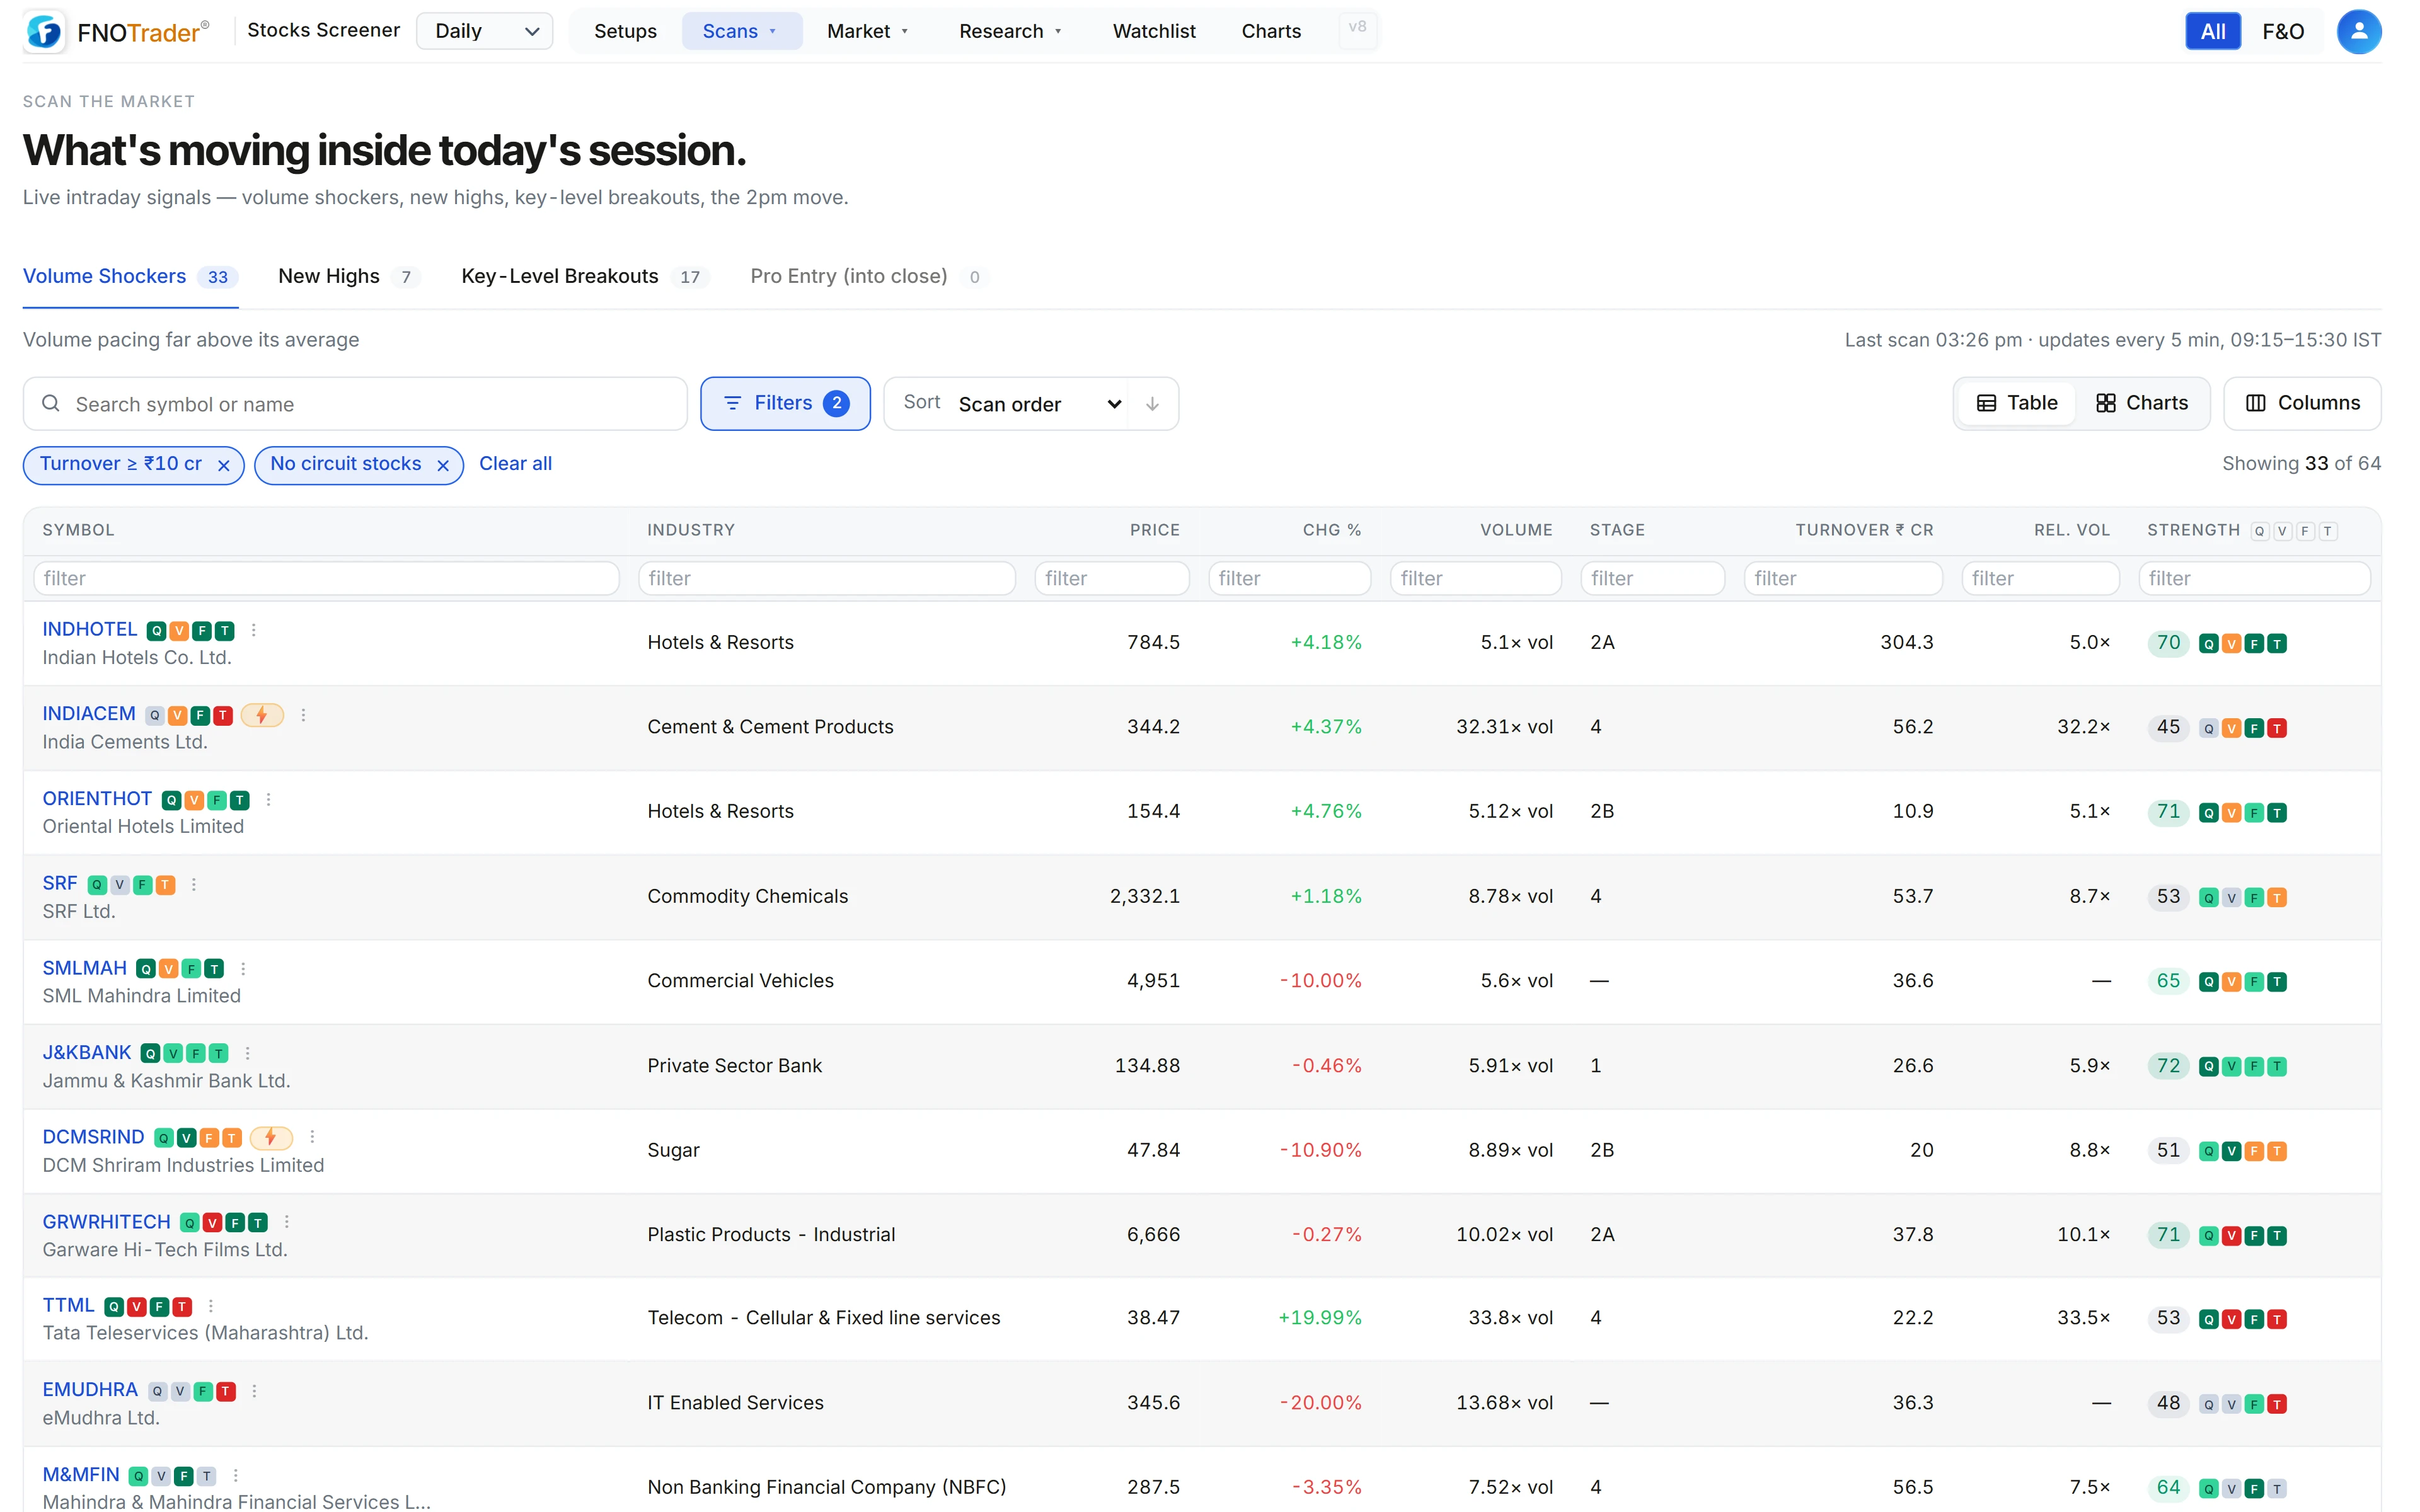
| List | What it catches |
|---|---|
| Volume Shockers | Volume on course to finish far above normal |
| New Highs | Price above a 20-day, 52-week or higher high |
| Key-Level Breakouts | Price through the previous day's high or a swing high on volume |
| Pro Entry (into close) | A strong, volume-backed move holding near the day's high late in the session |
Each list is ranked by its own conviction score and capped at 150 stocks.
Volume Shockers and projected volume
Comparing 11:30 volume with a full day's average is meaningless; the day is not over. So the scan projects: volume so far divided by the fraction of the 375-minute session that has passed.
Worked example, made-up numbers. At 11:30, 135 minutes have passed: 135 / 375 = 0.36 of the session. A stock has traded 4 lakh shares against a 20-day average of 3 lakh.
- Volume so far versus average: 4 / 3 = 1.33×.
- Projected full-day volume: 4 / 0.36 = 11.1 lakh, which is 3.7× the average.
The rules: projected volume at least 3× average, volume already at least 1× average, at least 15 minutes into the session, and an average of at least 50,000 shares a day. This stock qualifies. The projection is linear; real volume is heavier at the open and close, which is why the bar is set high.
New Highs and Key-Level Breakouts
New Highs reports the strongest tier the live price has cleared: above the 20-day high, above the 52-week high, or above the top tier, labelled all-time. Further above the level ranks higher.
Key-Level Breakouts needs price at least 0.1% above the level, and volume pacing at least 1.3× normal (the same projection as above). The level is:
- the previous day's high — but only if the stock opened no more than 1% above it, so a gap that cleared the level before the bell isn't counted as a breakout; or
- the swing high, the highest high of the last 60 sessions, when that is the harder level.
Pro Entry: the late-session move
Between 13:45 and 15:15 IST, this list looks for stocks:
- up at least 2.5% on the day,
- trading within 1.5% of the day's high (not fading the move),
- with volume pacing at least 1.2× normal and an average of at least 50,000 shares.
The idea is strength that is holding into the close rather than a spike that has already given back. Outside that window the list is empty by design.
Filters, and what the page shows off-hours
The Filters panel narrows all four lists at once: industry, index, Weinstein stage, trend template score, minimum relative volume, F&O stocks only, and stocks on your watchlists only. The app-wide global filter (turnover, circuits, GSM, price) applies too. Lists are stocks only — ETFs and indices are excluded.
The page shows the time of the last scan. Outside market hours nothing new is computed; you see the last scan from the session until the next open. Before the first scan of the day it says so.
Limits
- Five minutes is not tick speed. A level can break and fail between scans.
- The top New Highs tier is short-history. It is measured against the daily highs the live scan loads, a little over a year. For a full-history all-time-high check use ATH Breakout on the Breakouts page.
- Early projections are noisy. The first 15 minutes are skipped for volume, and the first hour still overstates heavy-open stocks.
Where to find it
- In the Stocks app, open Scans → Intraday.
- Pick a list; open Filters to narrow it.
- Switch to charts to see each stock's chart beside the signal.
Common questions
What is a volume shocker in stocks?
A stock whose volume is on course to finish far above its normal level. Here it means projected full-day volume of at least 3 times the 20-day average, with volume already at or above the average.
How often does the FNOTrader intraday scanner update?
About every five minutes from 09:15 to 15:30 IST. Outside market hours it shows the last scan of the session.
How is a previous day high breakout confirmed?
Price must be at least 0.1% above yesterday's high, the stock must not have gapped more than 1% above it at the open, and volume must be pacing at least 1.3 times normal.
What is the Pro Entry list?
Stocks between 13:45 and 15:15 IST that are up at least 2.5%, within 1.5% of the day's high, on above-normal volume.
More on Stocks App
More in Stocks App · App: Stocks Scanner · Definitions: glossary · All: every article