One page, four questions
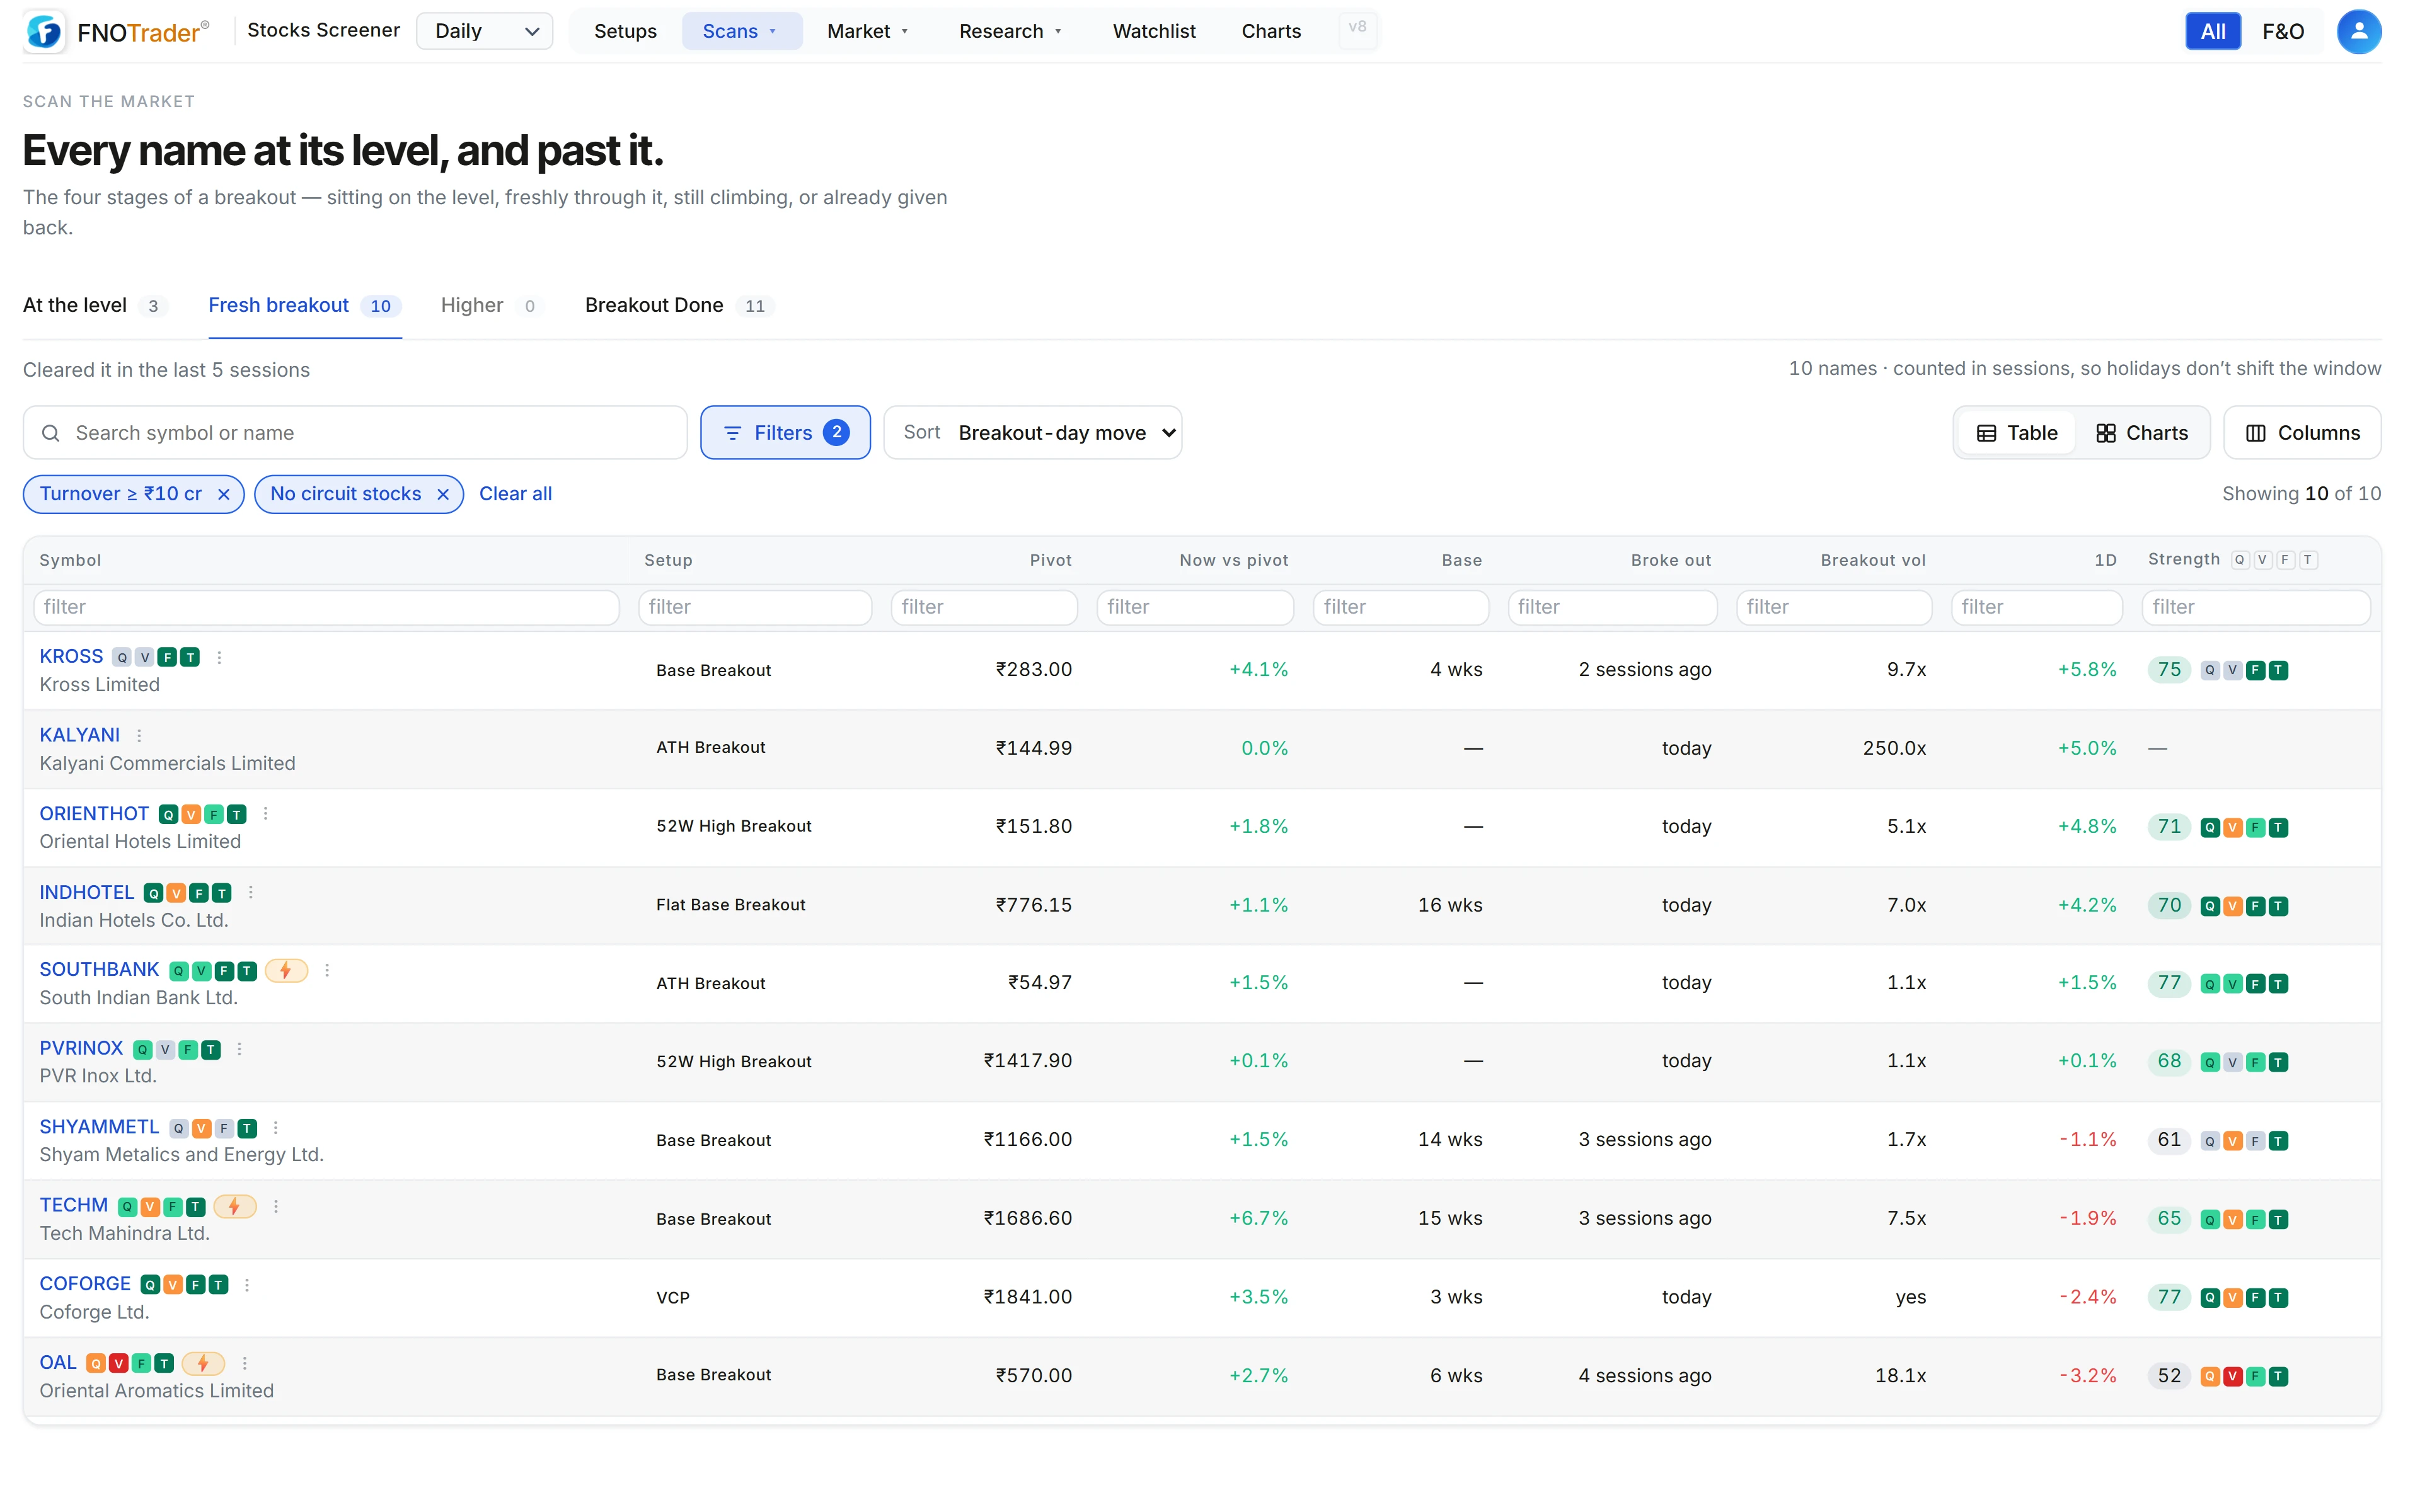
For any level there are four states worth knowing: still under it, just through it, well through it, or through it and back. The Breakouts page puts each on its own tab with a count, so the shape of the market is readable before you click anything.
| Tab | Who is on it |
|---|---|
| At the level | Still under the level and within 1.5 ADR of it |
| Fresh breakout | Cleared the level in the last 5 sessions |
| Higher | Cleared it earlier and still above it |
| Breakout Done | Cleared it, then lost it |
A stock that clears a VCP pivot and its 52-week high on the same day is one event, so each stock appears once per tab.
Which setups count as breakouts
The page reads one fixed list, the same list used for breakout counts elsewhere in the app: VCP, Base Breakout, Flat Base Breakout, ATH Breakout, 52W High Breakout, New High Breakout, Multi-Year High, Swing High Breakout, Momentum Breakout, Cup & Handle, Darvas Box, High Tight Flag and Gap Up & Base.
Pullback and reversal setups are left out on purpose: a retest of a level is an entry near it, not a clearance of it. Breakout Pullback stays on the Setups page.
How the high-level breakouts are measured
All four are judged on the stock's full stored daily history, not the six months of bars a daily chart shows, so “all-time” really is all the history held.
- ATH Breakout — the close is at or above the highest previous close, or within 0.5% of it.
- Multi-Year High — the close is the highest in N years, for the largest N from 2 up to about 16 that it clears, but is not an all-time high. A close above the six-year high is reported as a 6-year high even though it also clears the 2-to-5-year highs.
- 52W High Breakout — at or above the 52-week high, but not at a two-year or all-time high, which belong to the tiers above.
- New High Breakout — a close at or above the highest close of roughly the last six months, in the upper part of the day's range, on at least 1.2× the 50-bar average volume.
- Swing High Breakout — a tight horizontal range of 3 to 20 bars under 10% deep, resistance touched at least twice, then a decisive close through it on at least 1.3× average volume in the last few bars.
Each stock gets the highest tier it qualifies for, which is why ATH stocks don't also flood the 52-week list.
Why “At the level” is measured in ADR
A fixed 2% is a long way for a quiet large-cap and nothing for a small-cap that moves 5% a day. So closeness is measured in ADR — the stock's average daily range — and a stock is listed if it is within 1.5 average days of the level. If the ADR isn't known, a 3% cut-off is used instead.
Worked example with made-up numbers: two stocks are each 1.5% under a ₹1,000 level.
- Stock A has an ADR of 2%: 1.5 / 2 = 0.75 ADR. It is listed.
- Stock B has an ADR of 0.8%: 1.5 / 0.8 = 1.9 ADR. It is not — for this stock, 1.5% is nearly two normal days of movement away.
The tab sorts closest first by default, because proximity is the whole point of it.
Windows, sorting and columns
Breakout within. Today, This week or This month — 1, 5 or 22 sessions. It applies to Fresh breakout and Higher, and is counted in sessions, so a week with a holiday is still five trading days. At the level has no breakout date, so no window.
Sort. At the level: closest to the level, confidence or today's move. The other tabs: breakout-day move, most recent, confidence, or furthest past the pivot. The sort is remembered separately for each tab.
Columns. Symbol, setup, pivot, how far price is from it, base length in weeks, and either the volume dry-up (before) or the breakout volume and how long ago it broke out (after). The table and chart-grid views show the same list.
Reading it without fooling yourself
- Higher is not “still a buy”. A stock 25% past its pivot is on the Higher tab because the level held; the risk to that level is now large.
- Breakout Done is information, not a short signal. Many stocks reclaim a level after losing it once.
- The page reflects the daily scan. It updates after the close with the setups; it is not a live feed. For in-session level breaks see Intraday scans.
Where to find it
- In the Stocks app, open Scans → Breakouts.
- Pick a tab: At the level, Fresh breakout, Higher or Breakout Done.
- Set the breakout window and sort from the toolbar; switch between table and charts.
Common questions
How do I find stocks breaking out to an all-time high in India?
Open Scans, then Breakouts, in the FNOTrader Stocks app. ATH Breakouts are measured against the stock's full stored price history, and the Fresh breakout tab lists those that cleared their level in the last five sessions.
What is the difference between a 52-week high and a multi-year high breakout?
A 52-week high is the highest level in a year. A multi-year high clears the highest close of two or more years. Each stock is tagged with the highest tier it clears, so a multi-year high is not also listed as a 52-week high.
What does At the level mean?
The stock is still under a breakout level and within 1.5 times its average daily range of it, or within 3% when the range is unknown.
Is Breakout Pullback on the Breakouts page?
No. Pullbacks are retests of a level, not clearances, so they stay on the Setups page.
More on Stocks App
More in Stocks App · App: Stocks Scanner · Definitions: glossary · All: every article