What the page shows
For a stock, an index or a sector, Seasonality takes the return of each calendar month in every year of history and summarises them month by month: how much it moved on average, how often it rose, and how widely the results varied.
Three views: Stock picks ranks stocks for a chosen month, Calendar shows one name’s year-by-month grid of returns (financial year April–March by default, or calendar year), and Heatmap compares sectors or indices across the twelve months.
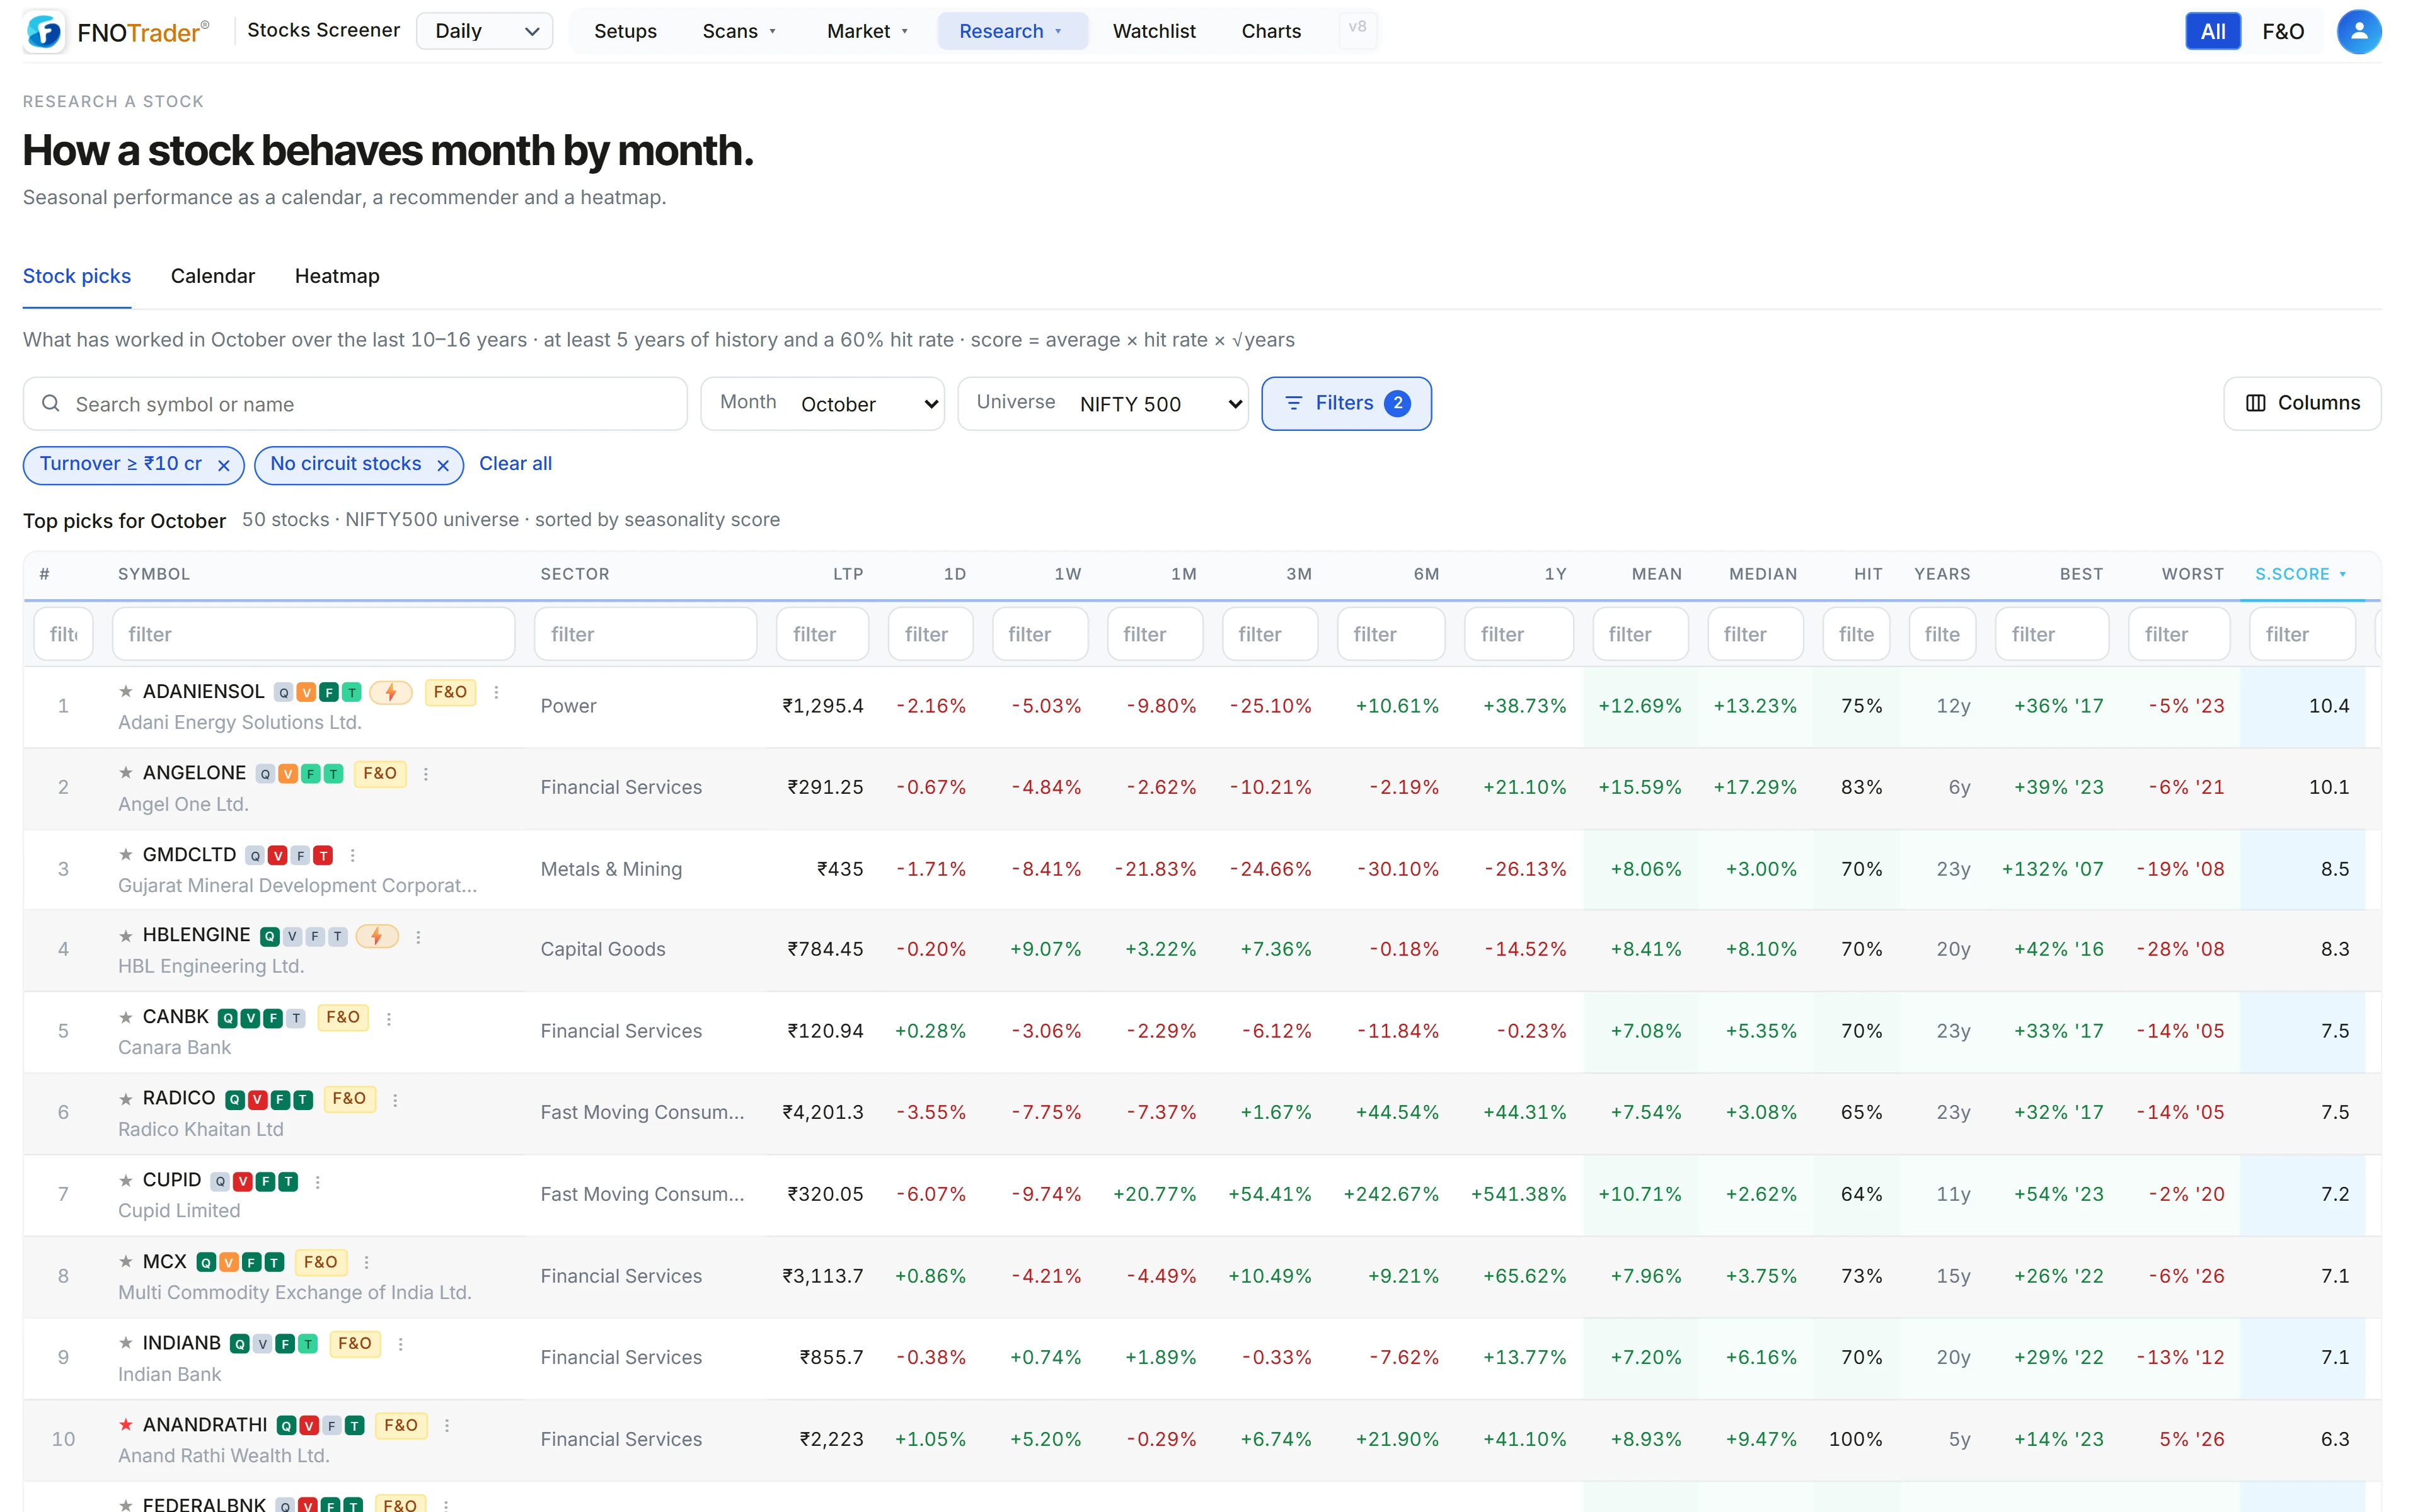
The statistics, one by one
A month’s return is that month’s close against the previous month’s close. For each calendar month:
| Statistic | Meaning |
|---|---|
| Mean | Average return across years |
| Median | The middle year — less swayed by one huge year |
| Hit rate | Share of years the month was positive |
| Std dev | How widely the yearly results spread |
| Best / worst | The best and worst year, with the year named |
| Years | How many years the numbers rest on |
A month needs at least three years of data to be shown at all. Index and sector figures are the equal-weight average of their member stocks, not the official index series.
How the ranking works
The Stock picks list ranks stocks for a month by:
score = mean × (hit rate ÷ 100) × √(years ÷ 10)
It rewards a positive average, a high share of positive years, and a longer record. Defaults: at least 5 years of history, a hit rate of 60% or more, and the Nifty 500 as the universe (other choices include Nifty 50, 100, 200, Midcap 150, Smallcap 250 and F&O stocks). Two sanity filters also apply: a monthly mean above 30% is excluded as a data or penny-stock artefact, and so is any stock whose median is less than a fifth of its mean — a sign that one or two freak years are carrying the average.
A worked example
Made-up stock, ten Novembers: +6, +4, −2, +8, +3, +5, −1, +7, +2, +4 (%).
- Mean = 36 ÷ 10 = 3.6%; positive years = 8, so hit rate = 80%
- Score = 3.6 × 0.80 × √(10 ÷ 10) = 2.88
A second stock with a 6.0% mean and 80% hit rate but only five years: 6.0 × 0.80 × √0.5 = 4.8 × 0.707 = 3.39. It still ranks higher despite half the history — the square-root term shrinks short records, but only gently. Always look at the Years column.
Why seasonality is weak evidence
This is the section to read before using any of it.
- Tiny samples. Ten Novembers are ten data points. Eight up out of ten happens by chance more often than intuition suggests.
- Multiple comparisons. With some 2,000 stocks and 12 months there are tens of thousands of stock-month cells. Many will show 80%+ hit rates purely by luck, and a ranking will put exactly those at the top.
- Overlap with the market. If the whole market tends to rise in a month, most stocks will look seasonal in it. Compare a stock with its index’s month before calling it special.
- Survivorship. Index and sector figures use today’s members, so companies that dropped out are missing from the history.
- No mechanism. A pattern with a reason behind it (a festival season for retailers, a budget month) deserves more weight than one without.
Treat a seasonal tendency as a question to investigate, never as a reason by itself.
Where to find it
- Open the Stocks Scanner and choose Research → Seasonality.
- In Stock picks, choose the month and the universe.
- In Calendar, choose stock, index or sector and a name, and switch between financial and calendar year.
- In Heatmap, compare sectors or indices across all twelve months.
To see whether a sector is strong right now rather than in a typical year, use sector rotation.
Common questions
What is stock market seasonality?
The tendency of some stocks, sectors or indices to perform differently in particular calendar months. It is measured from past monthly returns and is usually weak evidence on its own.
What is hit rate in seasonality?
The share of years in which the stock rose in that month. Eight positive Novembers out of ten is an 80% hit rate.
How does FNOTrader rank seasonal stocks?
By mean monthly return × (hit rate ÷ 100) × √(years ÷ 10), with defaults of at least 5 years, a 60% hit rate and the Nifty 500 universe.
Is the Nifty 50 seasonality the official index?
No. Index and sector seasonality are equal-weight averages of the current member stocks' monthly returns, which differs from the official market-cap-weighted index.
Should I trade a stock because of its seasonality?
Seasonality alone is not enough. Small samples and the sheer number of stock-month combinations mean many patterns are chance. Use it as a prompt for research.
More on Stocks App
More in Stocks App · App: Stocks Scanner · Definitions: glossary · All: every article