What the score is, and what it is not
The strength score summarises four separate questions about a stock — is the business good, is it cheap, are results improving, is the price acting well — into one number from 0 to 100, ranked against the stock’s industry peers where that makes sense.
It is a sorting tool. It helps you find the companies that look strong on several fronts at once and the ones that look weak. It is not a recommendation, and the labels are deliberately neutral: Very Strong, Strong, Neutral, Weak, Very Weak.
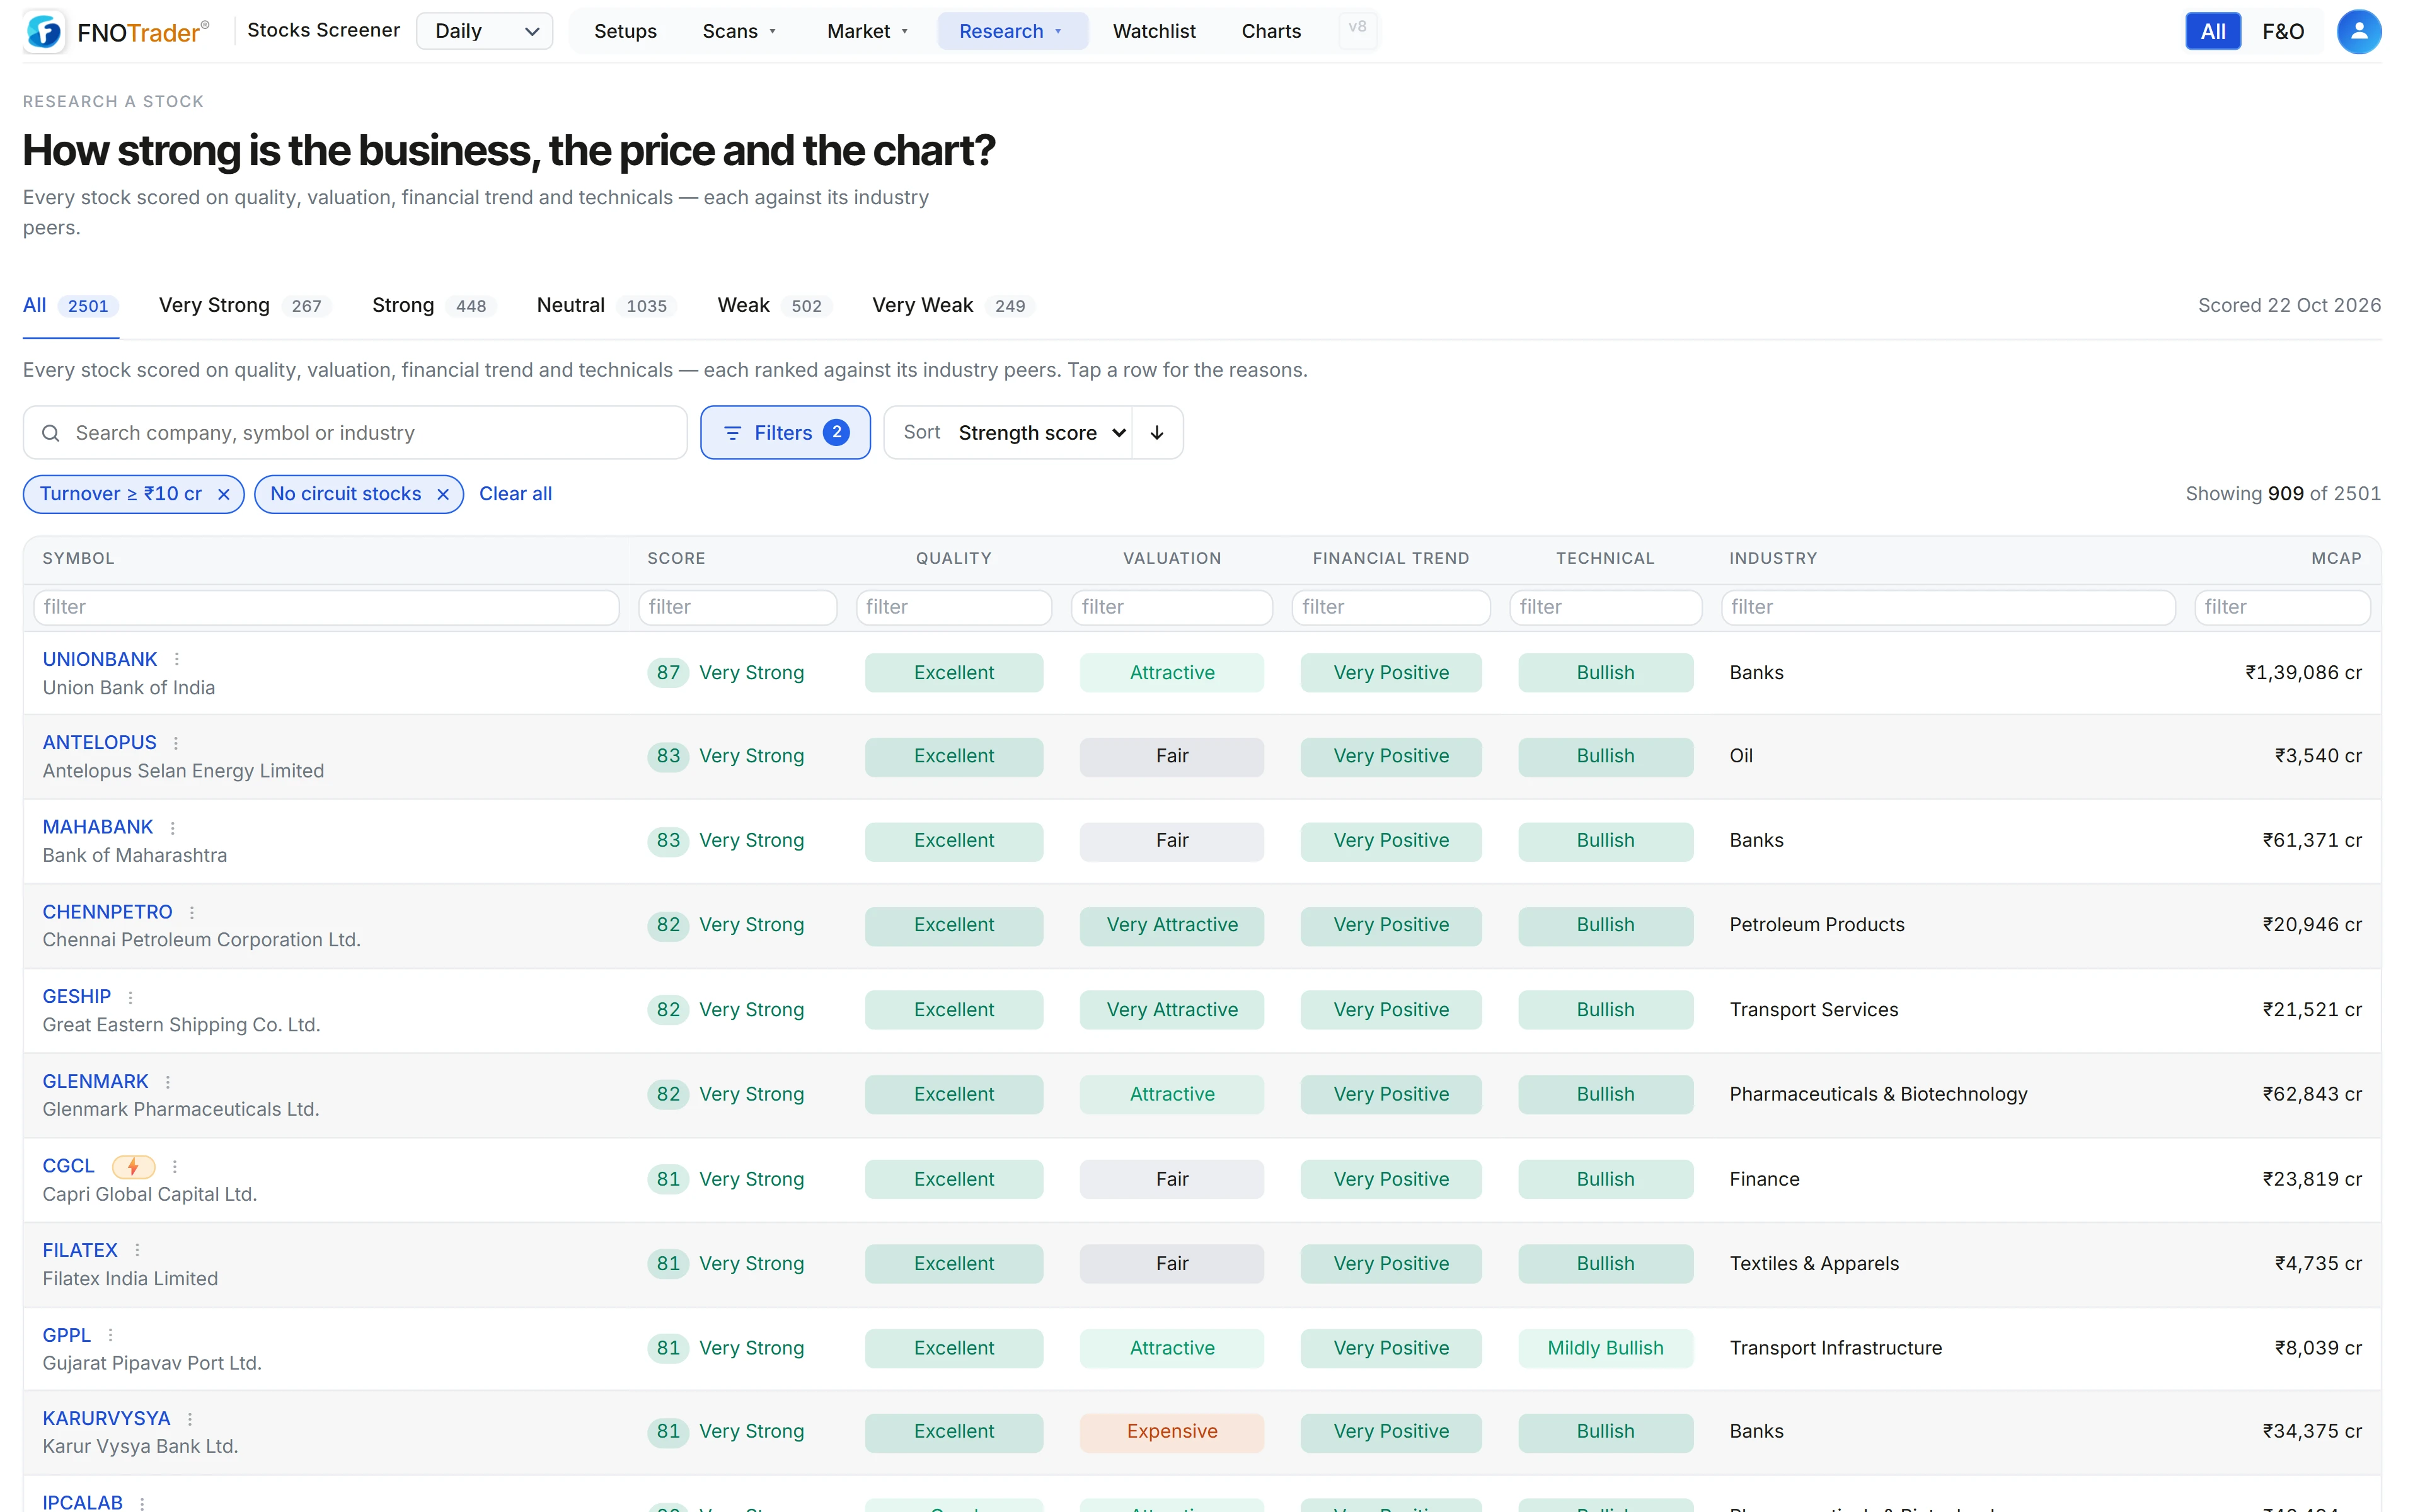
The four parameters
| Parameter (weight) | Inputs |
|---|---|
| Quality (30%) | Piotroski F-score (8 of its 9 tests), ROCE — or ROE for banks, NBFCs and insurers — ranked within peers, and debt/equity ranked within peers. |
| Valuation (20%) | Earnings yield, book yield and EV/EBITDA yield against peers, PEG (P/E ÷ 3-year profit growth), and P/E against the stock’s own 5-year median. |
| Financial trend (25%) | CANSLIM-style: latest-quarter sales and profit growth year on year, whether sales growth is accelerating, margin change, quarter-on-quarter sales, 3-year profit growth and the streak of rising quarters. |
| Technical (25%) | An IBD-style RS rating (3-month return weighted double, plus 6, 9 and 12 months), 12-minus-1-month momentum, the 8-rule trend template and closeness to the 52-week high. |
Each parameter is 0–100 with its own five-step label, and each comes with the reasons that produced it — for example “P/E 18.2 — cheaper than 70% of peers” or “Trend template 7/8”.
Who counts as a peer
Quality and valuation inputs are percentiles within the stock’s industry group. The group needs at least eight members with data; if it is smaller, the stock is compared with its sector, and failing that with the whole market. The technical inputs are ranked across the whole market, because relative strength is about the stock against everything else.
Loss-making companies have no meaningful P/E, so their valuation score is capped low and says so in the reasons.
The label cut-offs, and why they are fixed
| Score | Label |
|---|---|
| 70 and above | Very Strong |
| 62–69 | Strong |
| 45–61 | Neutral |
| 31–44 | Weak |
| Below 31 | Very Weak |
The cut-offs were set once so that roughly 10%, 20%, 40%, 20% and 10% of stocks fell in each band, and then frozen. That way a label means the same thing every day: if the whole market improves, more stocks become Strong, instead of the bands quietly shifting under you.
A worked example
Made-up parameter scores: Quality 70, Valuation 40, Financial trend 65, Technical 80.
Score = 0.30 × 70 + 0.20 × 40 + 0.25 × 65 + 0.25 × 80 = 21 + 8 + 16.25 + 20 = 65.25 → 65, Strong.
If the stock had less than six months of price history, there would be no technical score, and the average is taken over what is available: (21 + 8 + 16.25) ÷ 0.75 = 60.3 → 60, Neutral. Same business, different label — which is why the reasons are worth reading, not just the number.
Limits and common mistakes
- Peer-relative is not absolute. The cheapest stock in an expensive industry still scores well on valuation.
- Fundamentals move slowly, price moves fast. Most day-to-day changes in the score come from the technical part.
- One number hides trade-offs. A high-quality, expensive company and a cheap, improving one can land on the same score. Look at the four parts.
- Scores rebuild every evening after the close; intraday moves are not in them.
Where to find it
- Open the Stocks Scanner and choose Research → Strength scores.
- Filter by label tab or industry, sort by the score or any parameter, and search.
- Tap a row for the reasons, the nearest industry peers and up to 250 days of score history.
- The same score appears as a strength card on the Research Desk.
Common questions
How is the FNOTrader stock strength score calculated?
It is a weighted average of four 0–100 parameters: Quality 30%, Valuation 20%, Financial trend 25% and Technical 25%. Quality and valuation are ranked within the stock's industry peers; technicals are ranked across the market.
What does a Strong label mean?
A score of 62 to 69. The bands are fixed: 70+ Very Strong, 62–69 Strong, 45–61 Neutral, 31–44 Weak, below 31 Very Weak. It describes the stock's position, not an action.
What is the Piotroski F-score?
A set of nine pass/fail accounting tests of profitability, leverage and efficiency. The quality score uses the eight that the available data supports.
How often are strength scores updated?
Every evening after the close. Each stock's panel shows its daily score history for up to 250 days.
Why does my stock not have a technical score?
The technical part needs at least six months of daily prices. Without it the overall score is averaged over the other three parameters.
More on Stocks App
More in Stocks App · App: Stocks Scanner · Definitions: glossary · All: every article