What MTM is, and why record it
Mark-to-market is the value of your open book at the current price, compared with what you paid, plus anything booked today.
It changes every second the market is open, and almost no broker keeps a history of it. That history is what answers the useful questions: how deep was the worst drawdown, how many up days were there, and what did the curve do inside the day you remember as a loss.
How it is recorded
During NSE cash hours, 09:15–15:30 IST on weekdays, plus a few minutes after the close, the app records your account's total MTM every 20 seconds, across positions and holdings, for the accounts you are using. After 15:45 IST it writes a definitive day-close figure, once prices have settled, so each trading day has one clean number even if the app was not open at the close.
Reading the calendar
The MTM view shows a summary strip — Net P&L, Max drawdown, Latest day change, Trading days, and Up days with their share — above an equity curve of cumulative daily P&L and a month grid with one cell per day.
Click a day with data and its intraday curve opens: open, high, low, the day's change and total P&L, drawn from the 20-second record. It is the quickest way to see whether a red day was one bad entry at 09:20 or a slow bleed all afternoon.
Hypothetical: daily results of +₹4,000, −₹6,000, +₹1,500, −₹2,500 and +₹5,000 give a net of +₹2,000, three up days of five (60%), and a max drawdown of −₹7,000 — the fall from +₹4,000 after day one to −₹3,000 after day four.
The Funds tab: where the capital sits
Funds answers a different question: of the money in this account, how much is working?
| Bucket | What it is |
|---|---|
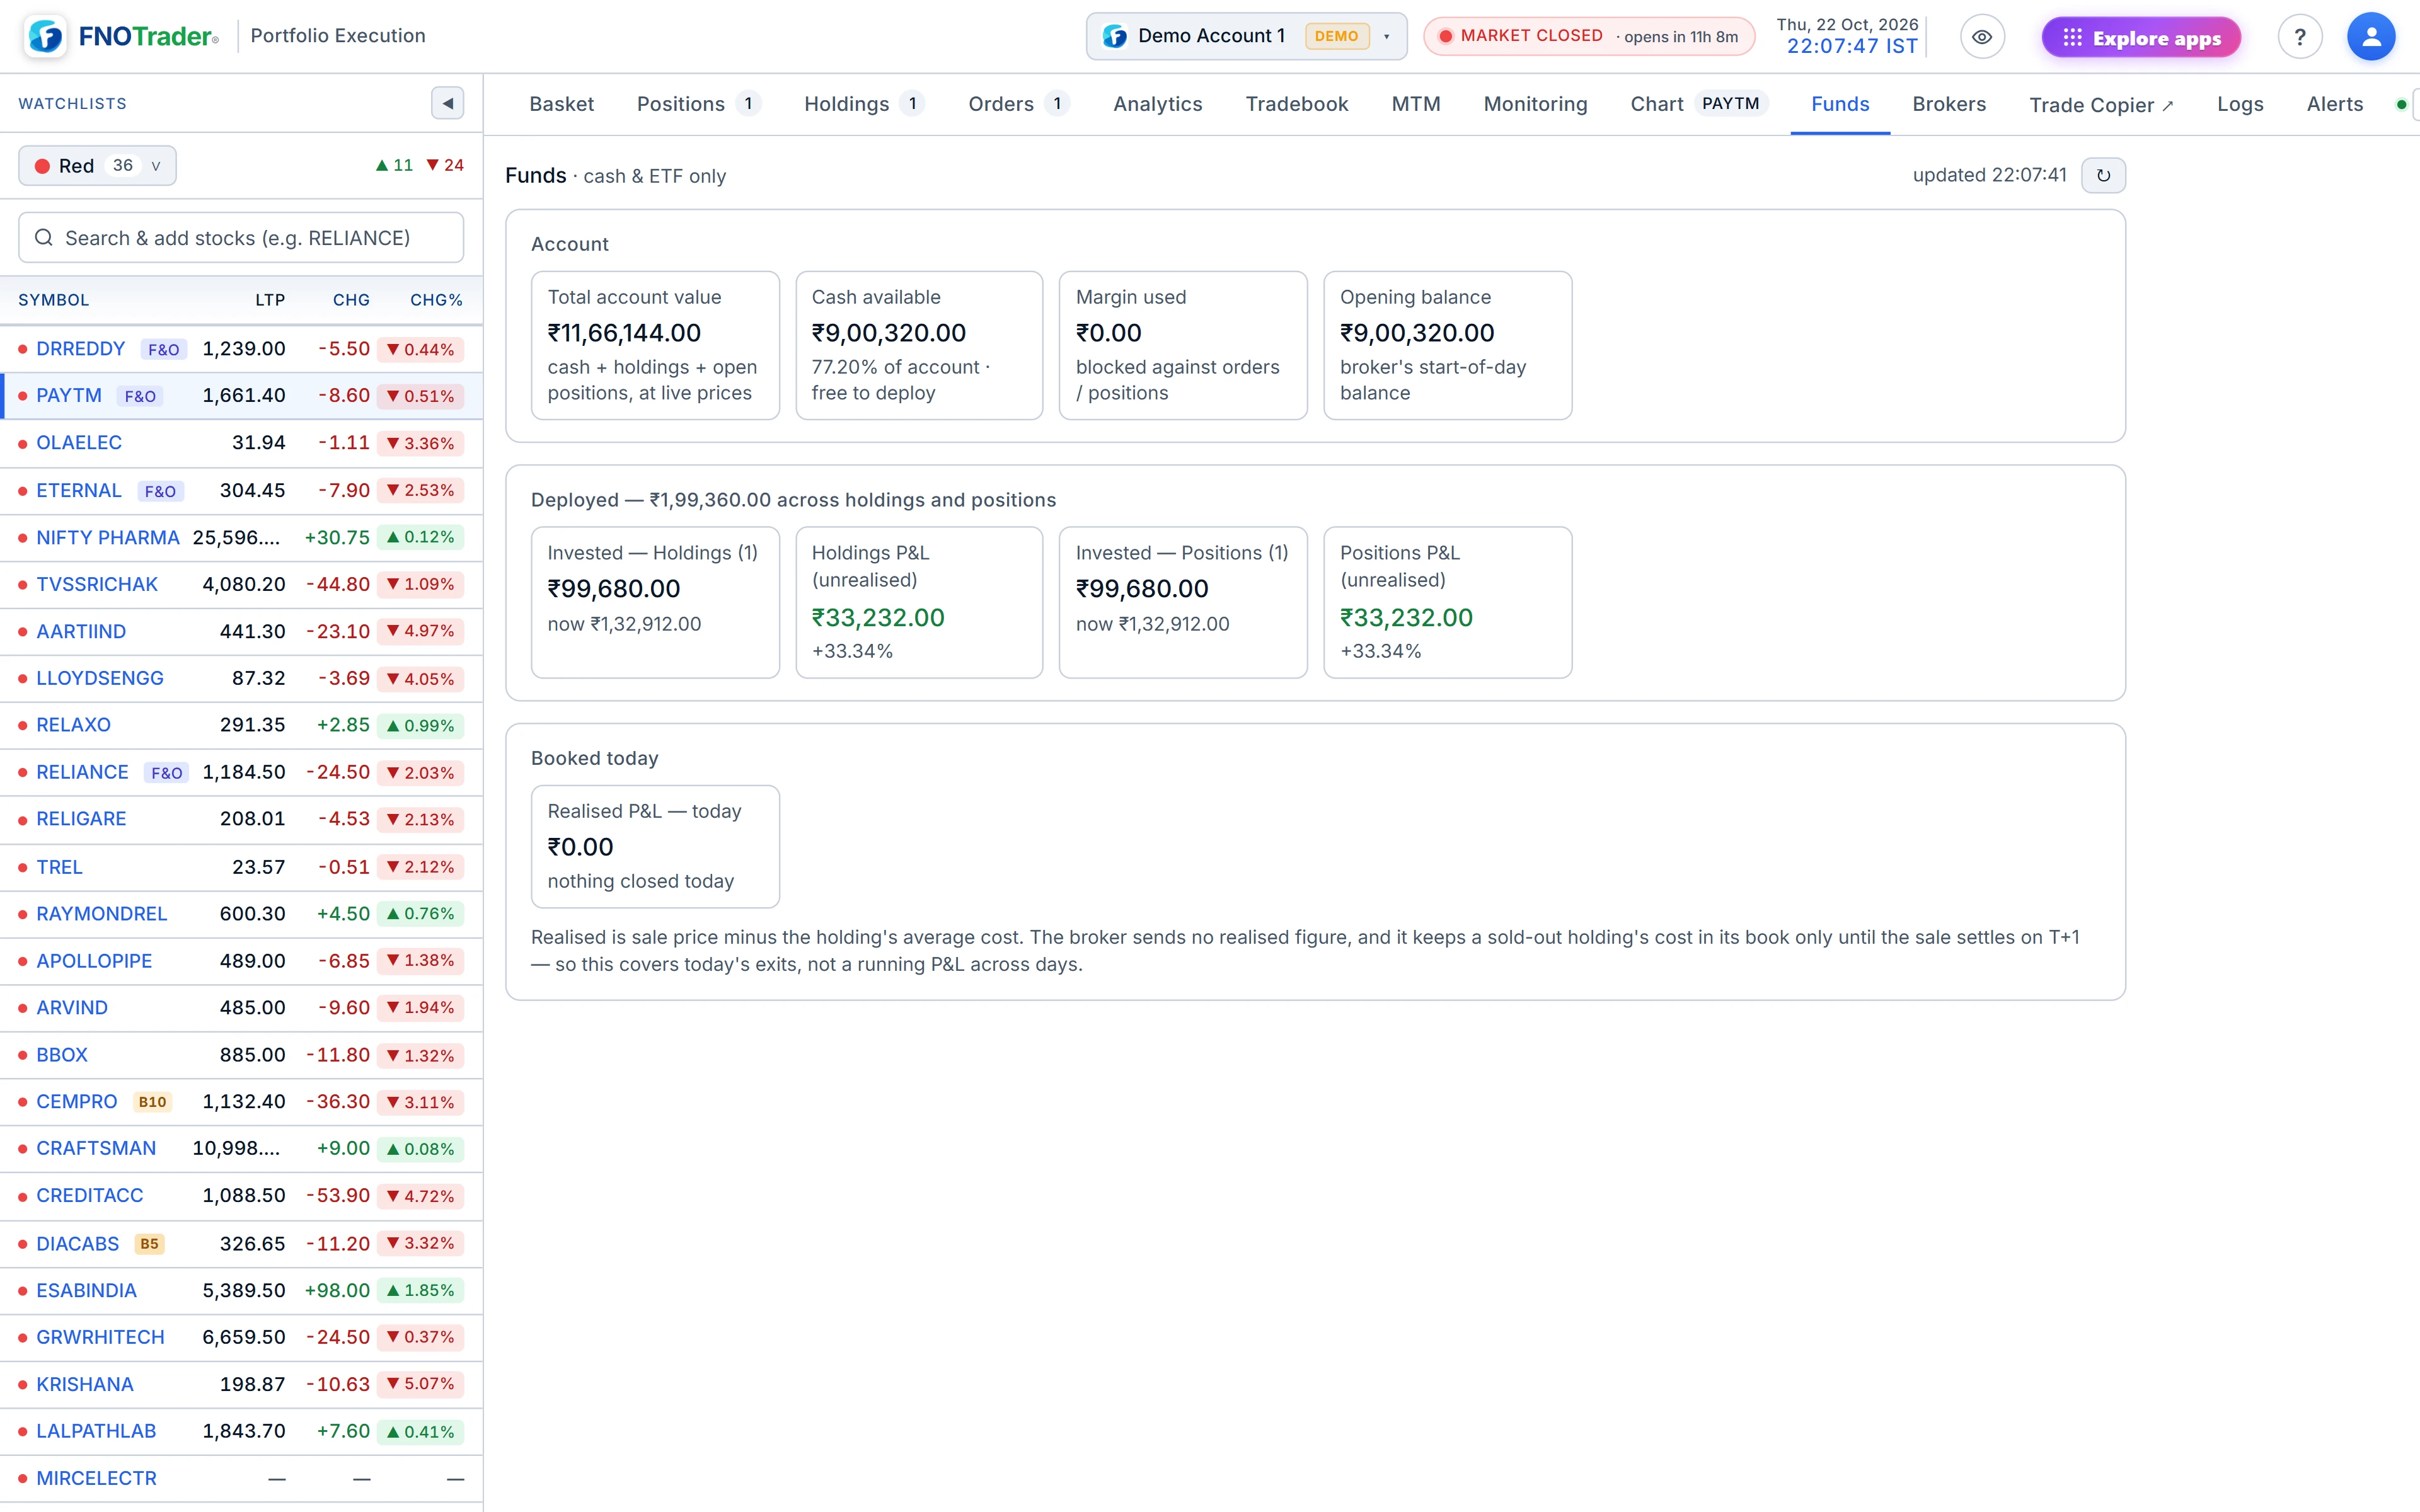
| A — Invested | Open positions and holdings at average cost. Holdings sold today are excluded; their proceeds are in C. |
| B — Available | Idle cash you can deploy on a new order. |
| C — T+1 settlement | Proceeds of today's delivery sales, locked until they settle. |
| Total | A + B + C — the full footprint of the account. |
For broker accounts the view also shows total account value at live prices, margin used, the opening balance, invested amounts and unrealised P&L split between holdings and positions, and a booked today table: each sale's quantity, cost, sale price and realised P&L. A delivery sale of shares you already held is shown as booked P&L — sale price minus the holding's average cost — not as an open short, because cash delivery cannot be short-sold. Where the broker no longer reports the cost, the row says so instead of guessing.
The Available tile also carries the capital committed by pending order-alerts, explained in price alerts.
Return on what?
A percentage return depends entirely on the denominator. The Holdings strip shows ROIC = P&L ÷ invested — how the money actually deployed is doing. Positions shows two figures for the open book: ROIC, unrealised P&L over deployed capital, and ROI, the same P&L over total trading capital (available plus used margin). One tells you how the trades are doing, the other how much they move the whole account.
Hypothetical: ₹20,000 of P&L on ₹4 lakh invested is 5% ROIC. If the account also holds ₹6 lakh idle, the same ₹20,000 is 2% ROI on the ₹10 lakh total. Both are true; they answer different questions.
Limits
- MTM is recorded only from the time you start using the app on an account; earlier days are blank.
- A 20-second record can miss a spike that lasted a few seconds; the intraday high and low are of the samples.
- Booked-today P&L covers today's exits only — the broker drops a sold holding's cost after settlement.
Where to find it
- In Portfolio Execution, open the MTM tab (on a phone: Account → MTM Calendar).
- Click any day with data for its intraday curve.
- Open Funds for the capital split and today's booked P&L.
For trade-level performance, see analytics and the tradebook.
Common questions
How often does the app record MTM?
Every 20 seconds during market hours, 09:15 to 15:30 IST on weekdays, with a day-close figure written after 15:45 IST.
Can I see my P&L curve for a past day?
Yes. Click the day in the MTM calendar to open its intraday curve, built from the 20-second record.
What is T+1 settlement in the Funds tab?
The proceeds of today's delivery sales. They are locked until the trade settles the next working day, so they are shown separately from available cash.
What is ROIC in the Holdings tab?
Return on invested capital: P&L divided by the amount invested in those holdings, at average cost.
More on Portfolio Execution
More in Portfolio Execution · App: Portfolio Execution · Definitions: glossary · All: every article