What realised volatility is
Realised volatility (RV) is the annualised standard deviation of the underlying’s daily returns over a window. Vol Lab annualises with √252 and computes it over 10, 20, 30 and 60 sessions, from daily bars of the underlying.
It is the yardstick for implied vol: VRP elsewhere in Vol Lab is IV30 minus 20-day close-to-close RV. This page is where you check whether that yardstick is telling the whole story.
Four estimators, four views of the same days
| Estimator | Uses | Sees |
|---|---|---|
| Close-to-close | Close vs previous close | Everything that ends up in the close, including overnight gaps. The standard. |
| Parkinson | High − low of each day | The intraday range. Ignores gaps. |
| Garman-Klass | Open, high, low, close | Range plus the open-to-close move. Ignores gaps. |
| Yang-Zhang | Adds previous close to open | Range, open-to-close and the overnight gap. |
Range estimators use more of each day’s information, so they are steadier on short windows. But they miss the overnight gap. When close-to-close reads well above Parkinson and Garman-Klass, the stock is moving in gaps or trending in one direction across days.
Which one matters depends on how you hold. A position held overnight lives through the gaps, so close-to-close or Yang-Zhang is the fair comparison. An intraday-only trader lives in the range.
The panels
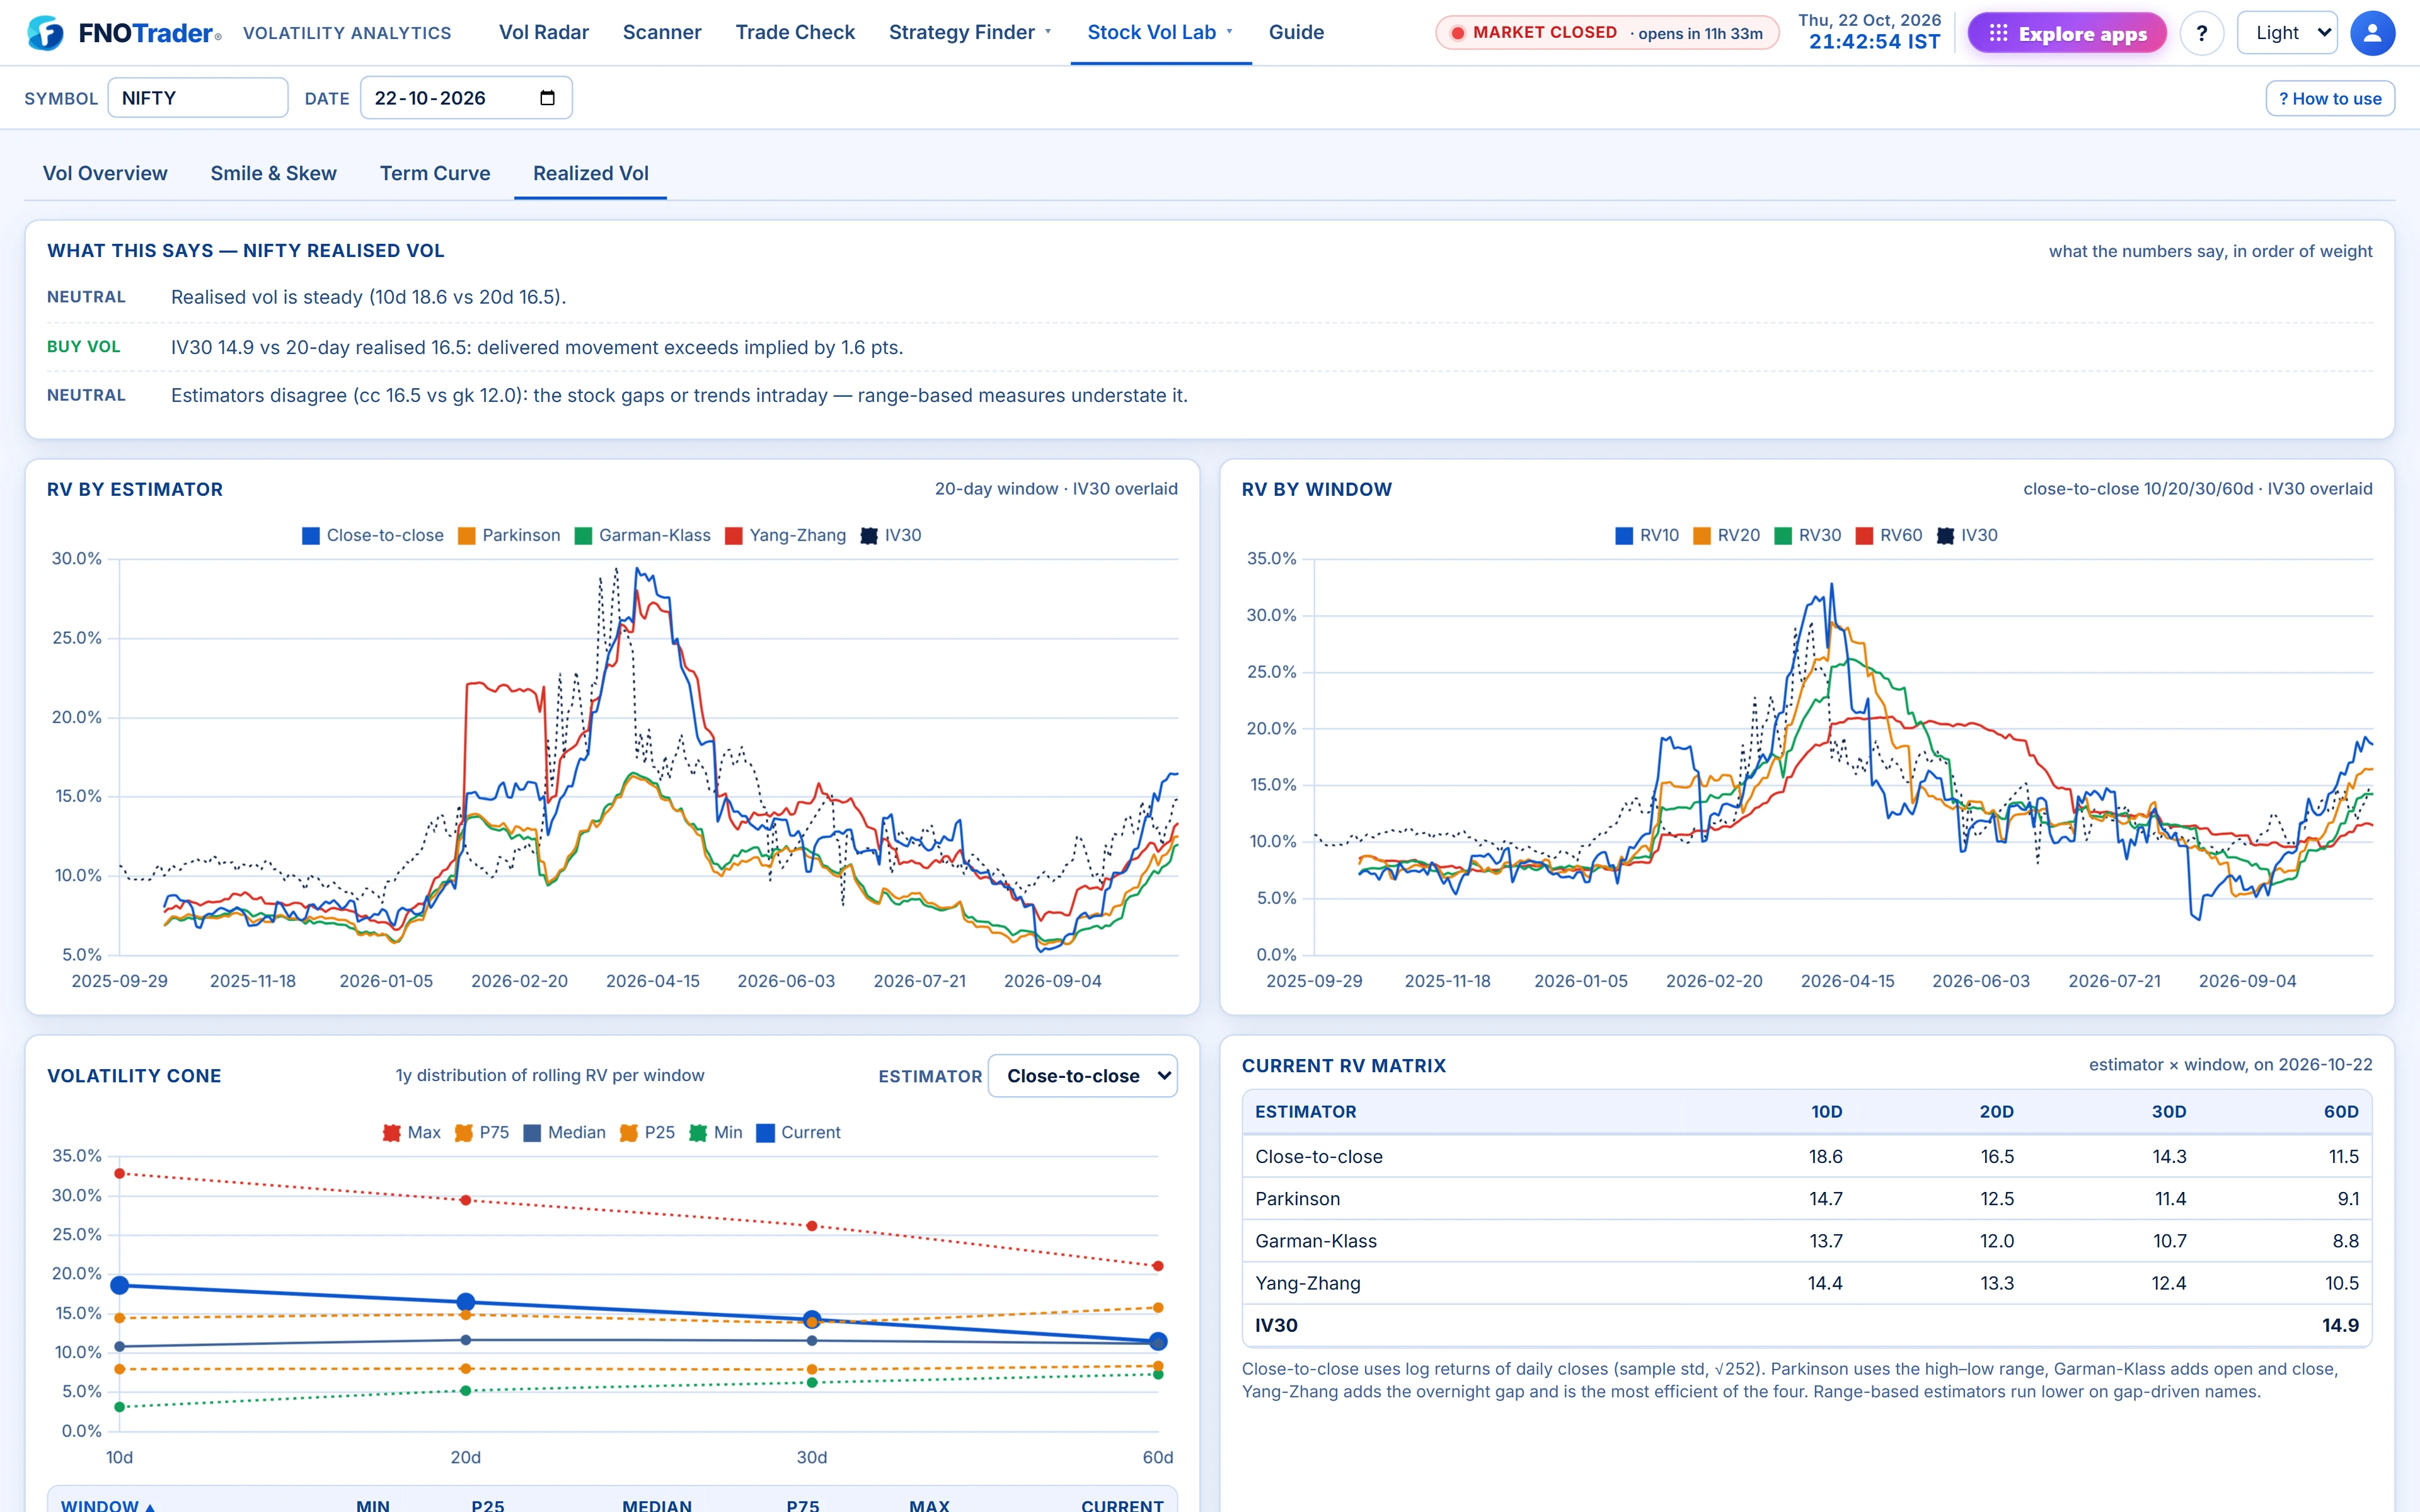
- RV by estimator (20-day) and RV by window (close-to-close 10/20/30/60), each with IV30 overlaid. When every RV line sits under IV30, sellers are being paid; when short windows spike above long ones, movement is accelerating.
- Volatility cone: for each window, the minimum, P25, median, P75 and maximum of rolling RV over the last year, with today’s value marked, for whichever estimator you choose.
- Current RV matrix: all four estimators × all four windows on the chosen date, with IV30 for reference.
Above the charts, a “What this says” card spells out what the numbers show: whether 10-day realised is 20% or more above or below 20-day (movement accelerating or fading), whether 20-day realised sits in the bottom or top fifth of its cone range, how IV30 compares with 20-day realised, and whether the estimators disagree by 25% or more.
Reading the cone: a worked example
Hypothetical cone for a stock, 20-day window: min 12, P25 16, median 19, P75 23, max 35. Current RV20 = 24. IV30 = 21.
- RV20 is above P75: the stock is moving more than on three-quarters of the year’s days.
- VRP = 21 − 24 = −3. Options are priced below the current movement.
- Now check the 10-day window. If RV10 is 28 the movement is still building; if it is 18 it is cooling, and RV20 will drift down as the busy days roll out of the window.
- Then check the estimators. If Parkinson reads 17, much of that 24 is overnight gaps.
The cone also prices options against history: IV above the cone’s P75 at the same horizon is expensive by any standard; IV near the cone’s minimum is cheap unless the stock is about to stay that quiet.
Common mistakes
- Comparing IV with one RV number and stopping. A positive VRP against Parkinson can be negative against close-to-close.
- Reading a 10-day RV as a trend. Ten observations are noisy; look at whether 10, 20 and 30 agree.
- Forgetting the window lag. One violent day stays in RV20 for 20 sessions, then drops out at once.
Where to find it
- Open Volatility Analytics › Stock Vol Lab › Realized Vol.
- Pick symbol and date; choose the estimator for the cone.
- Compare with IV on Vol Overview, where VRP is shown across all four windows and estimators.
Common questions
What is the difference between Parkinson and close-to-close volatility?
Close-to-close uses daily closing prices and captures overnight gaps. Parkinson uses each day's high-low range, which is steadier but ignores gaps.
Which realised volatility estimator should I compare with IV?
For positions held overnight, close-to-close or Yang-Zhang, because both include the overnight gap. Range estimators suit intraday holding.
What is a volatility cone?
For each window, the minimum, 25th percentile, median, 75th percentile and maximum of rolling realised vol over the past year, with today's value marked.
How is realised volatility annualised?
By the square root of 252 trading days. Vol Lab computes it over 10, 20, 30 and 60 sessions.
Why do realised volatility estimators disagree on the same stock?
Each uses different prices from the day. A stock that gaps overnight or trends across days shows higher close-to-close vol than range-based Parkinson or Garman-Klass, which only see the intraday high, low, open and close.
More on Volatility Analytics
More in Volatility Analytics · App: Volatility Analytics · Definitions: glossary · All: every article