The question it answers
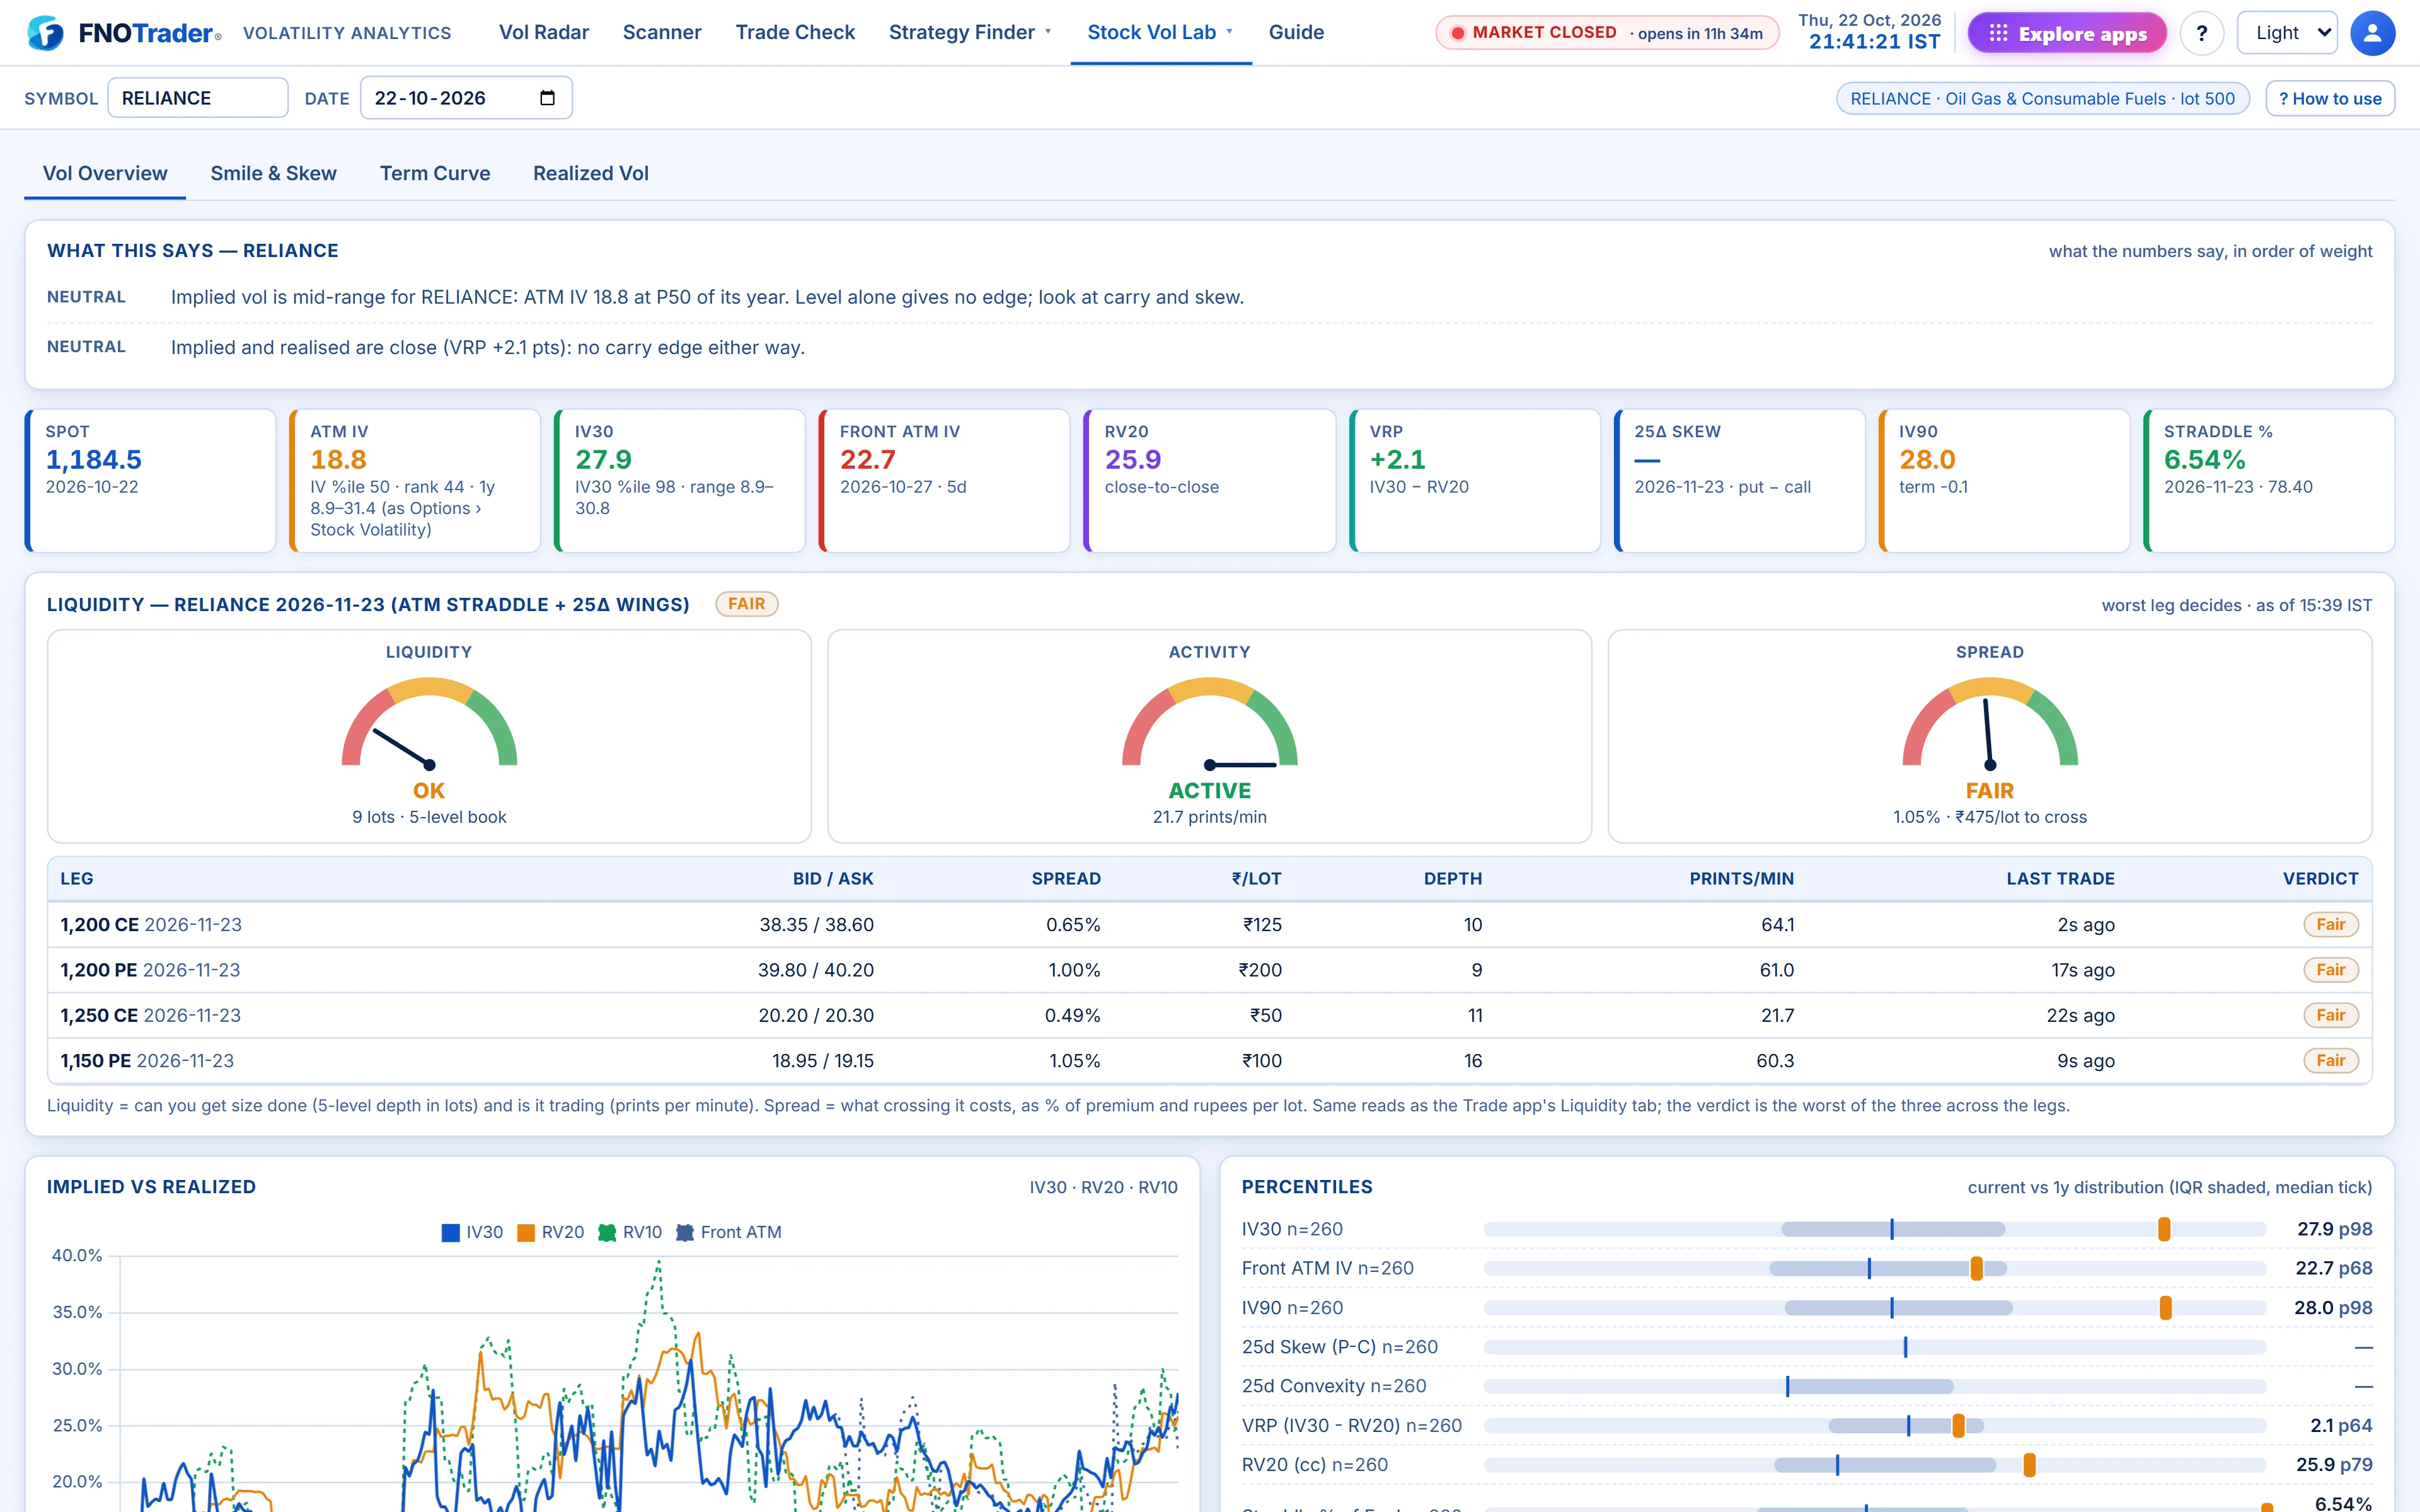
Vol Overview is the first of four Stock Vol Lab pages for a single name. It answers one question: is volatility high or low here, and is the premium robust? The other pages ask which strikes (Smile & Term) and what the stock has actually done (Realized Vol).
The tiles
| Tile | Meaning |
|---|---|
| IV30 + percentile | 30-day constant-maturity ATM IV, with its percentile and 1-year range. |
| Front ATM IV | ATM IV of the nearest expiry, with its DTE. |
| RV20 | 20-day close-to-close realised vol. |
| VRP | IV30 − RV20 in vol points. |
| 25Δ skew | 25Δ put IV − 25Δ call IV. |
| IV90, slope | 90-day IV and IV30 − IV90. |
| Straddle % of forward | ATM call + put of the primary expiry (nearest with 7+ days), divided by its forward. |
A separate ATM IV tile carries the IV %ile and IV Rank exactly as the Options app’s Stock Volatility page computes them, with the one-year low and high. Above the tiles, a short “What this says” card leads with the conclusion in plain words.
Further down, a liquidity card grades the primary expiry’s ATM call and put plus its 25Δ wings from the live book. For each leg it lists bid and ask, spread, rupees per lot to cross, five-level depth in lots, prints per minute and time since the last trade; the worst leg sets the grade. Read it during market hours — the evening book is the last one sent and looks thinner than it was.
Implied vs realised, and the percentiles panel
The implied vs realised chart plots IV30 over RV20 and RV10. Implied above realised for weeks is a paying carry; realised crossing above implied is the regime change a premium seller fears. The dotted front ATM line jumps at expiry rolls; IV30 is the smoothed version.
The percentiles panel places each measure — IV30, front ATM IV, IV90, skew, convexity, straddle % of forward, VRP and RV20 — on its own one-year distribution (the shaded box is the middle half, the tick is the median). Whatever sits at an edge is the headline.
VRP by lookback and by estimator
This is the panel that most often changes a read. VRP is shown four ways by lookback — IV30 minus close-to-close RV over 10, 20, 30 and 60 days — and four ways by estimator at 20 days: close-to-close, Parkinson, Garman-Klass and Yang-Zhang.
If the premium is positive against only one window or one estimator, it is not robust. Positive across all eight is a durable carry.
Hypothetical example: IV30 18%. RV over 10/20/30/60 days: 14, 15, 16, 21. VRP: +4, +3, +2, −3. The last month was quiet, but the 60-day window says the stock can move more than 18% is pricing. The carry is recent, not structural.
The expiries table
Every listed expiry with its forward and how the forward was derived (same-expiry future, carry-adjusted future, spot, and whether put-call parity refined it), ATM IV, 25Δ put and call IV, skew, convexity, straddle and put-call OI ratio. “n/a” for ATM IV means the chain was too thin to trust that expiry.
Read across the rows for the shape: a front expiry with much higher ATM IV and straddle than the next usually has an event inside it.
Common mistakes
- Using IV30 for a weekly trade. With a 7-day front and a 35-day monthly, IV30 is mostly the monthly. Use front ATM IV for the weekly.
- Calling high IV “rich” without VRP. High IV with negative VRP means the stock is really moving.
- Ignoring the sample. Percentiles are against the loaded history and need five sessions.
Where to find it
- Open Volatility Analytics › Stock Vol Lab › Vol Overview.
- Type the symbol in the top bar and pick a date.
- Or click any name on Vol Radar to land here.
Common questions
What is VRP in options?
Volatility risk premium: implied volatility minus realised volatility. Vol Lab uses IV30 minus 20-day close-to-close realised vol, in vol points.
Why show VRP against several lookbacks and estimators?
A premium that is positive against only one window or one estimator can vanish on a different yardstick. Consistent positive VRP across all of them is more robust.
What does straddle % of forward tell me?
The cost of the primary expiry's ATM straddle as a share of the forward: roughly the move the market is charging for to that expiry. Its percentile compares it with the name's own year.
Why does the front ATM IV line jump?
When the nearest expiry rolls off, the front contract changes. IV30 is interpolated to a constant 30 days and does not jump.
Is IV percentile the same as IV rank?
No. Percentile is the share of the last 252 sessions with a lower ATM IV; rank is where today sits between the one-year low and high. Percentile is steadier because a single spike distorts rank for months.
More on Volatility Analytics
More in Volatility Analytics · App: Volatility Analytics · Definitions: glossary · All: every article