Two cuts through the surface
The surface has two directions. Across strikes within one expiry it is the smile; across expiries at the money it is the term curve. Both pages compare today with earlier sessions, because a change is usually more informative than a level.
For how the strikes are filtered and the wings interpolated, see how the surface is built.
Smile & Skew: the panels
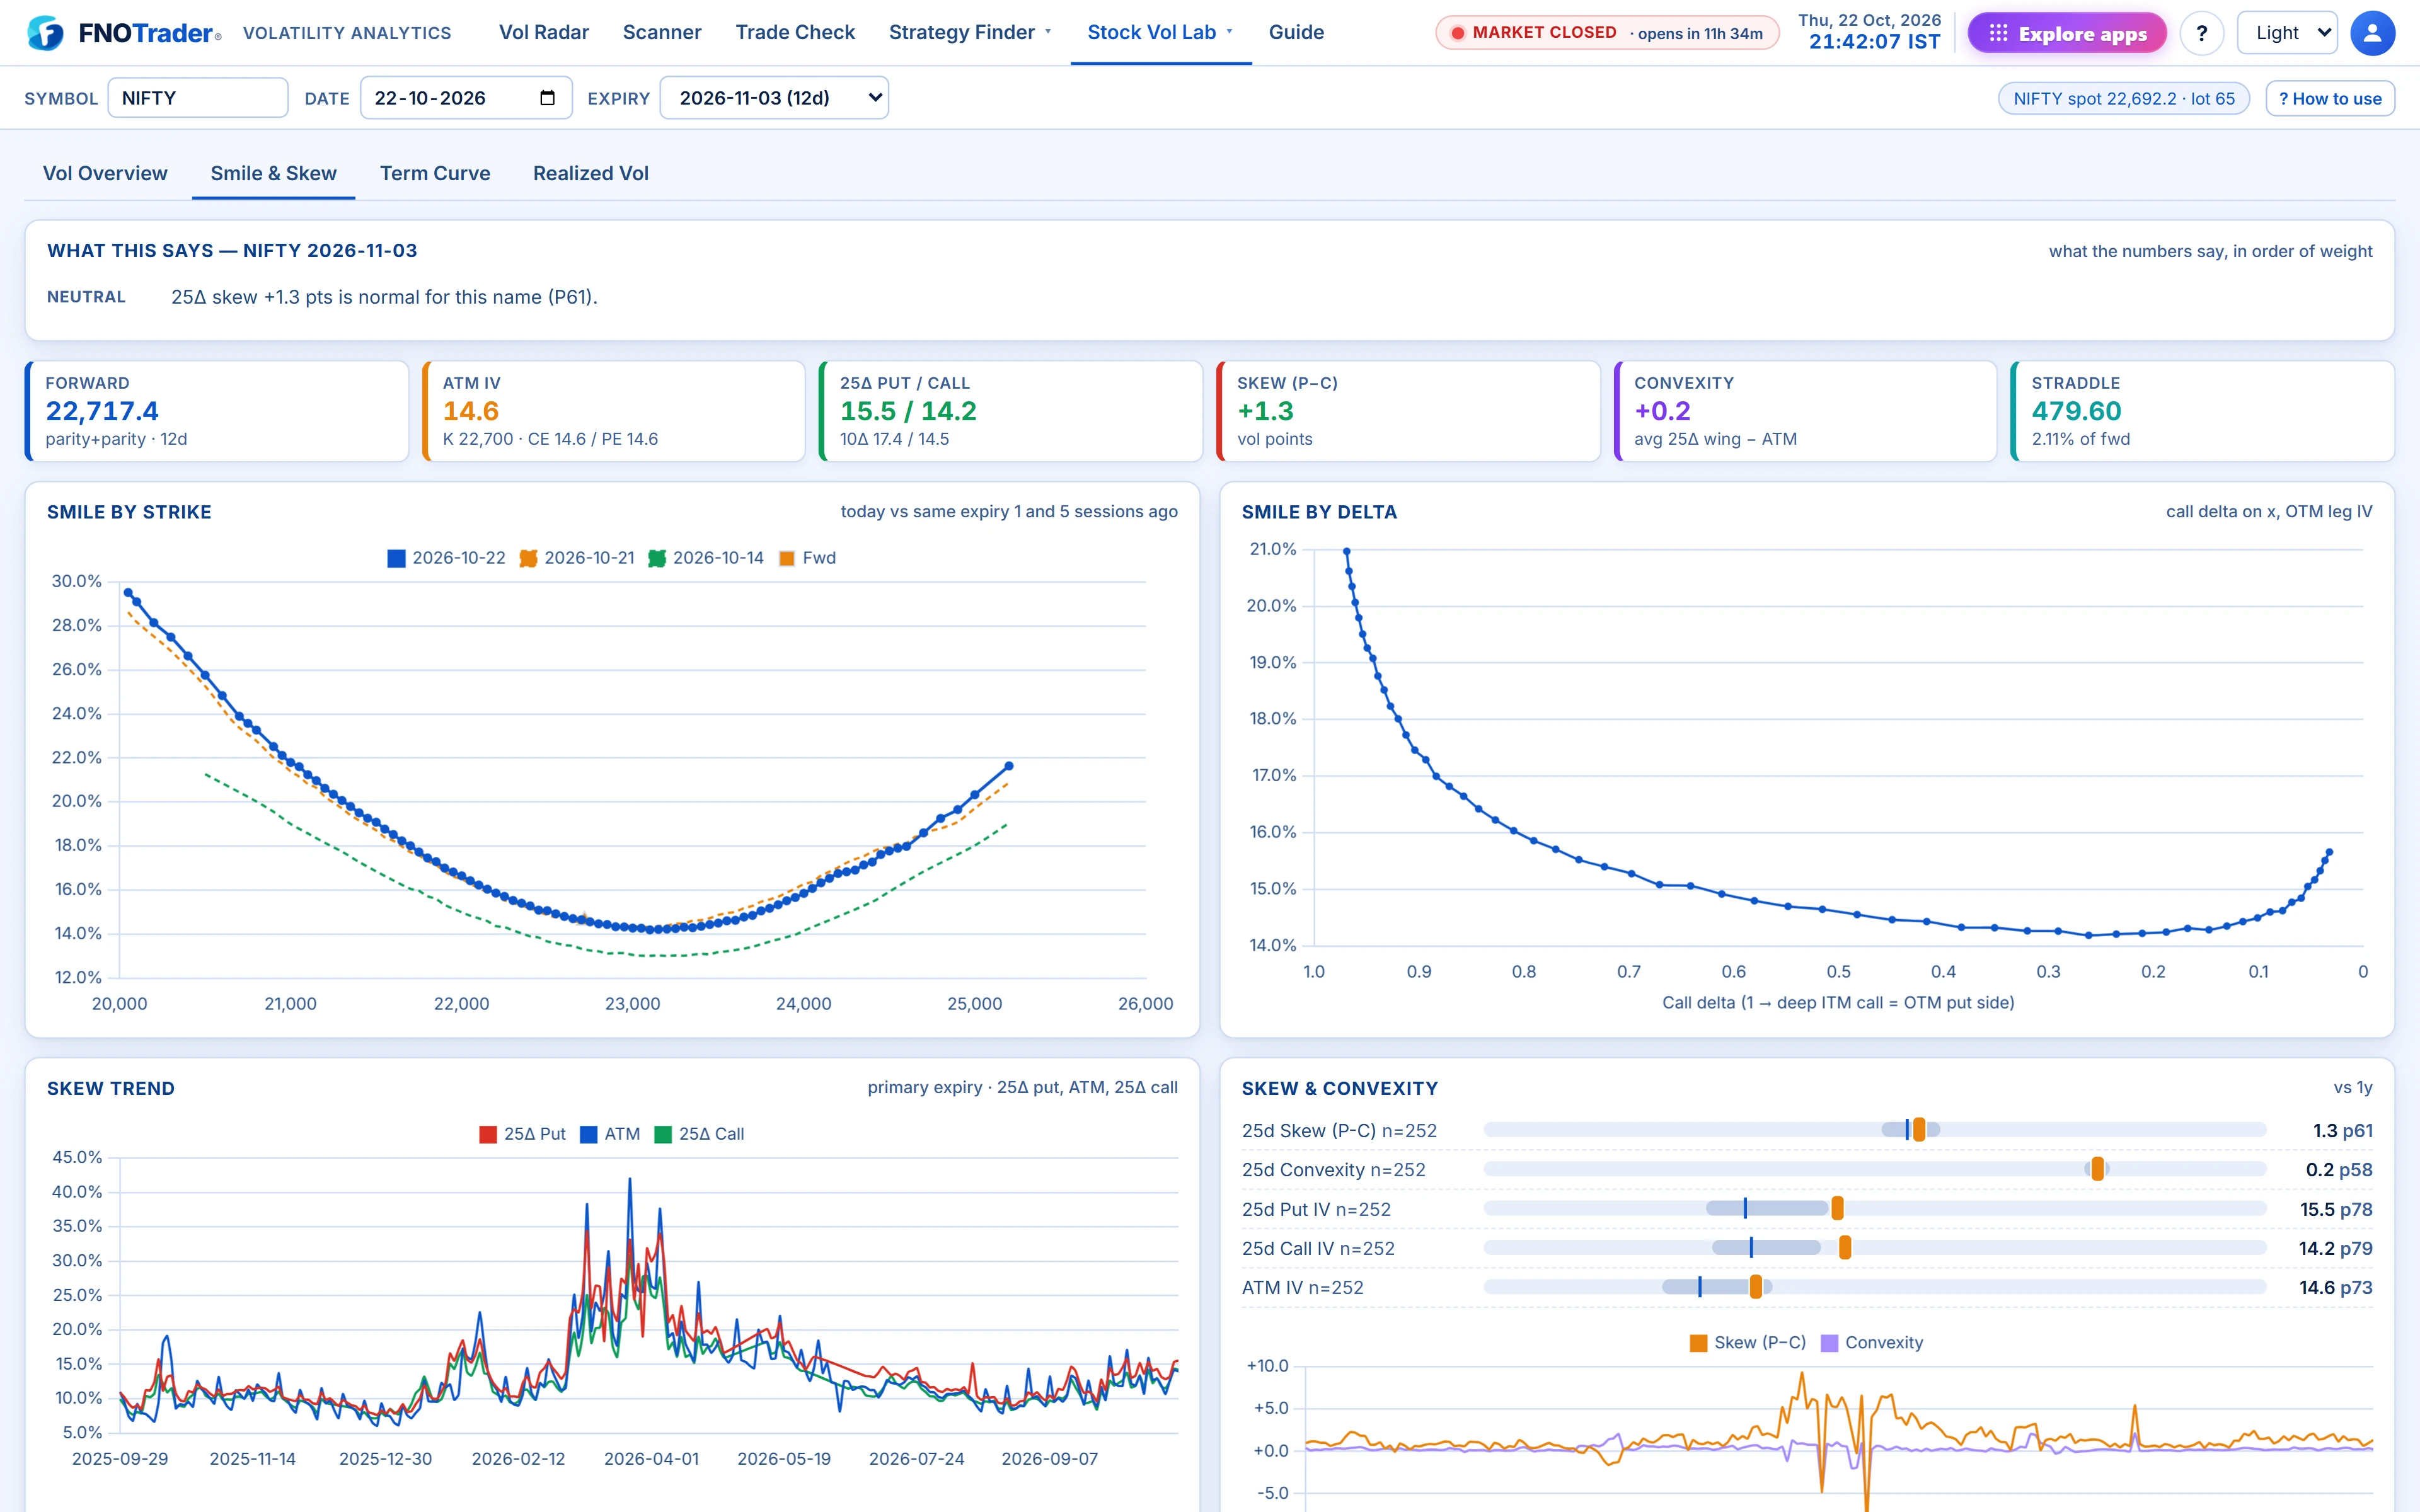
- Smile by strike: the chosen expiry’s IV curve today against the same expiry one and five sessions ago, with the forward marked. A curve that lifted on one side only shows where the demand came from.
- Smile by delta: the same curve on a delta axis (OTM puts left, OTM calls right), which is how names of very different price are compared.
- Skew trend: 25Δ put, ATM and 25Δ call IV over the year, with skew and convexity below and percentiles for skew, convexity, both wings and ATM.
- Fixed-strike IV history: pick a strike and type to see that one contract’s IV day by day over 30, 60 (default) or 120 sessions. This is what you hold once you own it, and it separates “vol moved” from “spot moved through the strike”.
- Strikes table: prices, per-leg IV, OI in lots and IV relative to ATM. Dashes mean the strike failed the quality gates.
Reading a skew change
Hypothetical: yesterday a stock’s 25Δ put was 22, ATM 20, 25Δ call 19. Today: put 26, ATM 21, call 19. Skew went from +3 to +7 points; convexity from (22+19)/2 − 20 = +0.5 to (26+19)/2 − 21 = +1.5.
The body barely moved and the call was flat: someone bought downside. Before selling those puts because they are “rich”, find out why they were bid. Skew that is high while ATM is mid-range is a wing-specific situation, best expressed with structures that sell one wing and buy another rather than with a straddle.
Term Curve: the panels
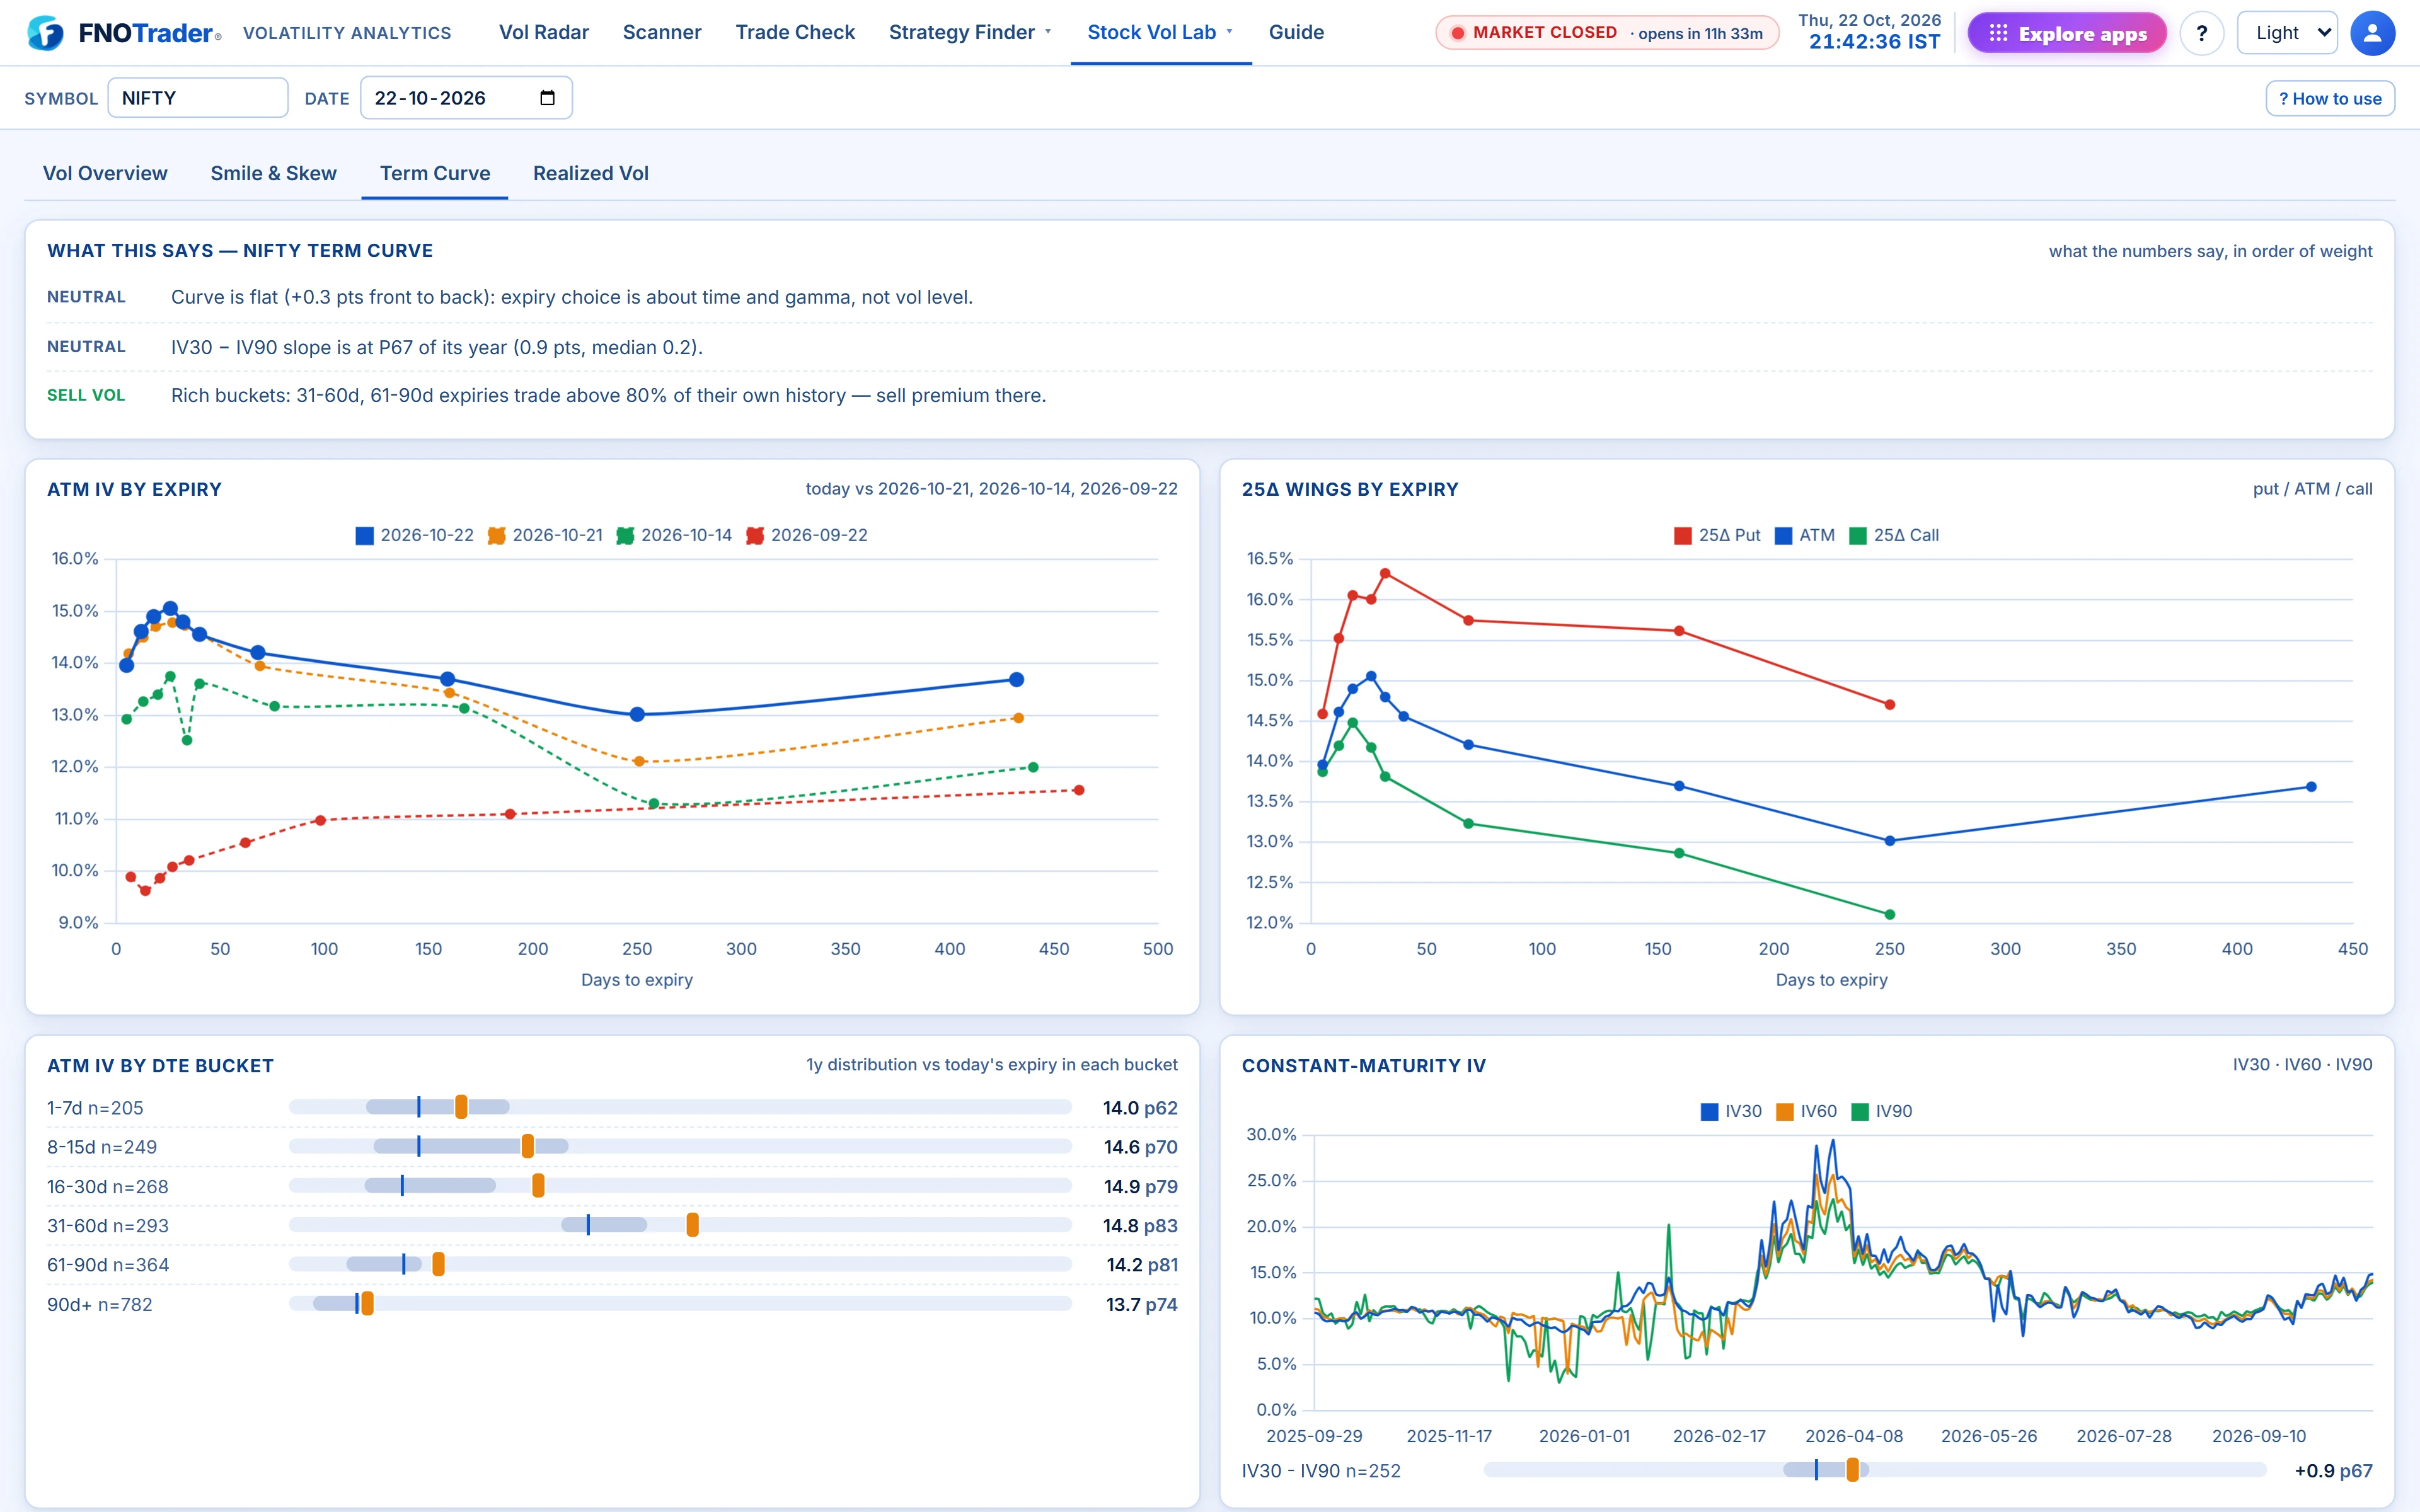
- ATM IV by expiry on a DTE axis, today against 1, 5 and 20 sessions ago. A normal curve rises gently with maturity; a front expiry above the back means an event sits inside it.
- 25Δ wings by expiry: whether skew is concentrated in one expiry (event-driven) or spread across the curve (structural).
- ATM IV by DTE bucket: one-year distributions for 1–7, 8–15, 16–30, 31–60, 61–90 and 90+ days, with today’s expiry marked. A 12-day expiry is judged against past 8–15-day expiries, not against the monthly.
- Constant maturity: IV30, IV60 and IV90 through the year, and the distribution of the IV30 − IV90 slope.
Reading the slope
Hypothetical: IV30 19, IV90 16, slope +3, at the 95th percentile of the name’s year. The front is unusually inverted. Selling a calendar (short front, long back) into that is the classic use; the risk is that the event is bigger than priced. A very steep normal slope is the mirror case.
The DTE-bucket panel stops a common error: comparing a weekly’s IV with last month’s monthly and calling it high. Short-dated IV is naturally more volatile; judge it against its own bucket.
Common mistakes
- Calling a wing rich because it is above ATM. Puts above calls is normal for indices; what matters is the skew percentile against the name’s own year.
- Mistaking a spot move for a vol move. When spot falls toward a put strike, that strike’s IV rises along the smile even if the smile itself did not shift. Fixed-strike history and the 1- and 5-session overlays separate the two.
- Reading skew on a thin chain. If the 25Δ strikes failed the quality gates, skew shows a dash; a skew built from one surviving strike on each side deserves less weight than one from a full chain.
- Comparing expiries on raw IV across a roll. The overlays are matched by expiry date, so a five-session-ago curve is the same contract, five days longer.
Where to find it
- Open Volatility Analytics › Stock Vol Lab.
- Choose Smile & Skew or Term Curve from the menu; pick symbol and date in the top bar.
- On Smile & Skew, pick the expiry and, for fixed-strike history, a strike and CE/PE.
- Price the structure that fits the read in Trade Check.
Common questions
What is the difference between smile by strike and smile by delta?
The same IV curve on two axes. By strike shows where in price the IV sits; by delta puts names of different price on one scale, which is how wings are compared.
What is fixed-strike IV?
The implied volatility of one specific contract day by day. It shows whether a position's value changed because volatility moved or because spot moved relative to the strike.
What does an inverted term structure mean?
Near-dated IV above longer-dated IV. It usually means a known event, such as results or a policy date, falls inside the near expiry.
Why compare ATM IV by DTE bucket?
Short-dated IV is naturally more volatile than long-dated. Comparing a 12-day expiry with past 8-15 day expiries avoids calling it high just because it is short.
What is a good use of the IV30 minus IV90 slope?
Comparing it with its own one-year distribution. An unusually inverted slope usually prices a near-term event; an unusually steep normal slope means the back months carry the premium.
More on Volatility Analytics
More in Volatility Analytics · App: Volatility Analytics · Definitions: glossary · All: every article