What it does
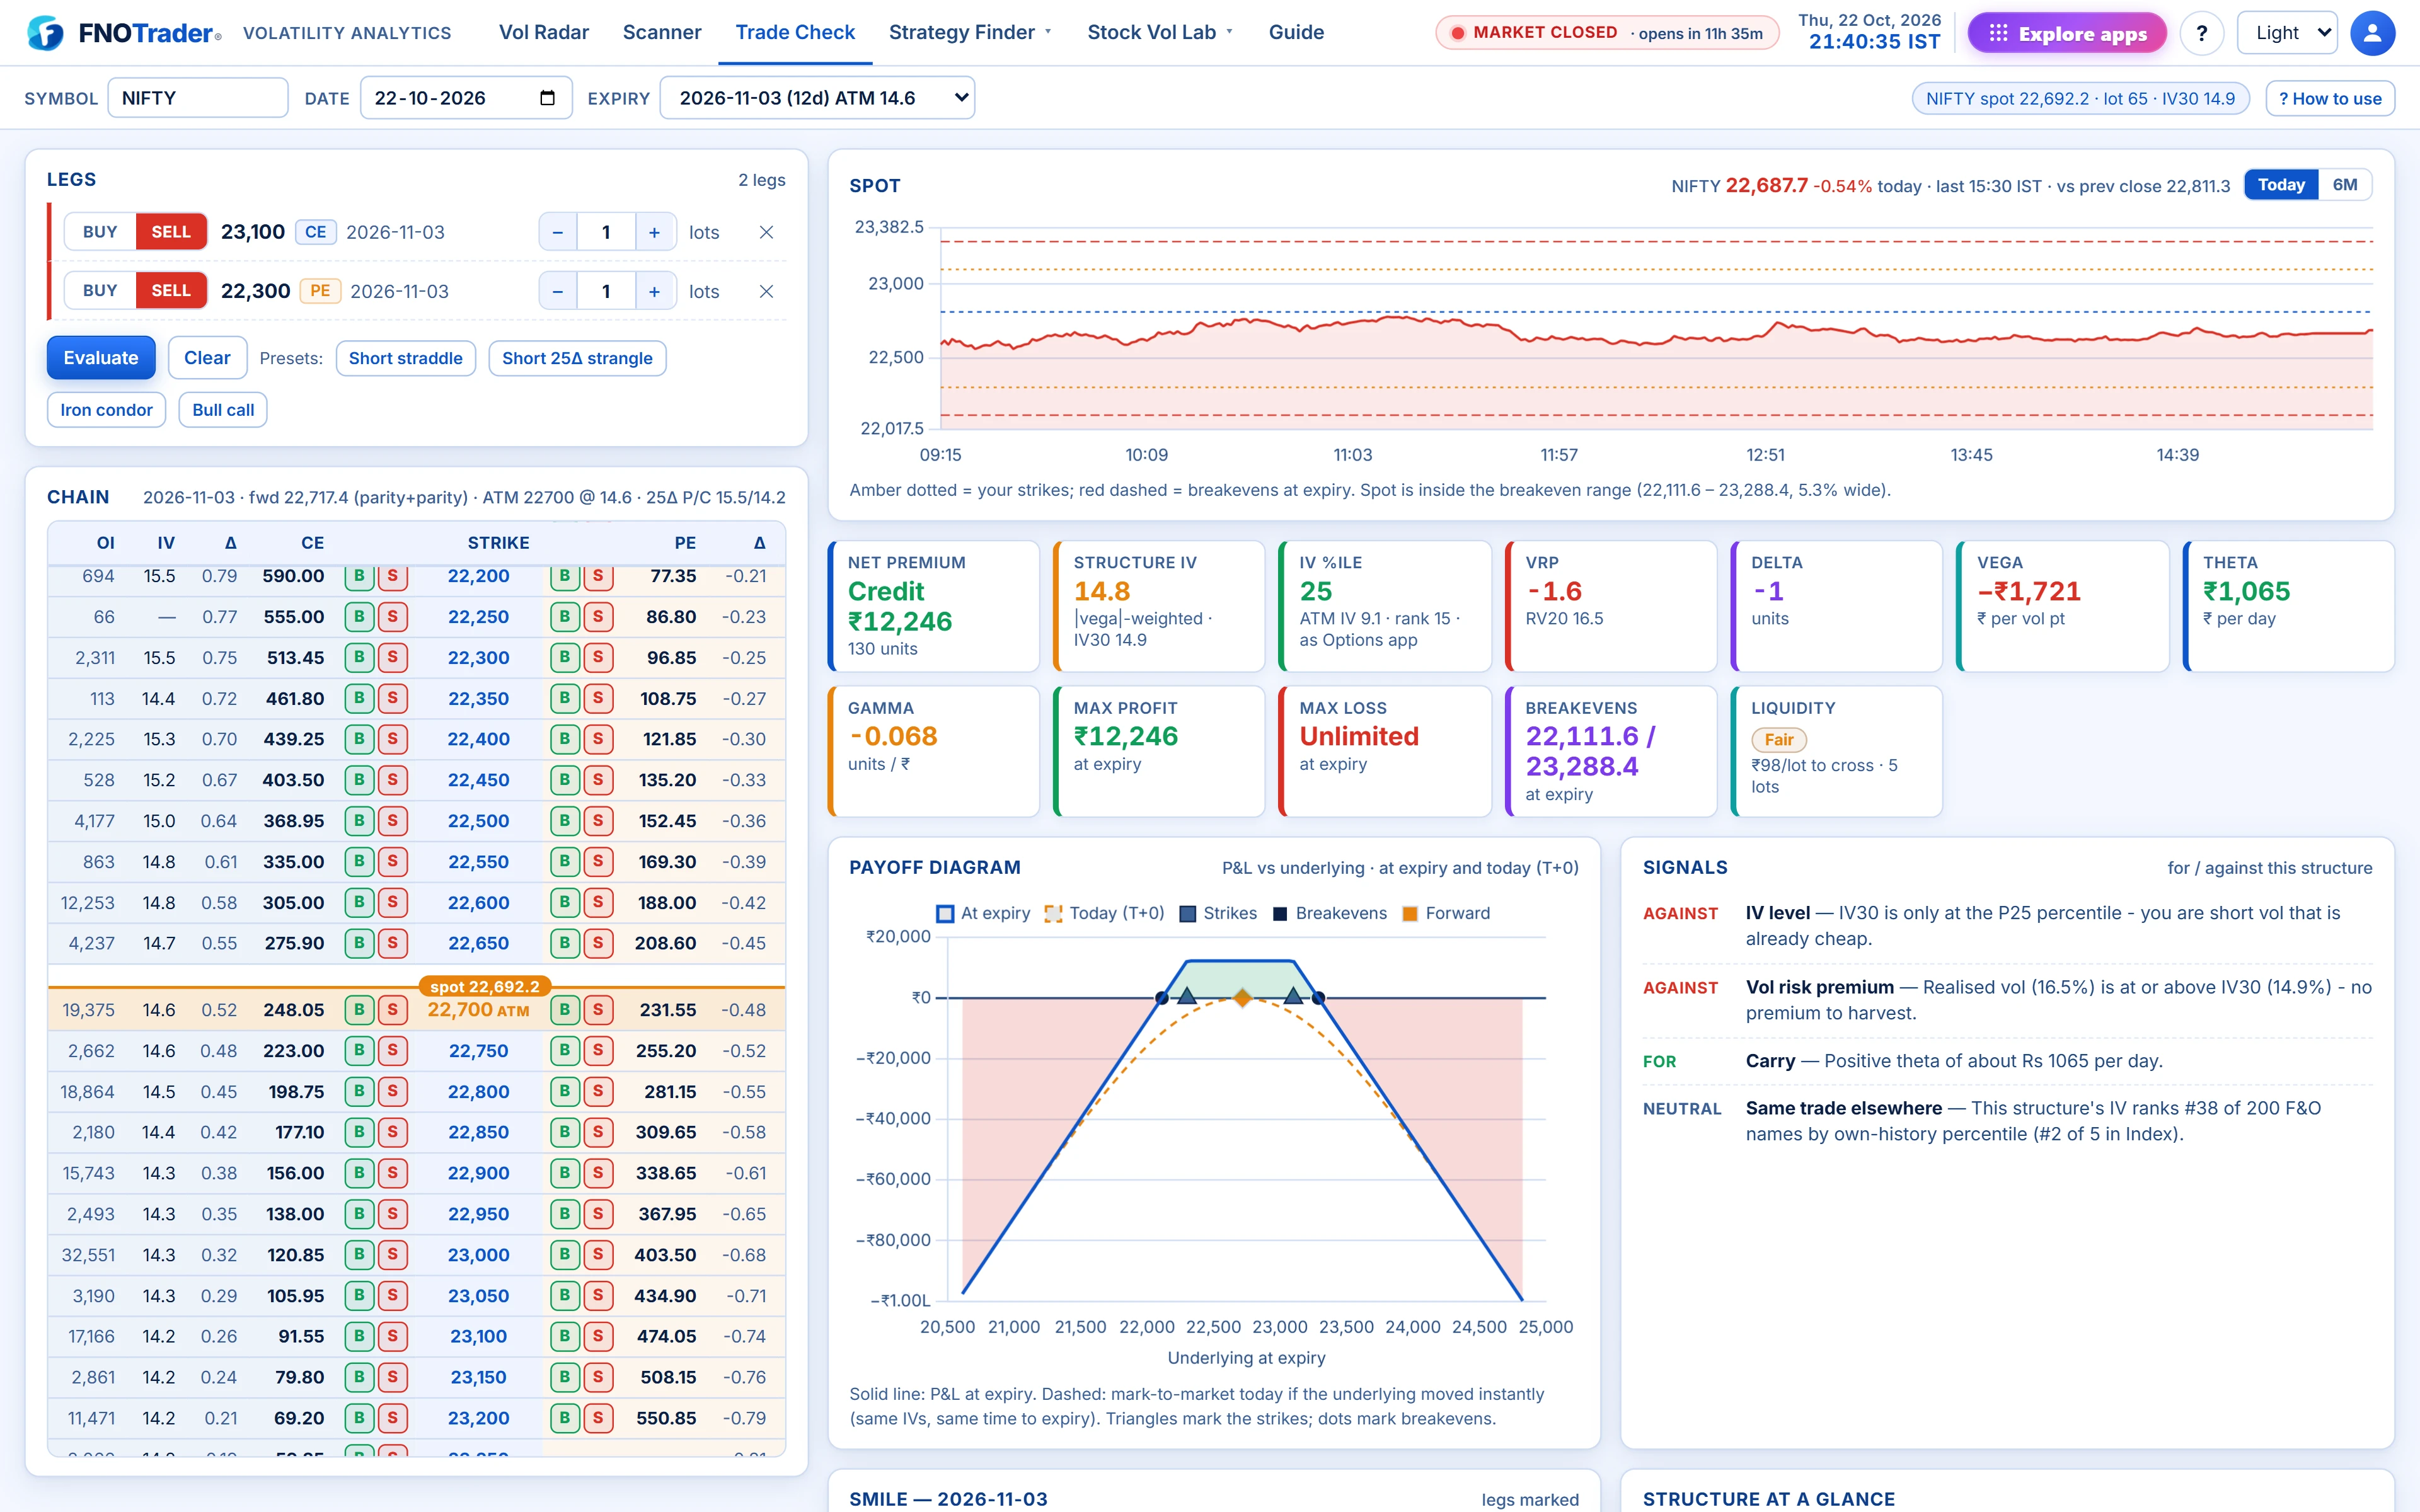
Trade Check takes a set of option legs on one underlying, prices them off the same surface the rest of Vol Lab uses, and shows the trade’s volatility context alongside its payoff. It works in real lots, not a notional.
It is a pricing and risk view. It does not place orders.
Building the trade
- Pick the symbol and date in the top bar and an expiry from the dropdown (each shows its DTE and ATM IV).
- In the chain, click B or S beside a call or put to add a leg, then set side and lots in the Legs panel. Legs may come from different expiries, so calendars and diagonals are allowed.
- Presets fill common shapes in one click and evaluate immediately: Short straddle, Short 25Δ strangle, Iron condor (25Δ short, 10Δ long wings) and Bull call (buy ATM, sell 25Δ).
- The chain shows each strike’s OTM-leg IV, call delta and open interest in lots. A strike with a price but no IV failed the quality gates and should be treated as untradeable.
Reading the result
| Block | What it tells you |
|---|---|
| Net premium | Debit or credit in rupees for the lots chosen. |
| Structure IV | The vega-weighted average IV of the legs — the single vol level you are effectively buying or selling. |
| IV %ile, VRP | Whether that vol is high for the name, and whether implied is above realised. |
| Greeks in ₹ | Delta, gamma, vega per vol point, theta per calendar day. |
| Signals | For / against notes: IV level vs your vega sign, carry, put skew vs net puts sold, short gamma with 5 days or fewer left, open interest under 5× your size, liquidity, and the elsewhere rank. |
| Leg pricing | Each leg’s IV vs its expiry’s ATM, its percentile against the name’s IV30 history, and a wing percentile (put skew for downside puts, convexity for upside calls). |
| Smile | The expiry’s IV curve with bought legs in green, sold legs in red. |
Signals are checks against the numbers, not a recommendation. A sold leg at a high wing percentile is the leg that is paying you; a sold leg low on the smile is not.
The risk grid and IV-percentile scenarios
The T+0 grid re-prices every leg with time held constant. Rows are relative IV shifts of −20%, −10%, 0, +10% and +20% (a 15% IV becomes 13.5% or 16.5% at ±10%); columns are forward moves of −5%, −3%, −2%, −1%, 0, +1%, +2%, +3% and +5%. The last row is the P&L at expiry.
The IV-percentile scenarios scale every leg’s IV so that IV30 sits at its own P10, P25, P50, P75 and P90 levels for the name. This answers “what if vol goes back to normal?” directly. It needs at least ten sessions of IV30 history.
The same trade elsewhere rebuilds your structure — same days to expiry, same delta per leg — on every F&O name and ranks them by how high that structure’s IV sits against each name’s own history. Your name is highlighted with its overall and sector rank.
A worked example
Hypothetical: a short strangle on a stock, lot size 500. Sell the 25Δ call at ₹6.00 (IV 28%) and the 25Δ put at ₹7.20 (IV 31%), one lot each.
- Credit = (6.00 + 7.20) × 500 = ₹6,600.
- Suppose vega is Suppose vega is ₹-410 per vol pointminus;₹410 per vol point. At the +10% row, IV rises about 3 points, so the mark loses roughly ₹1,200 before any spot move — the grid shows it exactly.
- Leg pricing shows the put 2 points above ATM at a skew percentile of 88: the put is the leg doing the paying.
- If the elsewhere table ranks this name 40th of 200, the same strangle is relatively richer on 39 other names. That does not make it wrong here, but it is worth knowing.
Limits worth knowing
- Prices are the surface’s sampled prices; real fills depend on the book. Check the liquidity block (worst leg, spread, depth, rupees per lot to cross).
- The T+0 grid holds time constant and shifts all IVs by the same proportion; real skew can move differently by strike.
- Max profit and loss are at expiry and read “Unlimited” where the structure is open on one side.
To choose between a straddle and a strangle in the first place, see straddle vs strangle.
Where to find it
- Open Volatility Analytics › Trade Check.
- Pick symbol, date and expiry; add legs with B / S or a preset.
- From Strategy Finder, click a row and “Open in Trade Check” to load the same legs.
Common questions
Can Trade Check price calendar and diagonal spreads?
Yes. Legs can come from different expiries; each is priced off its own expiry's forward and IV.
What is structure IV?
The vega-weighted average implied volatility of the legs: the one vol level the whole trade is effectively long or short.
What does the T+0 risk grid show?
Mark-to-market P&L today for relative IV shifts of -20% to +20% and forward moves of -5% to +5%, with time held constant, plus a row of P&L at expiry.
What is the same trade elsewhere table?
Your structure rebuilt with the same days to expiry and leg deltas on every F&O name, ranked by how high its IV sits against each name's own history.
Is Trade Check in lots or notional?
Real lots. Strategy Finder uses a rupee notional so names compare; Trade Check uses the lot size of the contract.
More on Volatility Analytics
More in Volatility Analytics · App: Volatility Analytics · Definitions: glossary · All: every article