Intervals: what is available
The interval menu lists only what the data can actually serve, grouped as seconds, minutes, hours and days.
| Group | Built in | Custom |
|---|---|---|
| Seconds | 1, 5, 10, 15, 30, 45 s | Any count up to 3,599 s |
| Minutes | 1, 2, 3, 5, 10, 15, 20, 30 m | Any count up to 1,440 m |
| Hours | 1, 2, 4 h | Any count up to 24 h |
| Days | D, W, M | — |
Seconds charts go back 7 days, because they are built from raw ticks that are kept for a week. Minute and hour charts take any count, so a 7-minute or 75-minute chart is built directly rather than approximated. Monthly bars are calendar months in IST, matching the exchange’s own calendar.
Star the intervals you use and they appear as quick buttons; the default stars are 1m, 3m, 5m, 15m, 30m, 1h, D and W. Custom intervals and stars are remembered in your browser.
Chart types
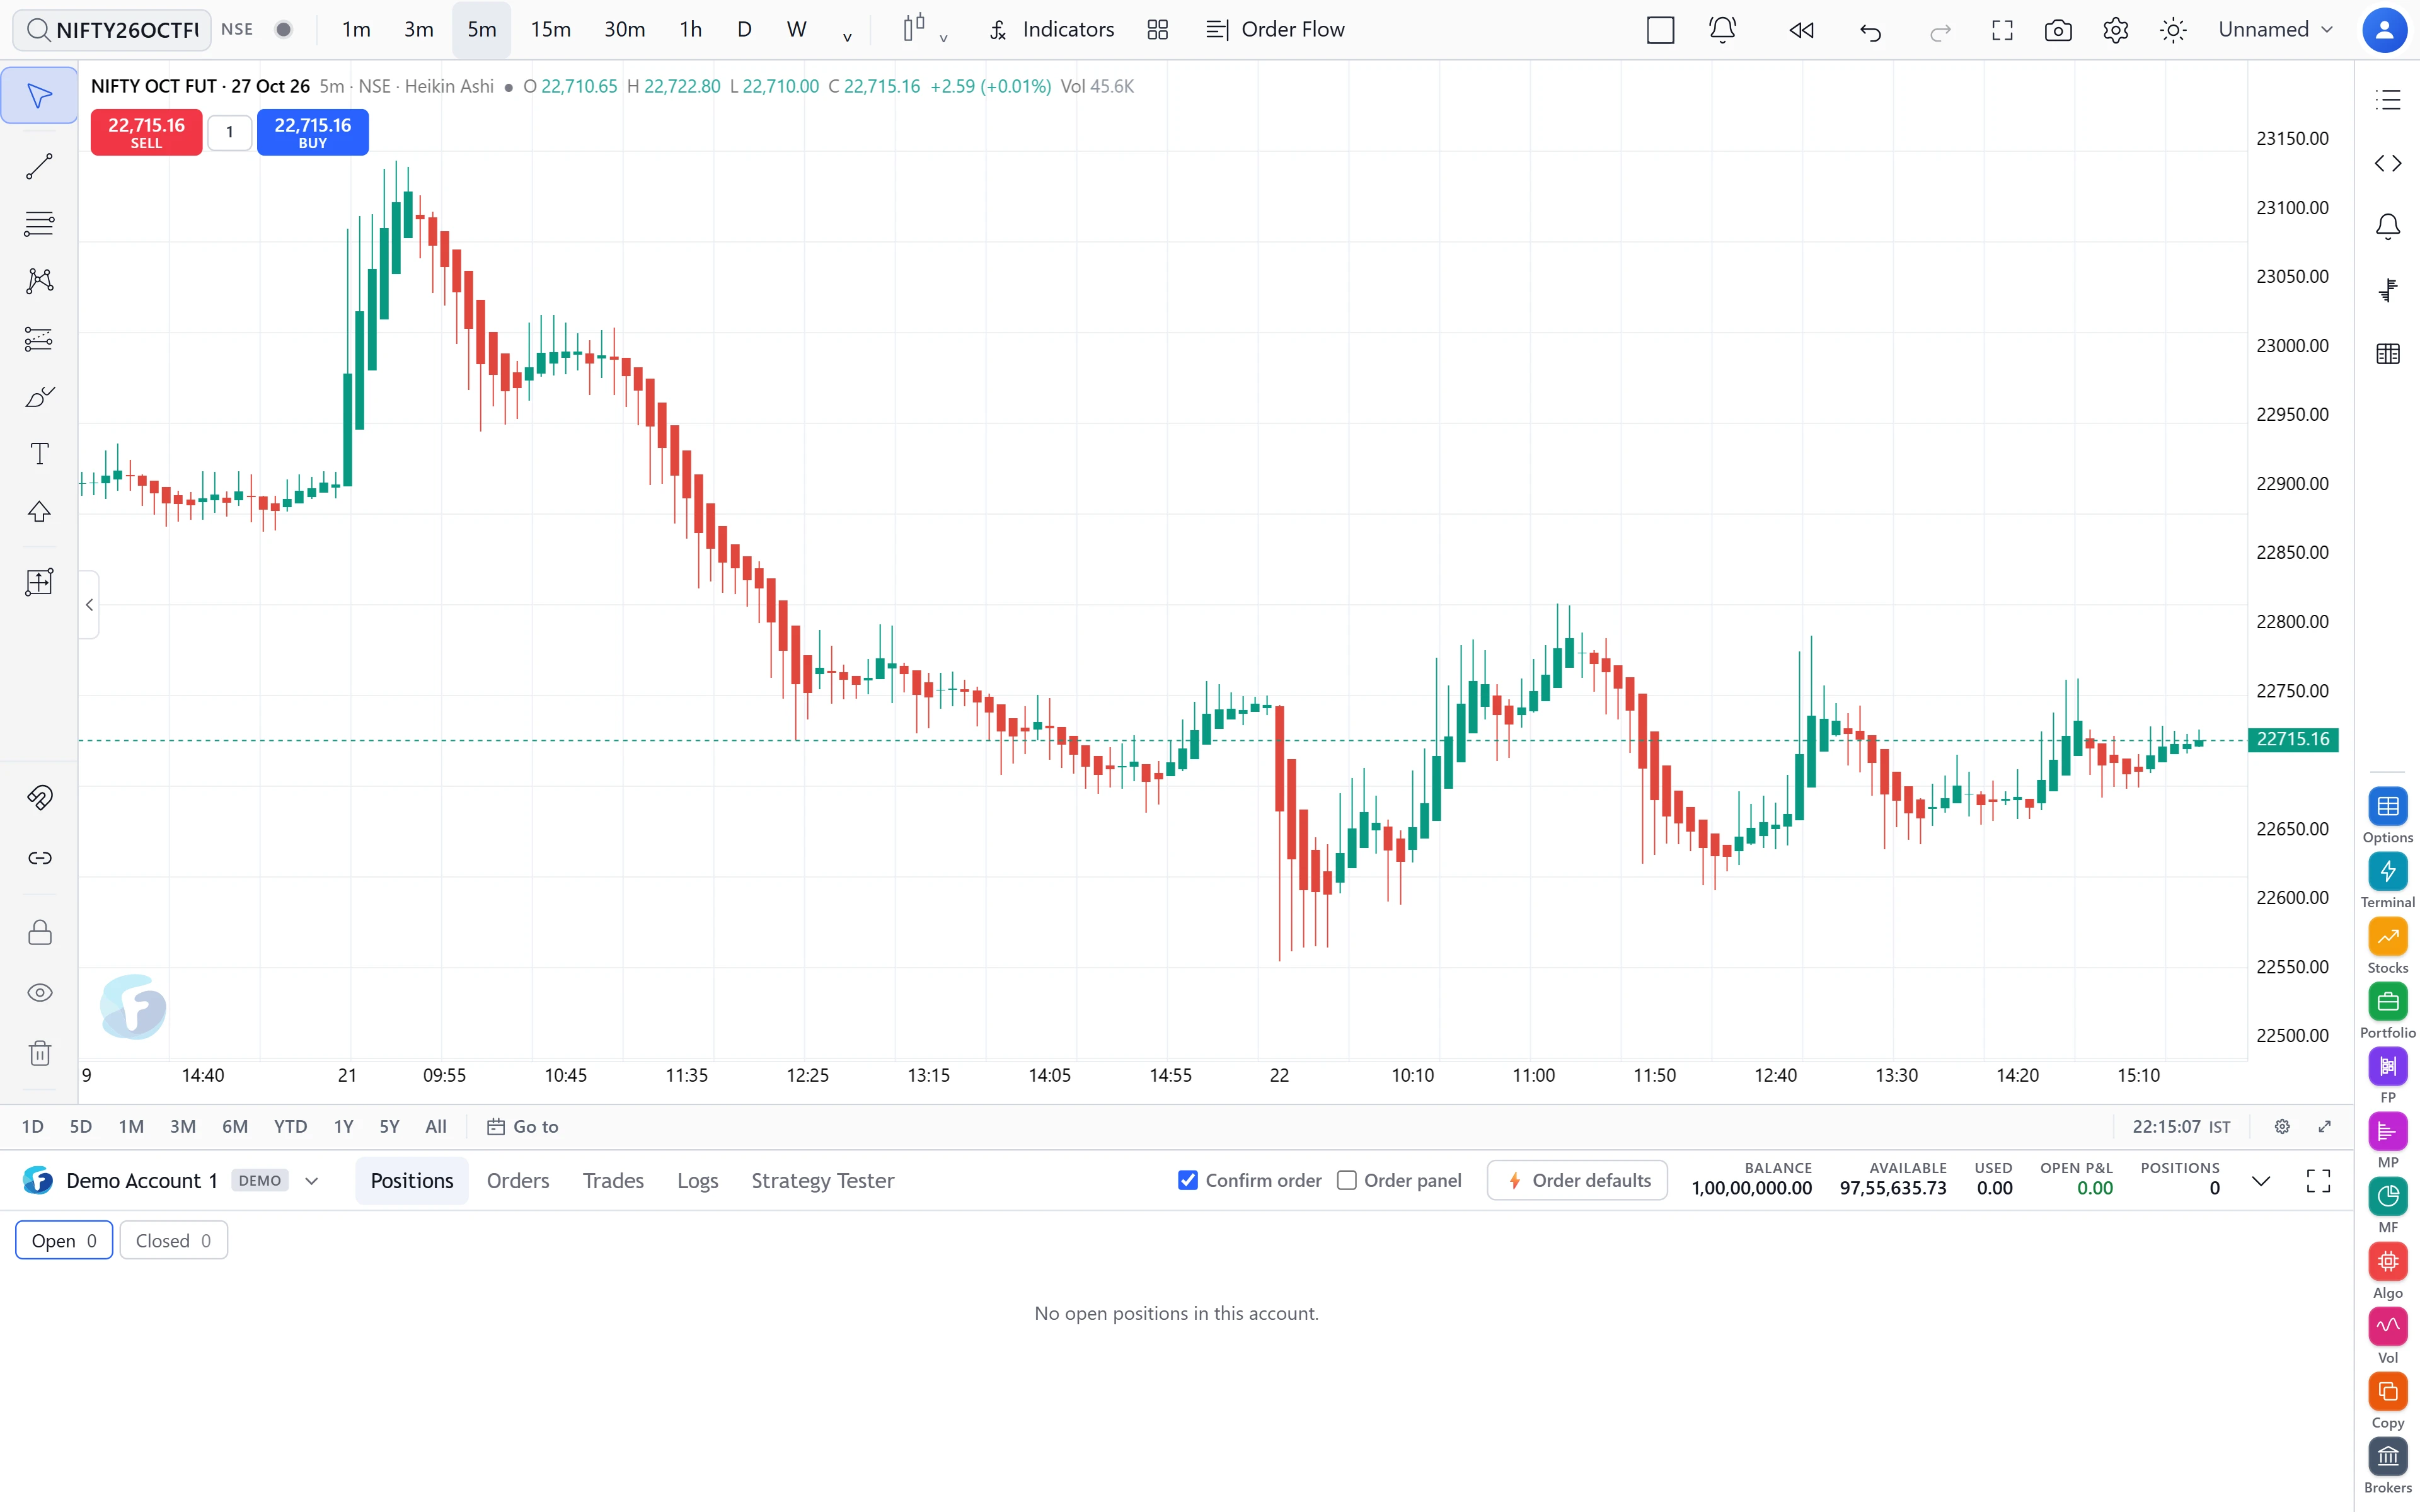
The time-based styles are bars, candles, hollow candles, volume candles (width scaled by volume), line, line with markers, step line, area, HLC area, baseline, columns and high-low. These restyle the same bars.
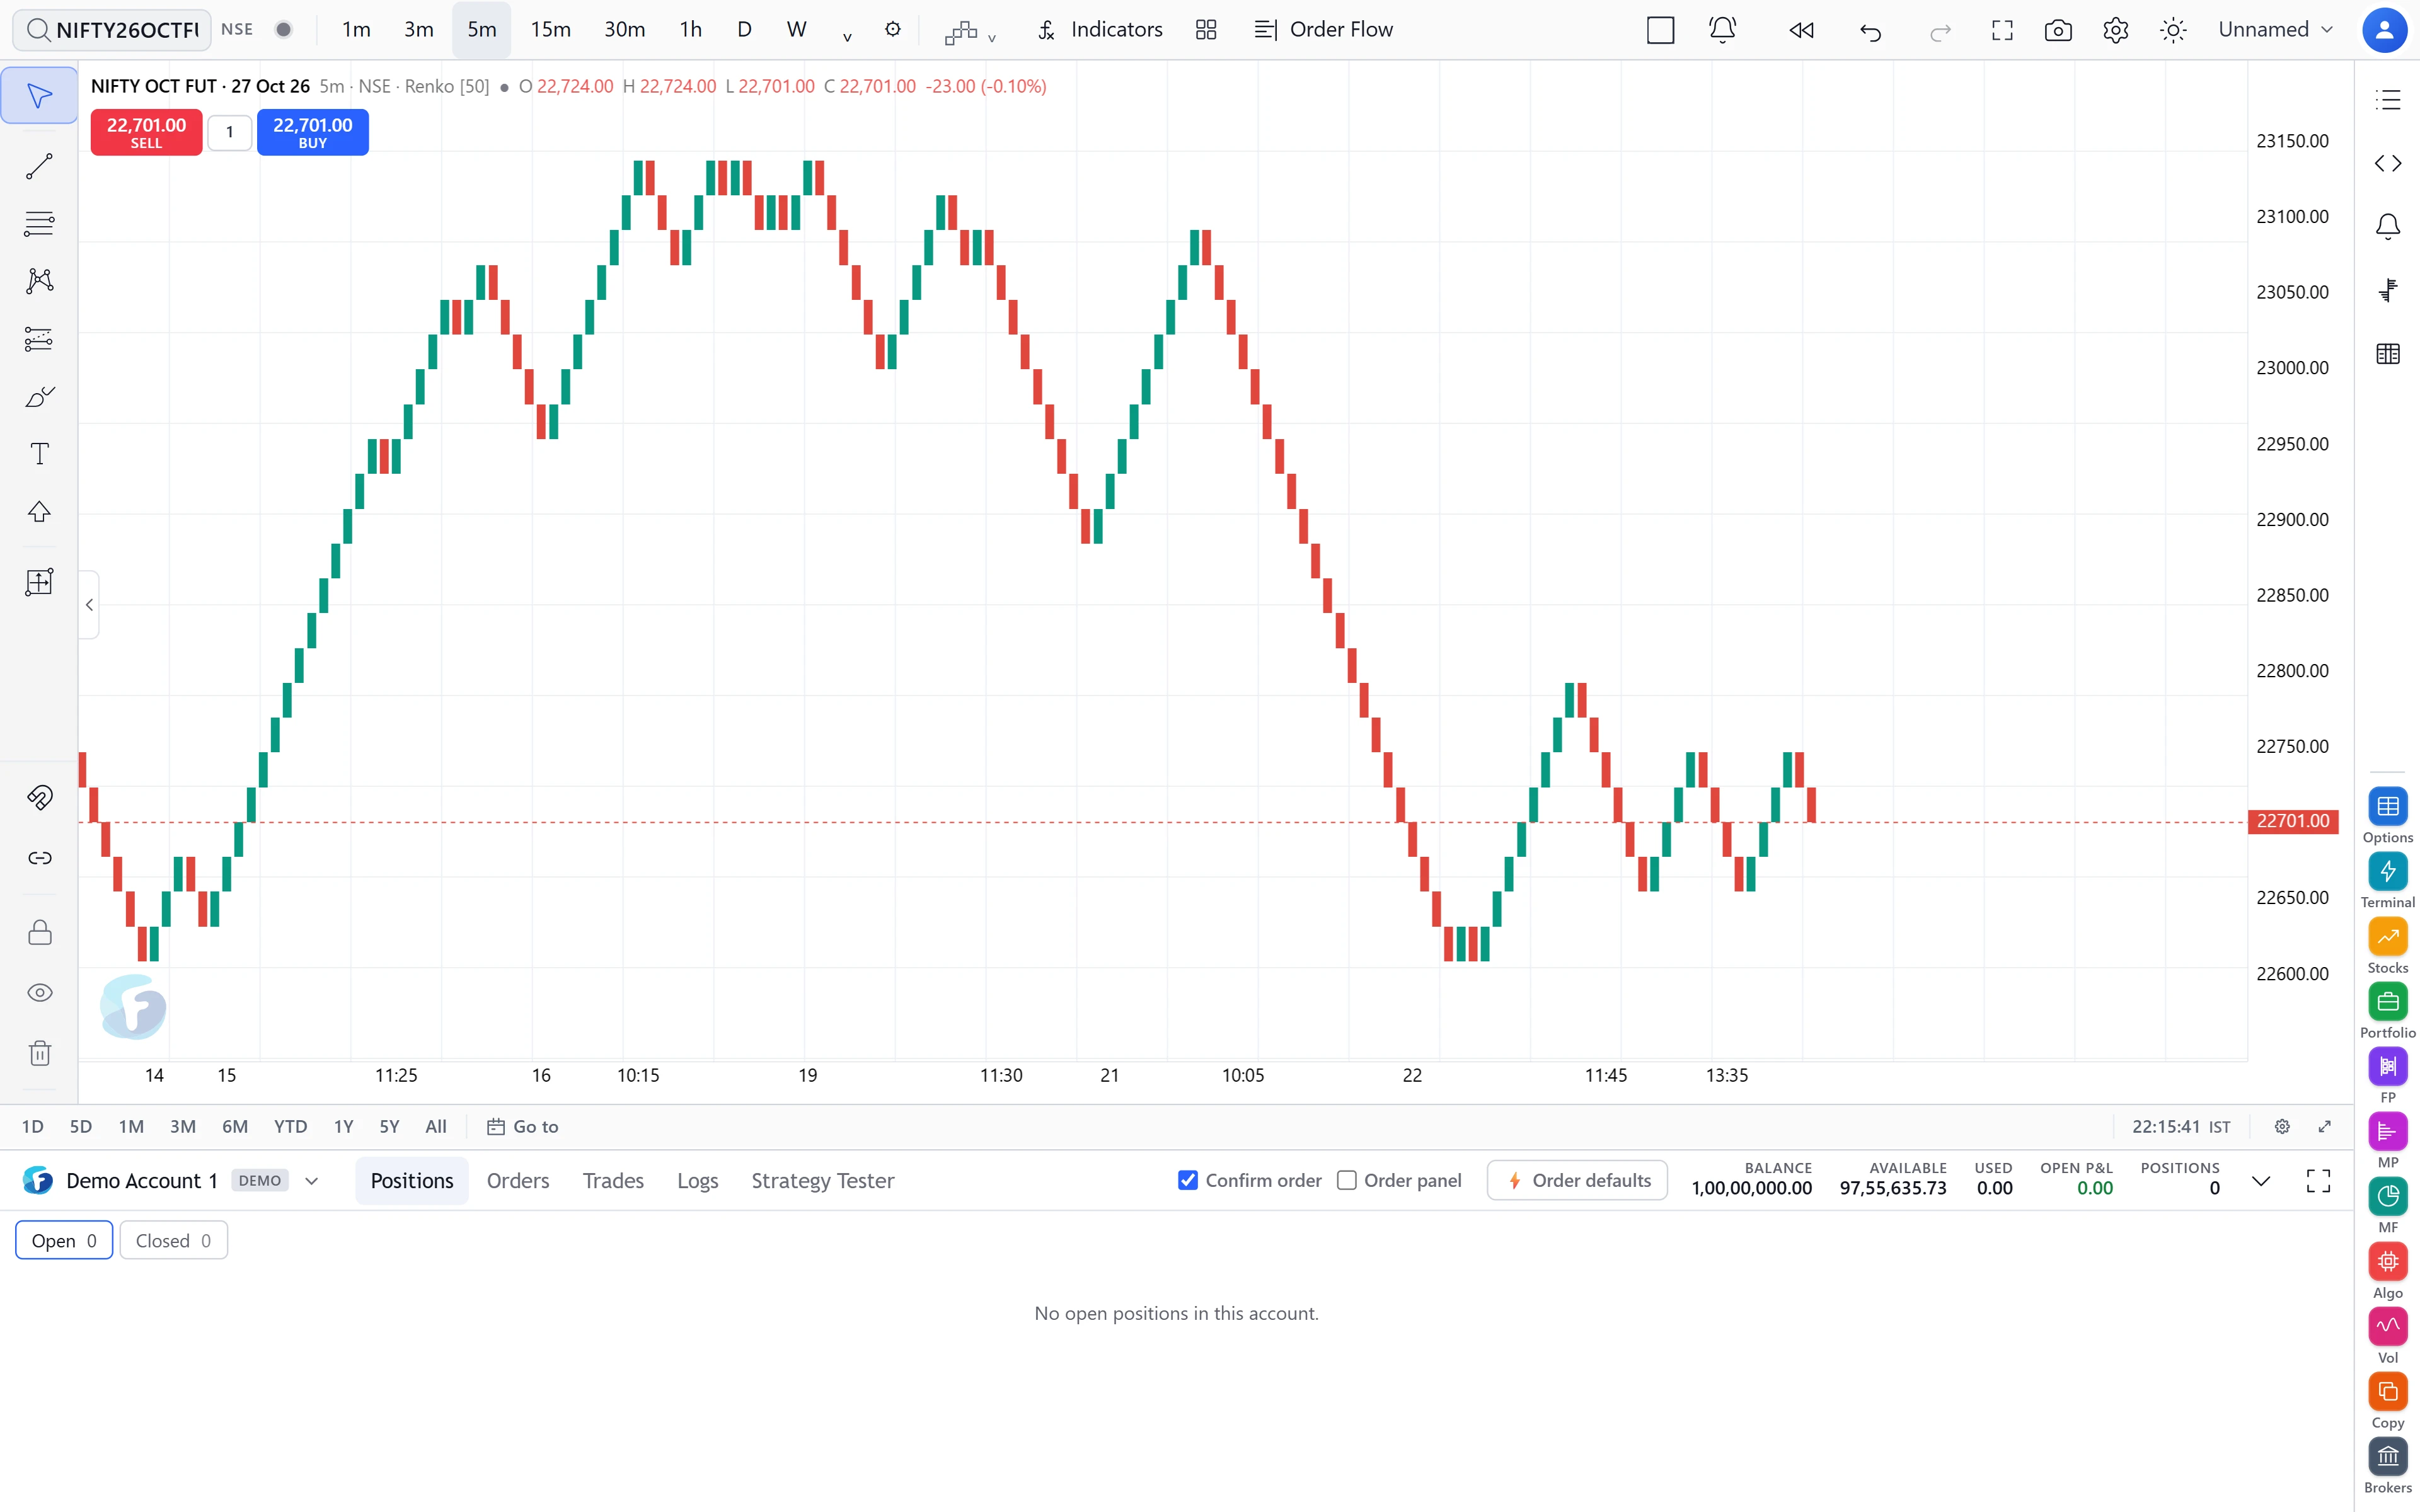
The non-time-based types rebuild the bars:
| Type | Settings (defaults) |
|---|---|
| Heikin Ashi | None. Each close is the average of the bar’s open, high, low and close; each open is the midpoint of the previous Heikin Ashi candle. |
| Renko | Box size 50 (traditional) or ATR-based, ATR length 14. |
| Range | A new bar every 50 points of range. |
| Line Break | 3 lines. |
| Point & Figure | Source high-low or close; box 50 (traditional), percentage of LTP, or ATR; reversal 3 boxes. |
| Kagi | Reversal amount 4. |
Why indicators follow the bar type
The transform happens before anything else sees the data. A Supertrend on a Renko chart is computed from Renko bricks, not from the time candles behind them; the legend and alerts read the bricks too. That is what the chart type means, and it is why a crossover can look different on Heikin Ashi than on candles — it is a different series.
A worked example
Renko. With a box size of 50 and the last brick closing at 22,000, a rise to 22,160 adds bricks at 22,050, 22,100 and 22,150. The remaining 10 points form nothing until price reaches 22,200. Time does not appear anywhere in that calculation.
Point & Figure. Box 50 with reversal 3 means a column of Xs only turns to Os after a fall of 3 × 50 = 150 points from its high.
Seconds. A 1-second NIFTY futures chart over a 6 h 15 m session is up to 6.25 × 3,600 = 22,500 bars a day; seven days is about 1.5 lakh bars. That is why seconds history stops at a week.
Limits and common mistakes
- Non-time-based charts do not page back. Each brick or column depends on every bar before it, so loading older history in pieces would produce bricks that disagree with those on screen. You see a correct, limited history instead.
- Heikin Ashi prices are not traded prices. Its close is an average. Do not read an entry or stop level off a Heikin Ashi candle.
- Box size depends on the instrument. 50 points suits an index; on a ₹300 stock it draws almost nothing. Use ATR or percentage modes when switching instruments.
- How fresh the latest bar is depends on your data access; see alerts, replay and data freshness.
Where to find it
- On FNOTrader Charts, click the interval in the top bar. Star an interval, or add a custom one in seconds, minutes or hours.
- Click the chart-type icon beside it and pick a style. Non-time-based types are grouped separately; open the chart settings to change box size or reversal.
Order-flow chart types are covered in order flow on the chart.
Common questions
How much history does a seconds chart have?
Seven days. Seconds bars are built from raw ticks, which are kept for a week.
Can I make a 7-minute or 75-minute chart?
Yes. Add a custom interval in minutes or hours; minute charts accept any count up to 1,440.
Are indicators on a Renko chart calculated from the bricks?
Yes. The bars are transformed first, so every indicator, the legend and alerts read the Renko bricks.
Why can't I scroll back far on a Renko or Point and Figure chart?
Paging is switched off for these types, because each brick depends on all earlier bars and piecewise loading would draw inconsistent bricks.
What time zone are monthly bars in?
IST. Monthly bars are calendar months in the exchange's time zone.
More on Charts & Marketplace
More in Charts & Marketplace · App: FNOTrader Charts · Definitions: glossary · All: every article