What COT means here
In footprint analysis, COT is short for commitment of traders in a narrow sense: the net delta committed since a session extreme. It has nothing to do with the weekly regulatory report of the same name.
There are two numbers. COT High is the net delta (buying minus selling) accumulated from the moment the current session high was made up to now. COT Low is the same, measured from the session low.
The question they answer is whether the extremes are being defended or pressed.
How they reset
Each time price prints a new session high, COT High resets and starts accumulating again from that trade. The same happens to COT Low on every new session low. Both reset at the start of each trading day.
On live data the counting is done trade by trade as ticks arrive. For bars loaded from history, the app rebuilds the values from each bar's delta, so on past bars they are a close approximation rather than a tick-exact figure.
How to read the two numbers
| Reading | What it describes |
|---|---|
| COT High positive | Since the high, buyers have still been net aggressive. The market has not walked away from the high. |
| COT High negative | Since the high, sellers have dominated. Price is moving away from the high on net selling. |
| COT Low positive | Since the low, buyers have been net aggressive. The low is being bought. |
| COT Low negative | Since the low, sellers are still pressing. |
The change matters as much as the sign. A COT Low that is negative but shrinking bar after bar says selling pressure is fading even though sellers are still technically ahead.
Remember that both are built from classified volume, so they inherit the limits of the tick rule described in footprint views and classification.
A worked example
Hypothetical session. At 10:40 IST the future makes a new high of 24,420 and COT High resets. The next four 5-minute bars have deltas of −120, −80, +30 and −150 lots, with no new high.
COT High after each bar: −120, −200, −170, −320. Sellers have net sold 320 lots since the high was printed.
If the fifth bar then trades 24,425, a new high, COT High resets to that bar's own running delta from the new high and the −320 is gone. That is the point of the measure: it only ever describes behaviour since the latest extreme.
Reading COT alongside the rest of the chart
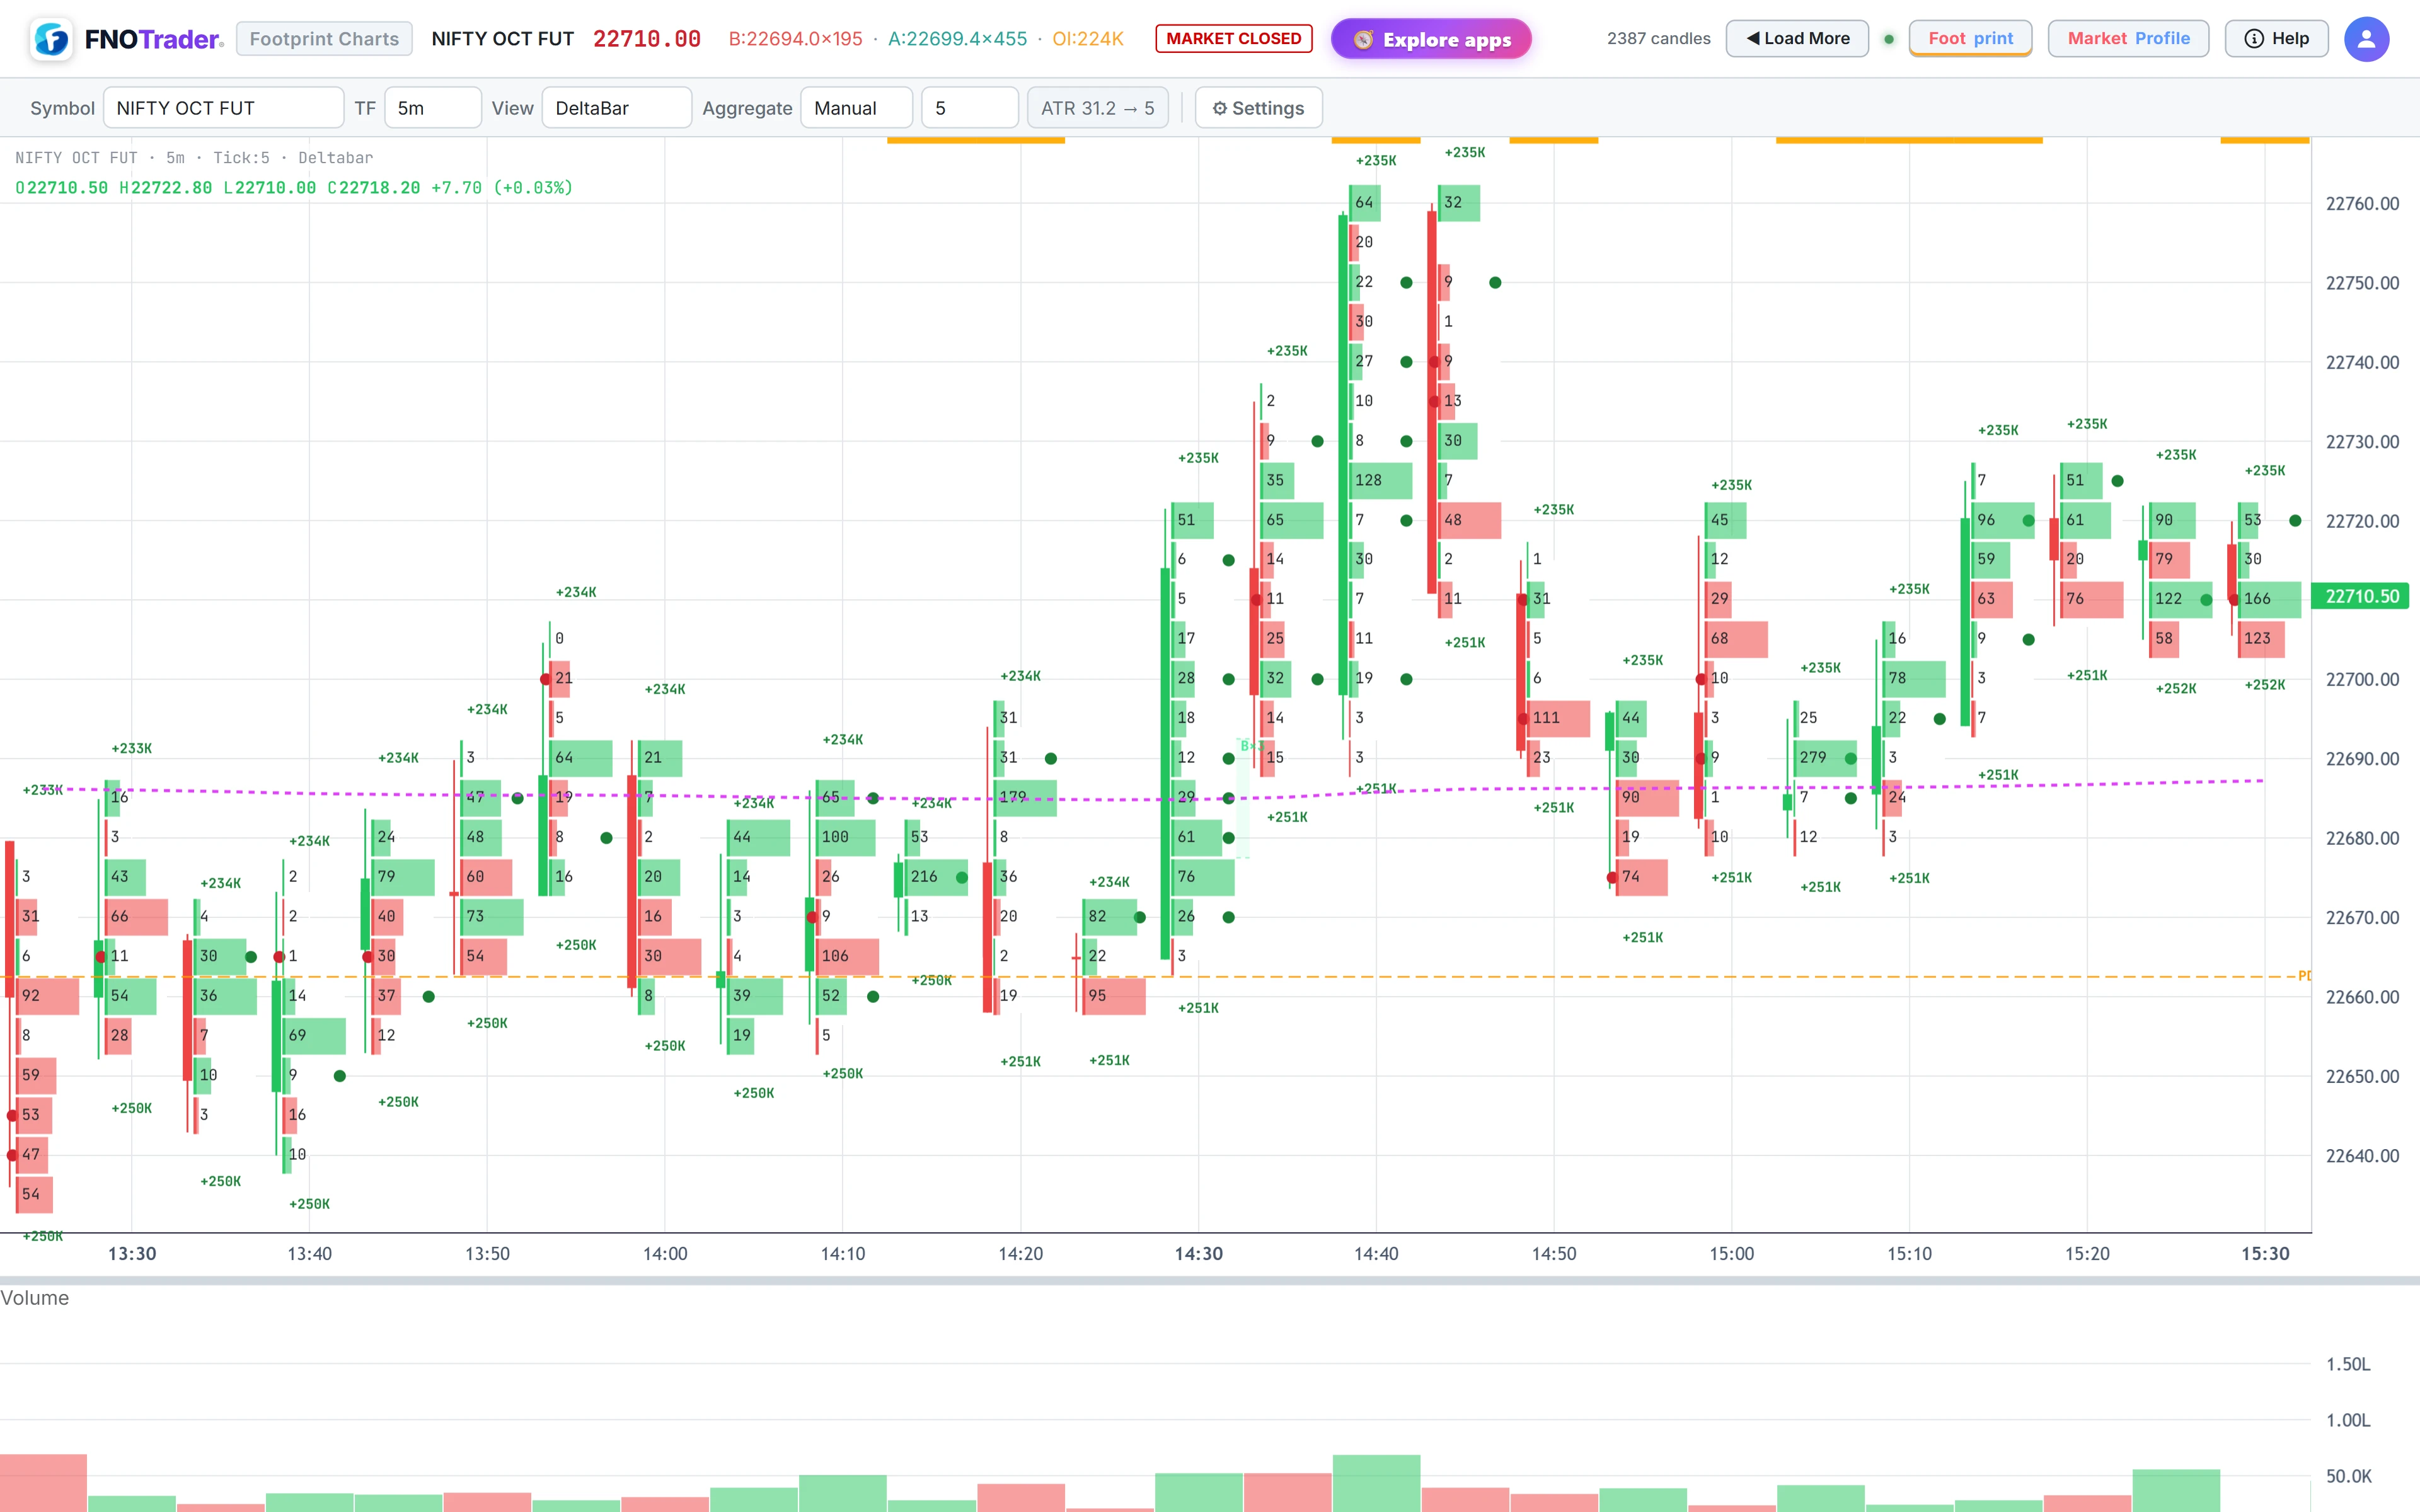
COT is most useful when it is read against what is happening at the extreme itself. If the session high shows a selling tail or buying exhaustion on the footprint and COT High then turns negative and keeps growing, the two observations describe the same thing from different angles — a high made on buying that sellers then took over.
When they disagree, that is worth noticing too. A bearish badge at the high with COT High still positive says the rejection has not yet shown up in the flow. See footprint signals for the badges themselves.
Limits and common mistakes
- Early in the day the numbers are small because the extremes keep moving and resetting them. They become more informative once the range has settled.
- It is not the same as CVD. CVD counts from the session open; COT counts from the latest extreme. A day can have strongly positive CVD and negative COT High at the same time. See CVD and the bottom pane.
- It is not the regulatory report. Anyone searching for positioning data on futures exchanges wants a different thing.
Where to find it
- Open Footprint & Market Profile.
- Under Settings, click COT. Values appear above and below each candle.
- Alternatively set Bottom to Panel; the last two rows of the per-candle stats are COT-H and COT-L.
Common questions
Is footprint COT the same as the COT report?
No. On a footprint, COT High and COT Low are the net delta accumulated since the session high and low were made. The COT report is a separate weekly positioning publication.
When does COT High reset?
Every time a new session high prints, and at the start of each trading day. COT Low resets on each new session low.
What does a negative COT High mean?
Since the current session high was made, sellers have been net more aggressive than buyers. It describes the flow since the high; it does not forecast the next move.
How is COT different from cumulative delta?
Cumulative delta counts from the session open. COT counts only from the latest high or low, so it isolates behaviour around the extremes.
More on Footprint & Market Profile
More in Footprint & Market Profile · App: Footprint & Market Profile · Definitions: glossary · All: every article