What the meter shows
The Insights section shows a bias label — Bullish, Bearish or Neutral — a confidence bar from 0 to 100, the raw score, and tags naming each condition that contributed.
The tags are the useful part. A Bullish 60 built from “above value area” and “strong buying pressure” is a different market from a Bullish 60 built from a single trend count and a VWAP reading. Read the tags before the number.
How the score is built
Each time it evaluates, the engine runs fourteen checks. Each returns zero or a small signed score. Order-flow checks come from the footprint; profile checks come from the day's TPO and volume profiles.
| Check | Score |
|---|---|
| Delta over 30% of bar volume, in the direction of the candle | ±2 |
| Candle direction against its delta (divergence) | ±3 |
| A row with over 2× the recent average row volume while the bar's range stayed under 0.05% of price (absorption) | ±3 |
| Three or more stacked imbalances at a 3× ratio | ±2 |
| Heavy volume at the previous bar's extreme with no follow-through | ±2 |
| Session cumulative delta changing sign | ±2 |
| Session cumulative delta above 5% / 10% of session volume | ±2 / ±3 |
| Three or more consecutive higher or lower closes, plus price 0.2% away from VWAP | up to ±3 |
| Price above or below the TPO value area | ±2 |
| Price above, below, reclaiming or rejecting the TPO POC | ±2 |
| Price beyond the initial balance (first 60 minutes) | ±2 |
| Price above or below the volume-profile POC | ±2 |
| Price at a high-volume node | ±1 |
| Price at a low-volume node, with or without strong delta | ±2 |
Confluence, traps and the final label
- Confluence. If the order-flow total and the profile total point the same way, the combined score is multiplied by 1.5.
- Trap check. If price is beyond the initial balance but the last two bars' deltas flipped sign, the score is pulled 3 points back toward zero and a “trap detected” tag is added.
- Label. Score of +4 or more is Bullish, −4 or less is Bearish, anything between is Neutral.
- Confidence. The absolute score times 10, capped at 100.
A worked example
Hypothetical mid-morning read. Price is above the TPO value area (+2) and above the volume POC (+2). Session CVD is 7% of session volume (+2). The current bar has a strong positive delta in an up candle (+2). No other check fires.
Order flow = +4, profile = +4. They agree, so the total of 8 becomes 8 × 1.5 = 12. Label: Bullish. Confidence: 12 × 10 = 120, capped at 100.
Notice how quickly confidence saturates. Four agreeing conditions max it out. A reading of 100 means “the checks agree”, not “this is certain”.
When it stays quiet, and its limits
The engine deliberately skips evaluation in some conditions, so a stale or empty meter is often intentional:
- The first five minutes after the session opens.
- Bars with very little volume.
- A bar whose delta is more than five times the recent average — usually a news spike that would distort every check.
- It evaluates on bar close and at most every 30 seconds in between.
It is a weighted checklist, not a model trained on outcomes. The weights are fixed judgement, not fitted to returns, and no claim is made that a Bullish read is followed by a rise. Use it to see what the chart is saying, then decide for yourself.
Market Intelligence
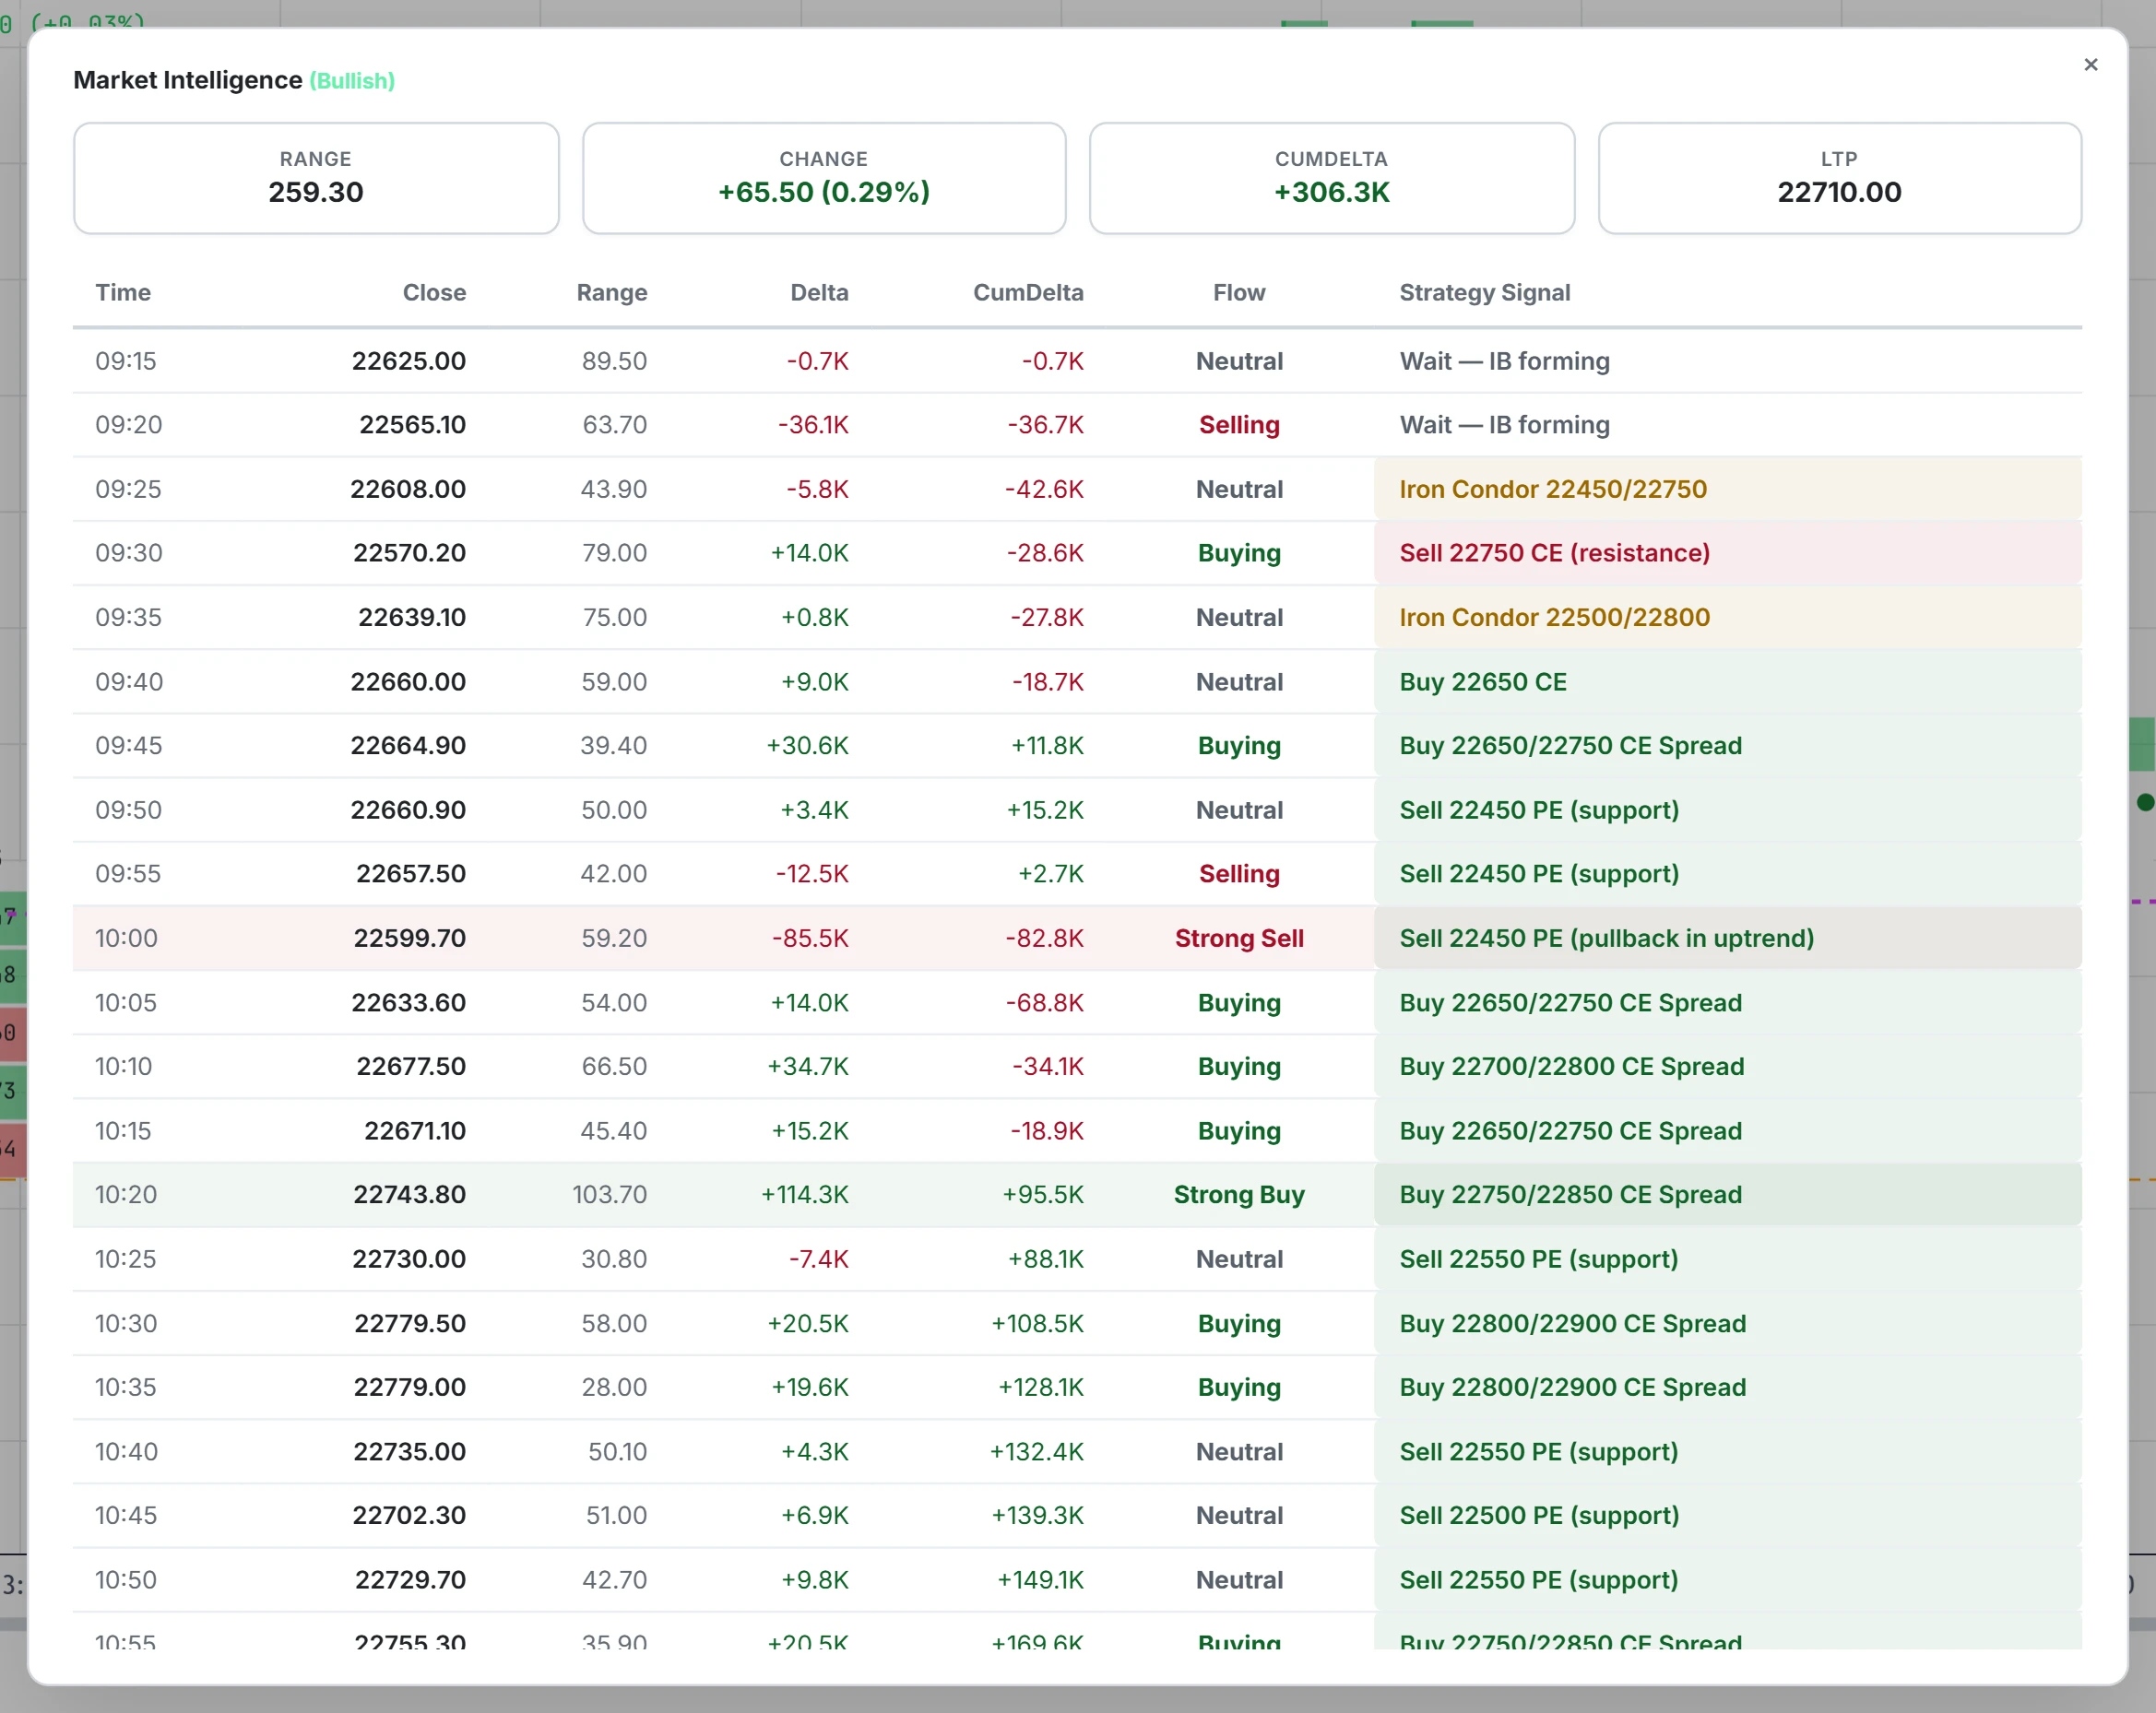
The button at the foot of the Insights section opens Market Intelligence: a session summary with range, change, cumulative delta and last price, and a table of every bar today with close, range, delta, running CVD and a flow label (Strong Buy, Buying, Neutral, Selling, Strong Sell). Its heading carries a structure read — Bullish, Bearish or Rangebound — based on whether the day's swing highs and lows are rising, falling or mixed.
Where to find it
- Open Footprint & Market Profile.
- Click Settings, then Right to open the side panel.
- Insights sits between Stats and Time & Sales. The tags beneath the bar explain the score.
The individual ingredients are covered in footprint signals and TPO and value area.
Common questions
How is the footprint bias confidence calculated?
Fourteen order-flow and profile checks each add a small signed score. If order flow and profile agree the total is multiplied by 1.5. Confidence is the absolute score times 10, capped at 100.
What score makes the bias Bullish or Bearish?
Plus 4 or more is Bullish, minus 4 or less is Bearish, and anything in between is Neutral.
Why is the Insights panel empty right after the open?
The engine skips the first five minutes of the session, very low-volume bars and news-spike bars, so the early read is often blank by design.
Is the Insights bias a trading signal?
No. It summarises what the chart is showing. The weights are fixed judgement rather than fitted to outcomes, and a Bullish read does not imply price will rise.
More on Footprint & Market Profile
More in Footprint & Market Profile · App: Footprint & Market Profile · Definitions: glossary · All: every article