What the two tools answer
Compare answers "how have these funds done against each other and against the index". Overlap answers "if I hold both, how much am I actually diversifying".
They are often used together. Two flexi-cap funds may look different on returns and still share half their portfolio — at which point you are paying two expense ratios for something close to one exposure.
Compare: up to four funds plus benchmarks
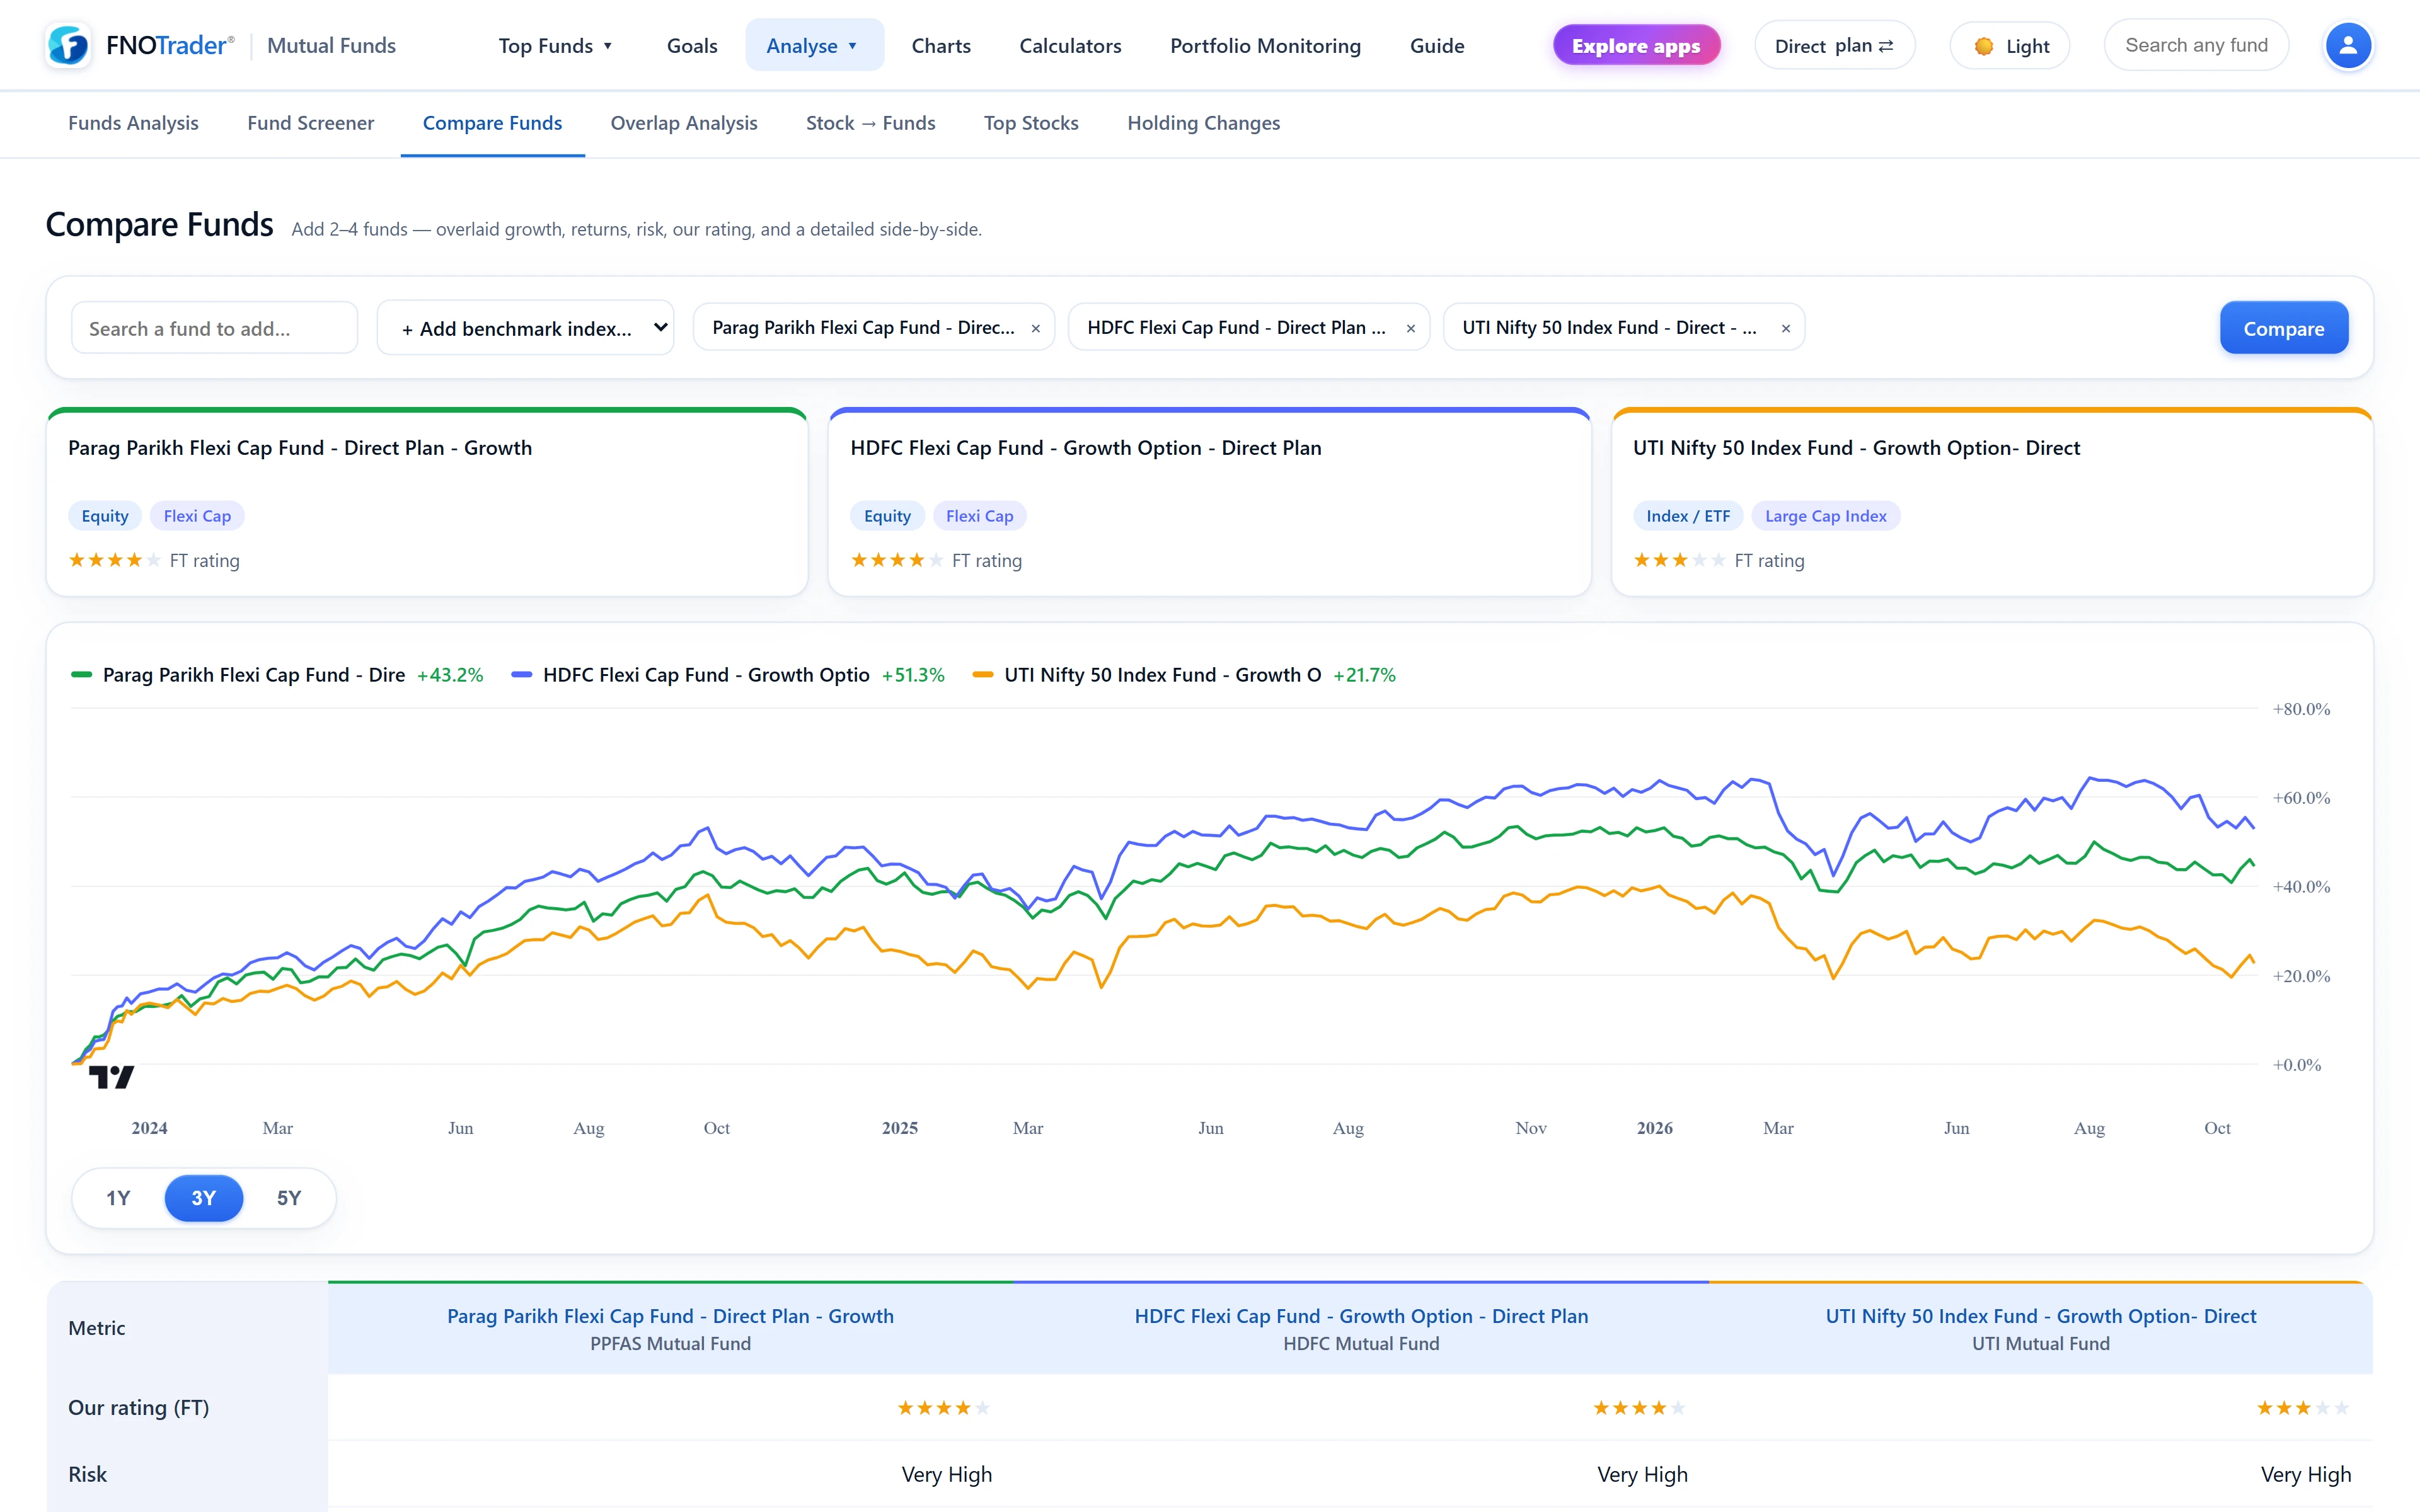
Add up to four funds from the search box, and up to four benchmark indices as extra columns. The page lays out returns across every window, risk ratios, expense, AUM, category rank and market-cap composition, with a growth chart on top.
The chart rebases each line to 0% at the start of the chosen period — 1Y, 3Y or 5Y — so every fund and index starts from the same point and the gap at the end is the difference in growth. The legend shows each line's cumulative return for that period, computed from the full NAV history rather than the sampled points drawn on the chart.
Search follows the global plan toggle. That matters when you compare your own Regular holding with a Direct alternative: pick the exact plan you mean, because the Direct plan of the same fund will always look slightly better. See Direct vs Regular.
Overlap: the sum of minimum weights
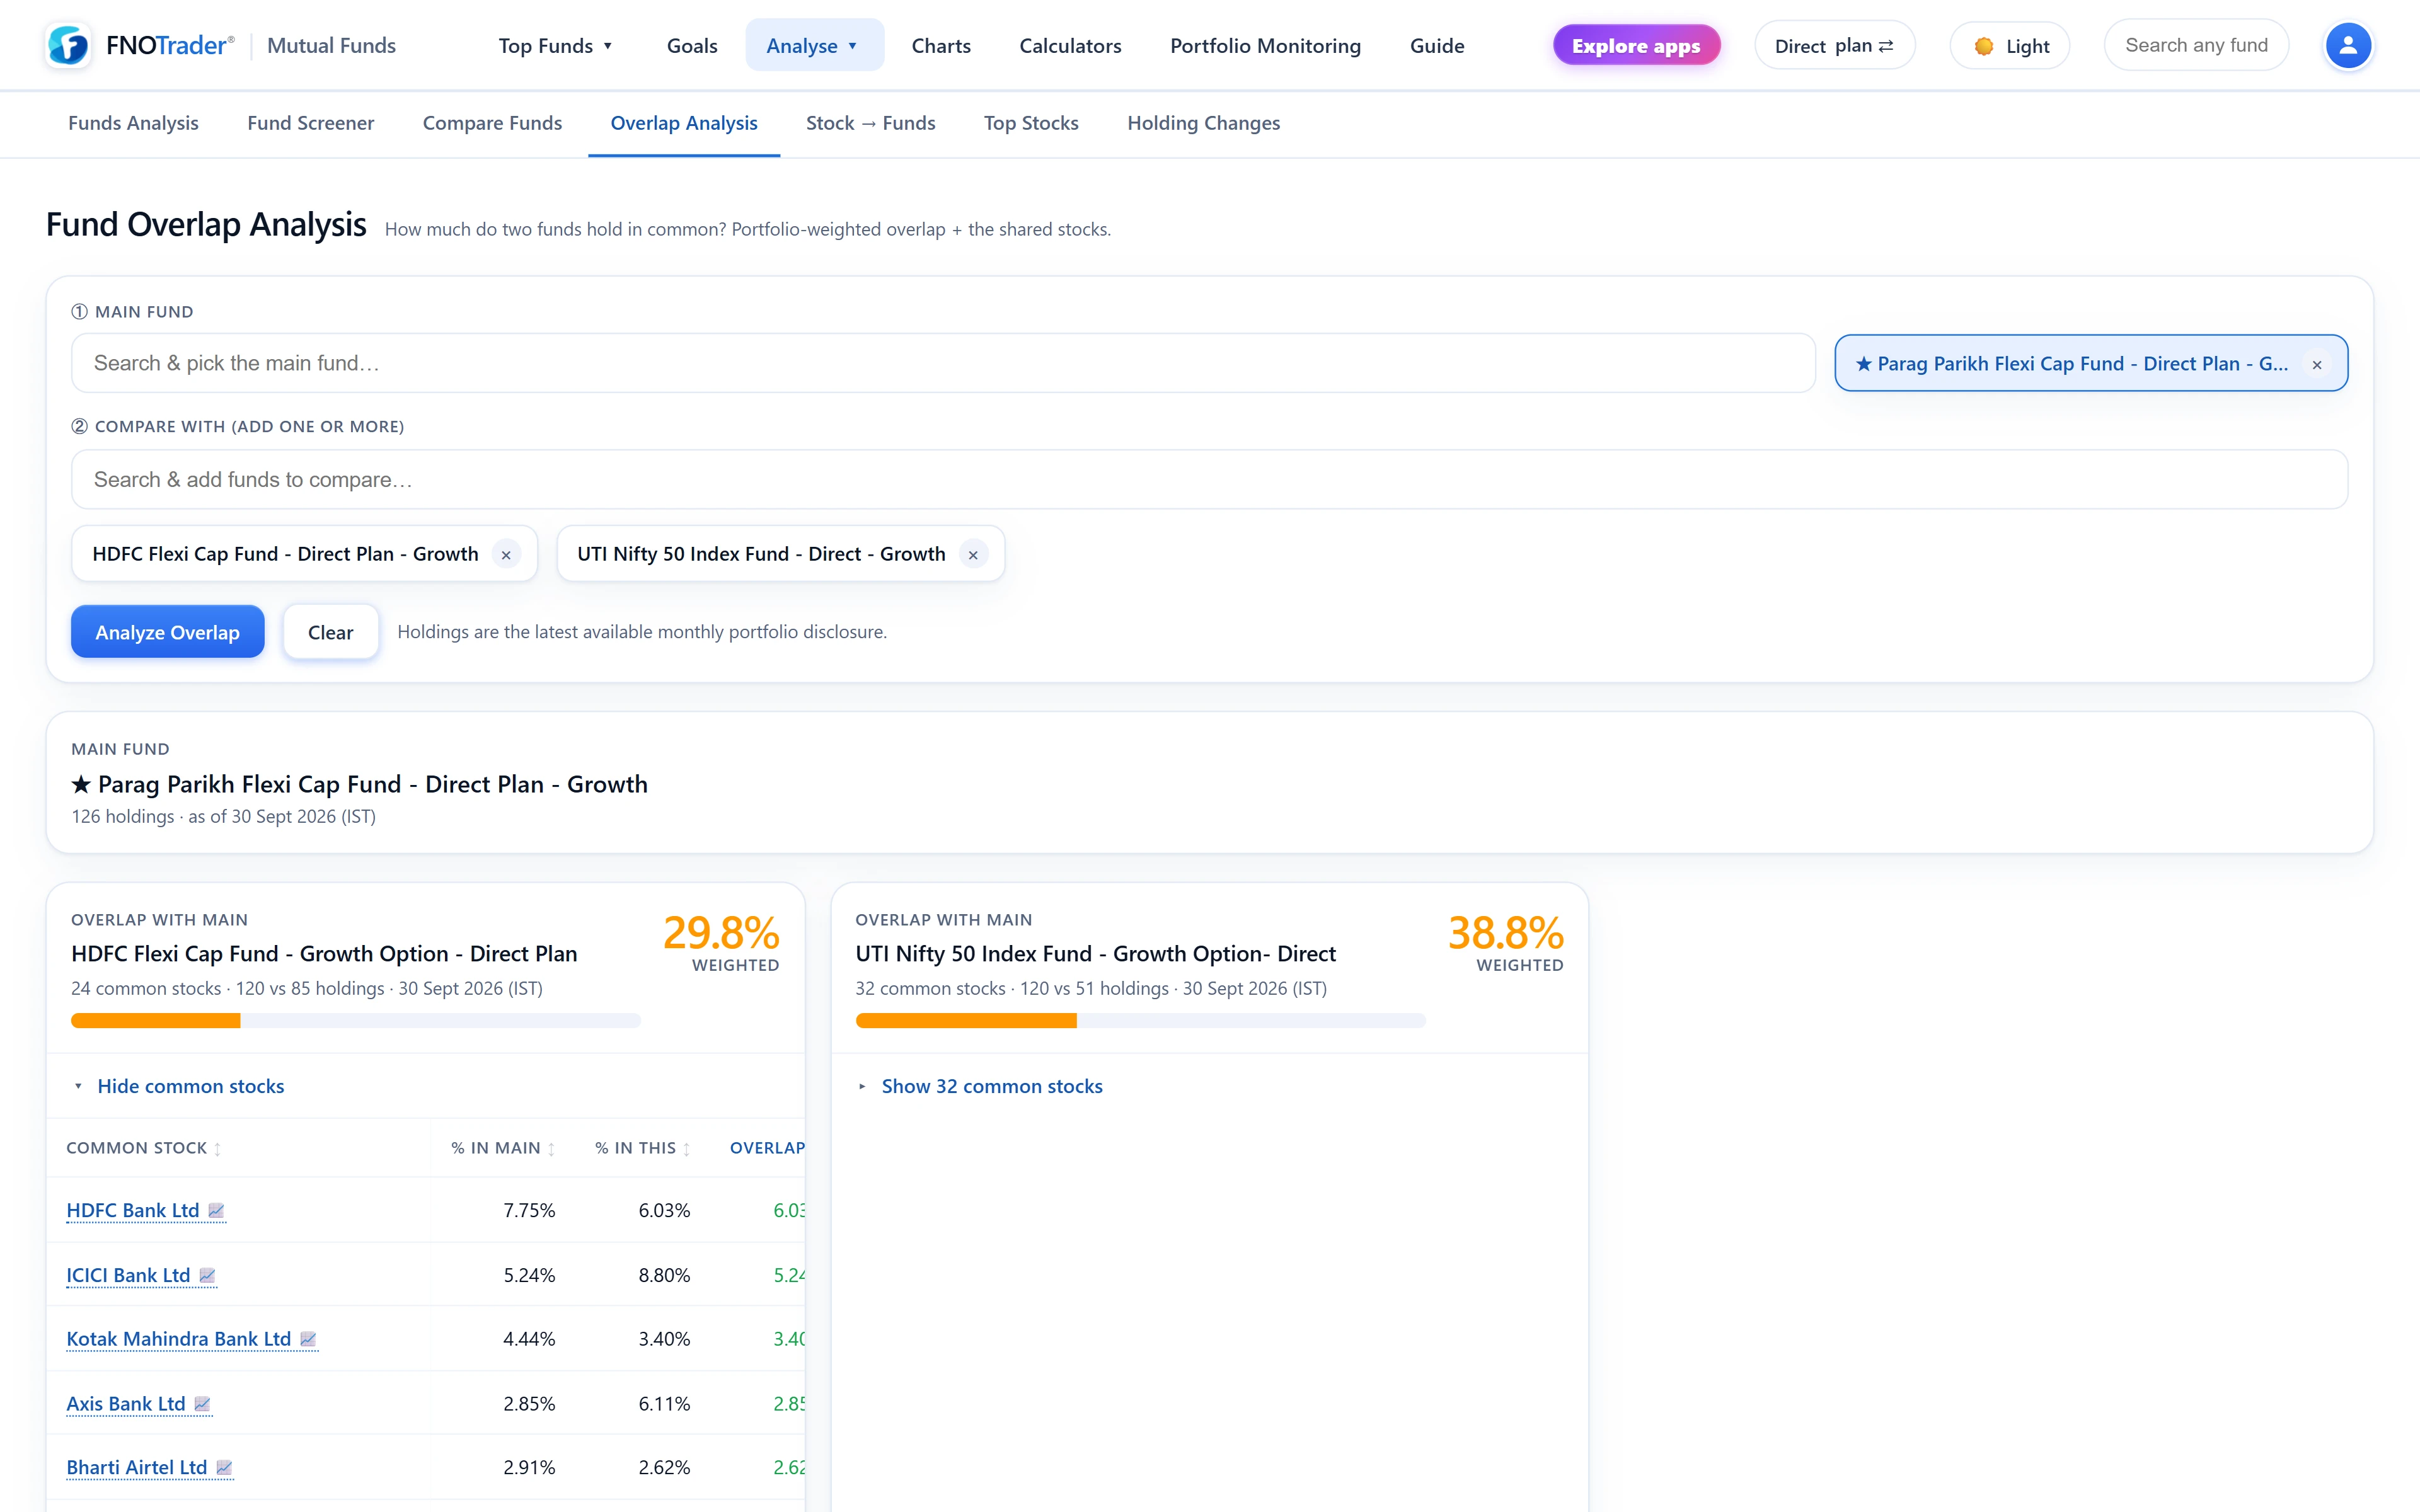
Pick a main fund and add one or more funds to compare. For every stock both portfolios hold, the overlap counts the smaller of the two weights. The sum across shared stocks is the overlap percentage. Cash, repo, treasury and derivative lines are left out, so the figure is about equity.
| Overlap | Reads as |
|---|---|
| Under 25% | Genuinely different portfolios |
| 25–50% | Meaningful common ground; normal between two funds in the same category |
| Over 50% | Largely duplicate holdings |
Below the figure, a table lists each shared stock with both funds' weights and the overlapping portion, largest first. Funds that do not disclose equity holdings — most debt, gold and fund-of-funds schemes — are marked unavailable rather than scored as zero.
A worked overlap example
Two hypothetical funds share four stocks:
| Stock | Fund A | Fund B | Counts |
|---|---|---|---|
| Bank 1 | 8% | 5% | 5 |
| IT 1 | 6% | 7% | 6 |
| Energy 1 | 4% | 2% | 2 |
| Bank 2 | 3% | 3% | 3 |
Overlap = 5 + 6 + 2 + 3 = 16%, under 25%, so the two are largely different despite sharing four names. If they shared the same four names at 10% each in both, the overlap would be 40% — same number of common stocks, very different picture. Count of shared stocks is not the measure; weight is.
Using the two together
A practical sequence when you are weighing a second fund in a category you already hold:
- Compare the two with their common benchmark on the 3Y and 5Y chart. If the lines track each other closely, expect high overlap.
- Run Overlap with your current fund as the main fund. Read the percentage first, then the top of the common-stock list: two or three shared names at large weights do most of the damage.
- Check the market-cap rows in Compare. Two funds with different labels but near-identical large/mid/small splits are usually closer than their names suggest.
Worked reading of a rebased chart: if one fund's line ends the 3Y view at +48% and the index at +40%, the fund grew ₹1 lakh to about ₹1.48 lakh against ₹1.40 lakh for the index over the same dates. That is a cumulative gap; the annualised gap is smaller, about 14.0% against 11.9% a year. The concept is covered in XIRR vs CAGR.
Limits
- Disclosures are monthly. Overlap is computed on the latest disclosed portfolios, and two funds may have disclosed on slightly different dates. The dates are shown.
- Overlap is pairwise. Three funds each overlapping 30% with each other can still concentrate you in the same top names. The Portfolio Insights look-through sums your real stock exposure across every fund.
- Low overlap is not automatically good. It means different stocks, not better ones.
Where to find them
- In Mutual Funds, open Analyse → Compare Funds, add funds and any indices, and switch between 1Y, 3Y and 5Y on the chart.
- Open Analyse → Overlap Analysis, pick a main fund, add others, and press Analyze Overlap.
- Click any shared stock to see which other funds hold it — see Stock to Funds.
Common questions
How is mutual fund overlap calculated?
For every stock both funds hold, take the smaller of the two weights, then add them up. If both hold a bank at 8% and 5%, it contributes 5 percentage points.
What is a high overlap between two mutual funds?
Over 50% means largely duplicate holdings. Under 25% means the portfolios are genuinely different; 25 to 50% is typical within one category.
How many funds can I compare at once?
Up to four funds, plus up to four benchmark indices on the same rebased chart.
Why does overlap show unavailable for a fund?
The fund does not disclose equity holdings, as is usual for debt, gold and fund-of-funds schemes, so there is nothing to compare.
More on Mutual Funds
More in Mutual Funds · App: Mutual Funds · Definitions: glossary · All: every article