What it is
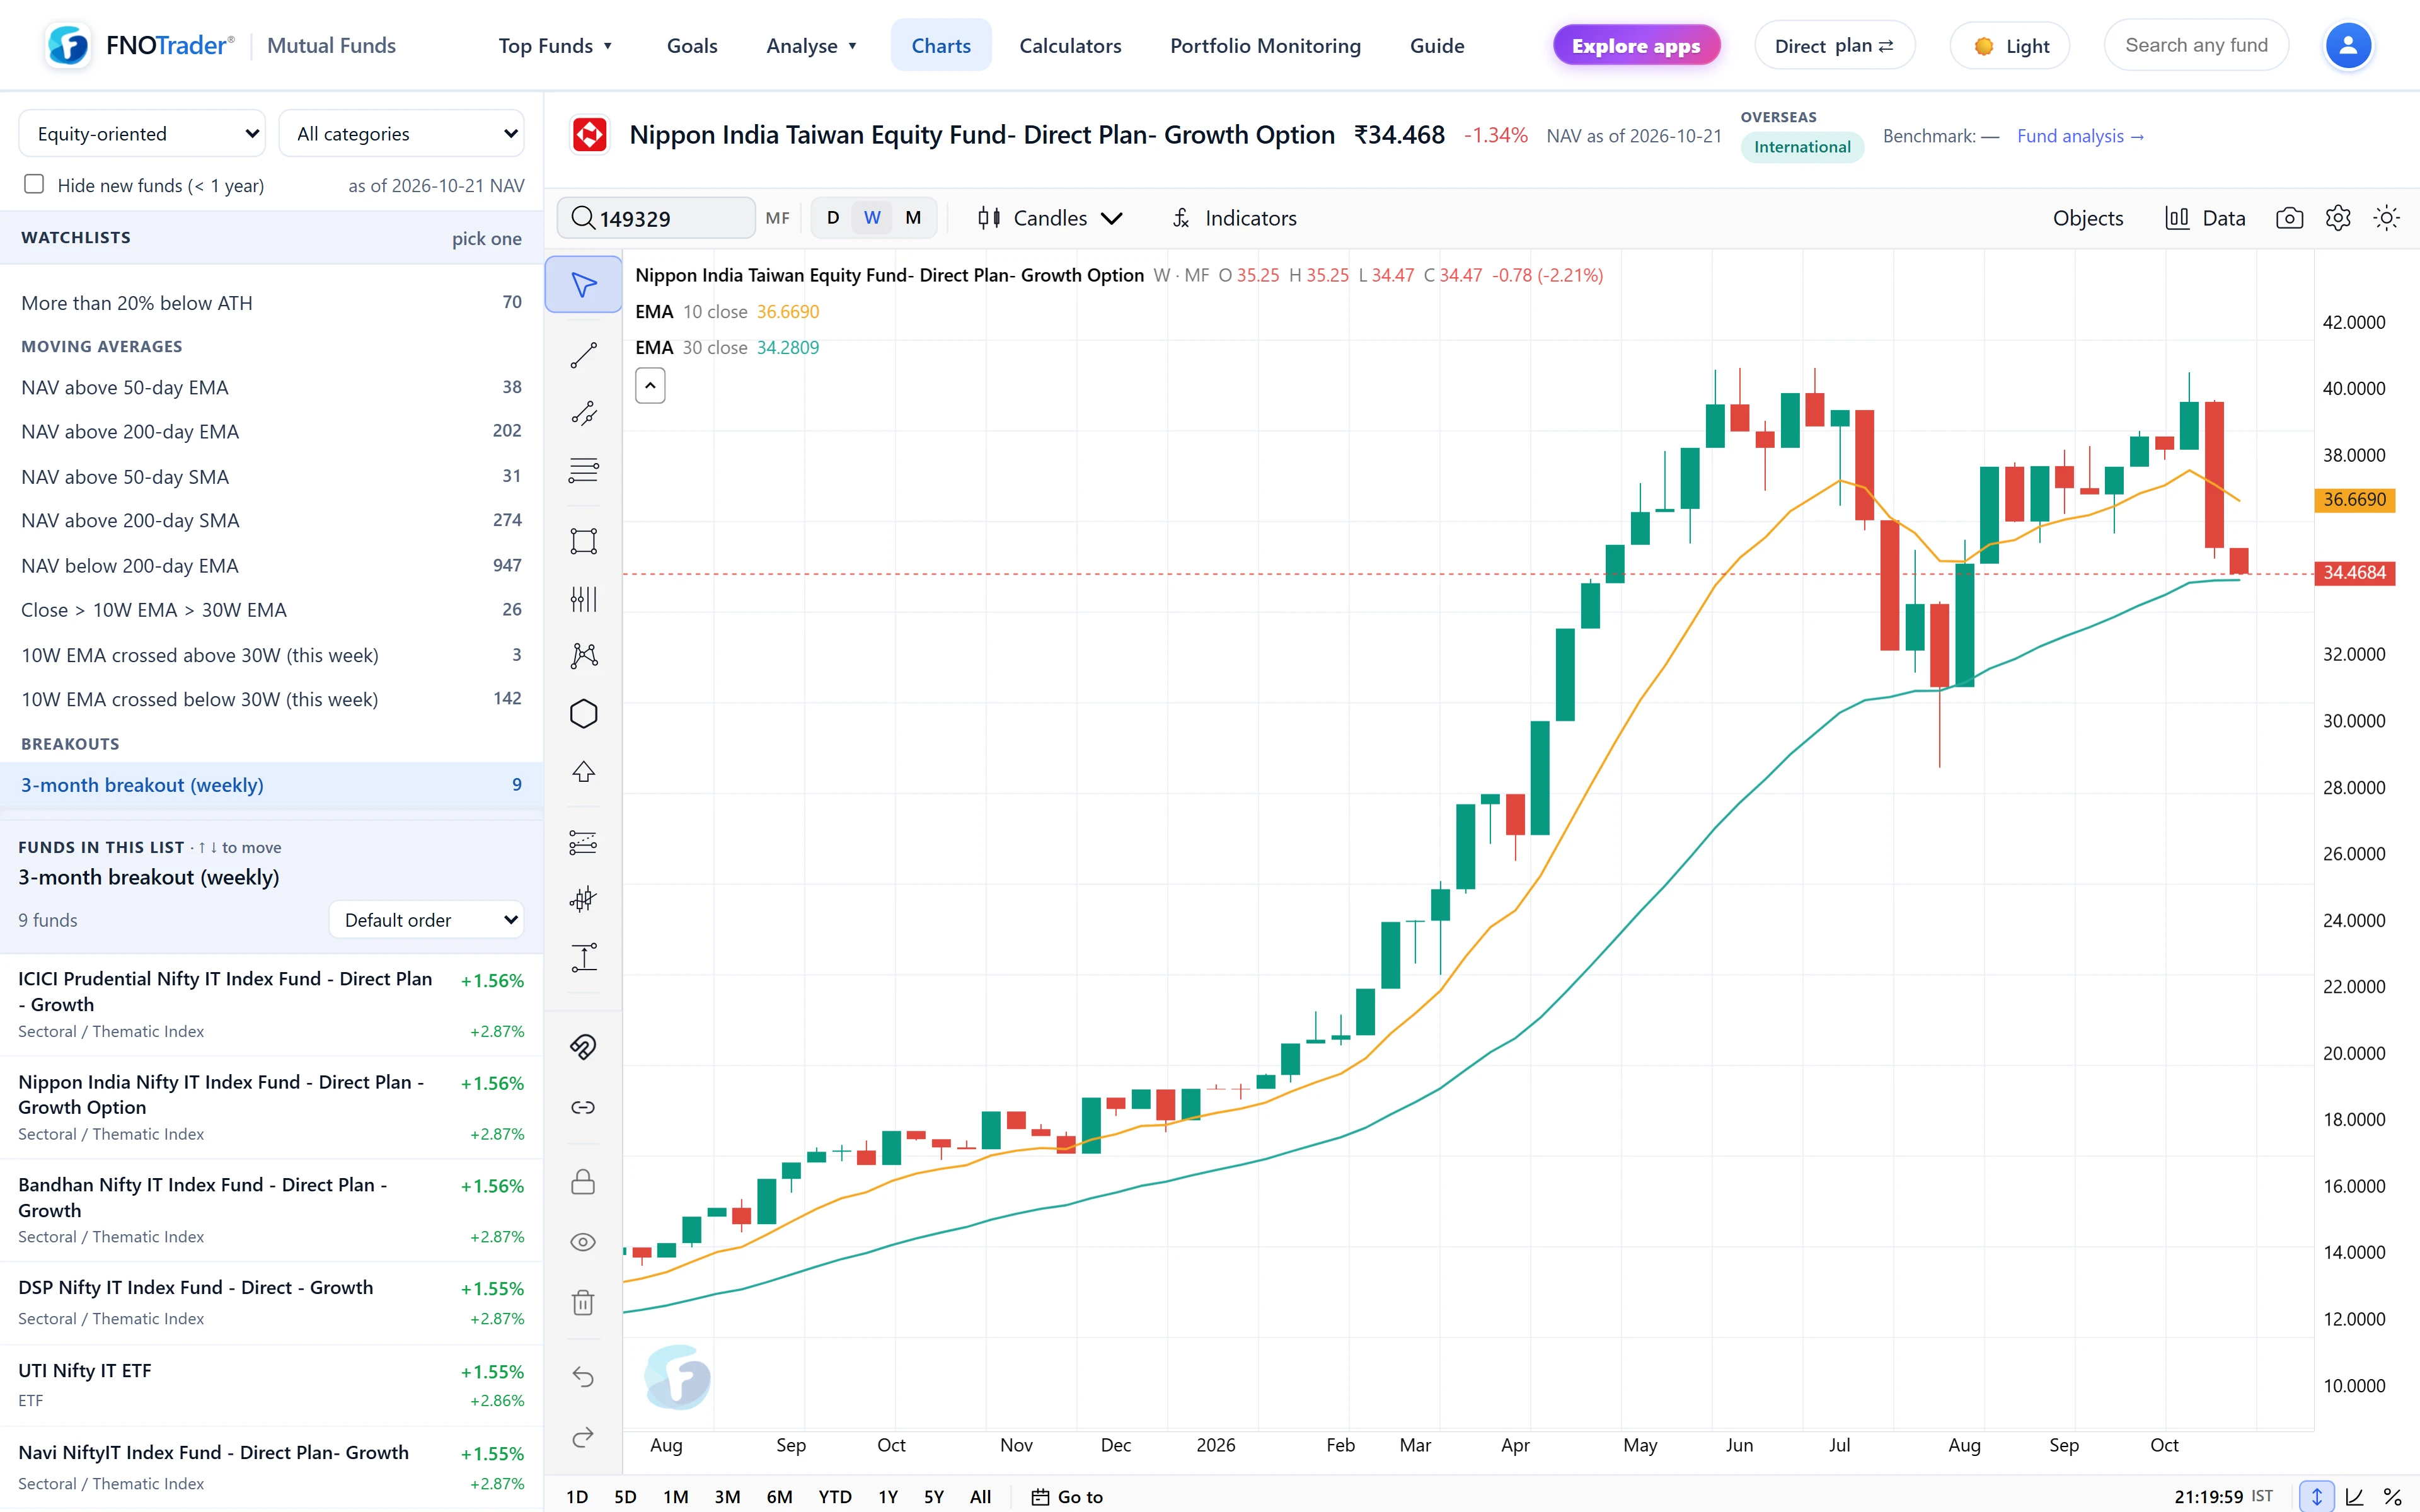
Charts is a full chart for any fund's NAV, on daily, weekly or monthly bars, with a sidebar of predefined watchlists — funds at all-time highs, breaking out, above their moving averages, leading their category — that you can step through one chart at a time.
It uses the FNOTrader Charts library, with drawing tools and its indicator set. Volume is switched off, because a NAV has none: indicators that need volume, such as OBV, VWAP and money flow, are not meaningful for a fund. Your chart layout, indicators and drawings are saved to your account.
How candles are made from one NAV a day
- Open is the previous bar's close, so there are no gaps.
- High and low are the highest and lowest NAV inside the bar (and the open).
- Close is the last NAV in the bar.
On the daily timeframe a bar holds a single NAV, so high and low collapse onto open and close. On weekly and monthly bars they are a real range, which is why the chart opens on weekly, and why high/low-based indicators read best there. The first visit adds the 10-week and 30-week EMAs the watchlists use.
Before charting, the NAV history is cleaned: a face-value change that rebases the unit by a power of ten is back-adjusted so the line is continuous, and one-day bad prints that revert are ignored. The page states what was adjusted. It also warns when you open an IDCW plan — its NAV drops on every payout and draws false breakdowns — and when a fund has under a year of history.
Fund studies
| Study | What it shows |
|---|---|
| RS vs Benchmark | Fund NAV ÷ its benchmark, rebased to 100; rising means outperforming |
| Mansfield RS | Relative strength against its own moving average, centred on zero |
| RS vs Category Median | Against a chained index of the median daily return of live Direct-Growth peers |
| Drawdown from ATH | How far the NAV is below its running high |
| Rolling Returns | Trailing 1, 3 or 5-year return, annualised beyond a year |
| Rolling Sharpe & Sortino | Annualised, over a chosen window |
| Beta, Capture & Tracking Error | Rolling, against the fund's benchmark |
| 52W High/Low & ATH | Levels drawn on the NAV |
| N-bar Breakout | Prior N-bar high and low; 13 weekly bars matches the breakout list |
The benchmark and category series are aligned to the fund's own NAV dates, so a study never pairs the fund with an index level from a day the fund did not publish.
The watchlists
Lists are rebuilt nightly after the NAV update, for Direct-Growth funds only (Regular duplicates the same portfolio, IDCW distorts the line), excluding schemes whose last NAV is more than ten days old. They use the same calculations as the chart, so a fund on a list matches what its chart draws.
| Group | Lists |
|---|---|
| Highs | All-time high today, all-time high this week, 52-week, 3-month and 1-month high |
| Lows | 52-week, 3-month and 1-month low; more than 20% below the all-time high |
| Moving averages | NAV above the 50 or 200-day EMA or SMA; below the 200-day EMA; close above 10W EMA above 30W EMA; 10W EMA crossing above or below the 30W this week |
| Breakouts | Weekly close above the highest of the prior 13 weekly highs |
| Strength | RS vs benchmark at a 52-week high; top 10% of category on 3M or 6M momentum (categories of five or more) |
| Recovery | Back at an all-time high this week after a fall of more than 15% within the year |
| Quiet before a move | Tightest 4-week range in about six months |
Worked breakout example: if the prior 13 weekly highs peak at ₹48.20 and this week closes at ₹49.10, the fund is (49.10 ÷ 48.20 − 1) = 1.9% above the level and appears on the list.
Filters and limits
- Equity-oriented by default. Debt, gilt and debt-like funds — arbitrage, target maturity, liquid, overnight, bond ETFs — drift up almost daily and would crowd every high and breakout list, so the default filter excludes them. Switch to All asset classes to include them.
- Young funds. A fund under a year old can appear on 52-week and all-time high lists, where its 52-week high is its since-launch high, marked with a history pill. "Hide new funds" removes them.
- Patterns are not predictions. A NAV crossing an average describes the past path. Pair it with the fund page before reading anything into it; see also NAV highs and lows.
Where to find it
- In Mutual Funds, click Charts in the menu.
- Pick a watchlist in the sidebar, set asset class and category, then use the arrow keys to move through the funds.
- Add a fund study from the indicator menu under the Fund category.
Common questions
Can you do technical analysis on mutual fund NAVs?
You can chart them, but a NAV is one number a day with no volume. FNOTrader builds weekly and monthly candles from NAVs and switches volume indicators off.
How are mutual fund candles created from NAV?
Open is the previous close, high and low are the highest and lowest NAVs in the bar, and close is the last NAV. Daily bars therefore have no real range.
How often are the NAV watchlists updated?
Nightly, after the NAV update, for Direct-Growth funds with a recent NAV.
Why are debt funds missing from the all-time high list?
The default Equity-oriented filter excludes debt and debt-like funds because their NAVs rise almost every day. Choose All asset classes to include them.
More on Mutual Funds
More in Mutual Funds · App: Mutual Funds · Definitions: glossary · All: every article